
Published: April 9th, 2020
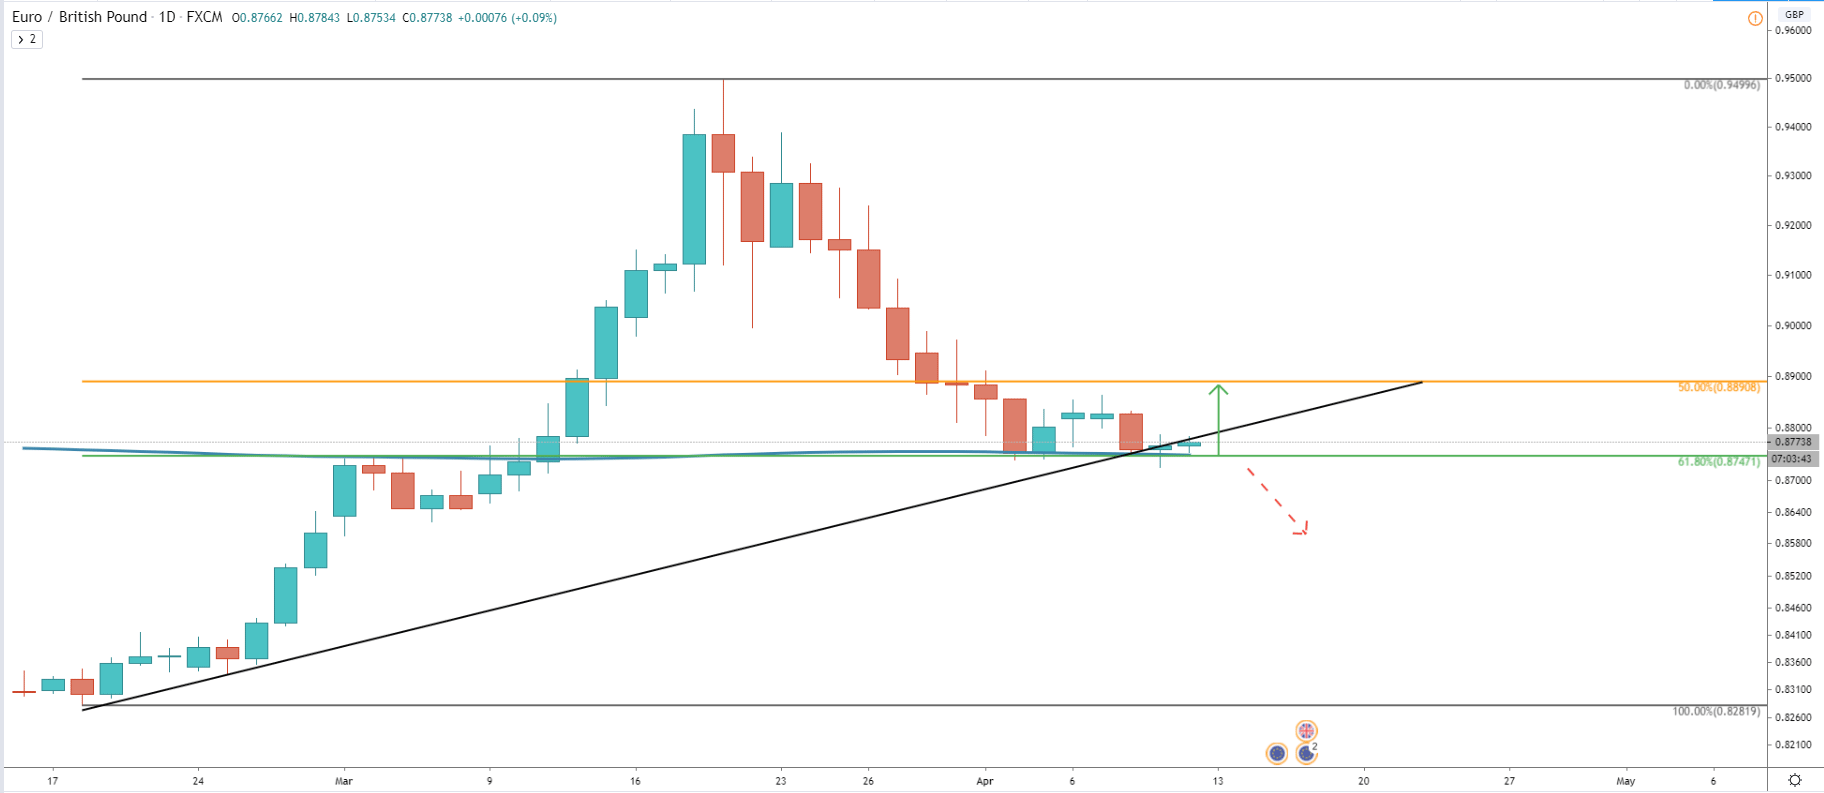
The EUR/GBP currency pair has established a long term uptrend on a Daily chart. The last wave up resulted in a 10% growth during the course of only 10 days. Pair has moved from 0.8622 up to 0.9500, which is 878 pip growth. This is pretty huge considering EUR/GBP volatility in the past. The most recent price action resulted in the correction to the downside where price declined by over 8%. It found the support at the 61.8% Fibonacci retracement level applied to the last wave up.
The support level is located at 0.8784 and has been rejected clearly on April 8. Price attempted to break below, but only produced the spike and failed to close lower. This is the sign of a potential long term uptrend continuation as pair also produced a double bottom.
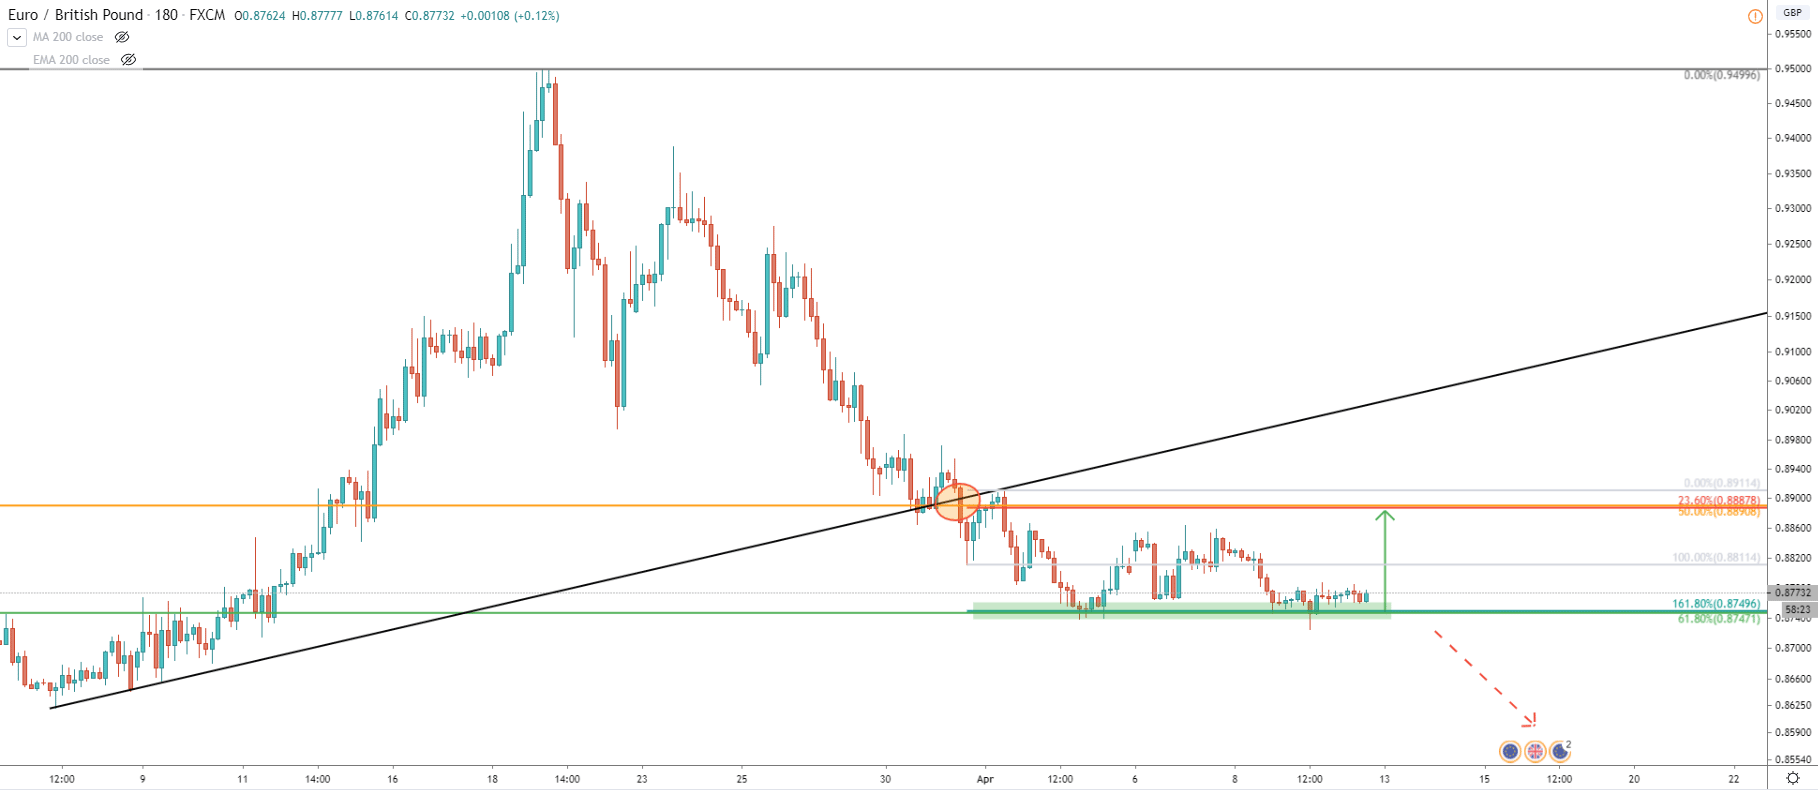
The 3H chart short more cleanly that there is strong support being formed around 0.8750 area. What is also important is that the support corresponds to the 161.8% Fibonacci retracement level, applied to the corrective wave up after breaking the downtrend trendline. The very same Fibonacci indicator corresponds to the potential upside target which is seen at 0.8890 area. Just to remind you, that on the daily chart this is the 50% Fibs, making this level a very strong resistance for EUR/GBP.
While we might be witnessing a long term uptrend continuation, it will be very important to see the price action around the 0.8890 resistance area. Because only a clean daily break and close above it might confirm further long term growth.
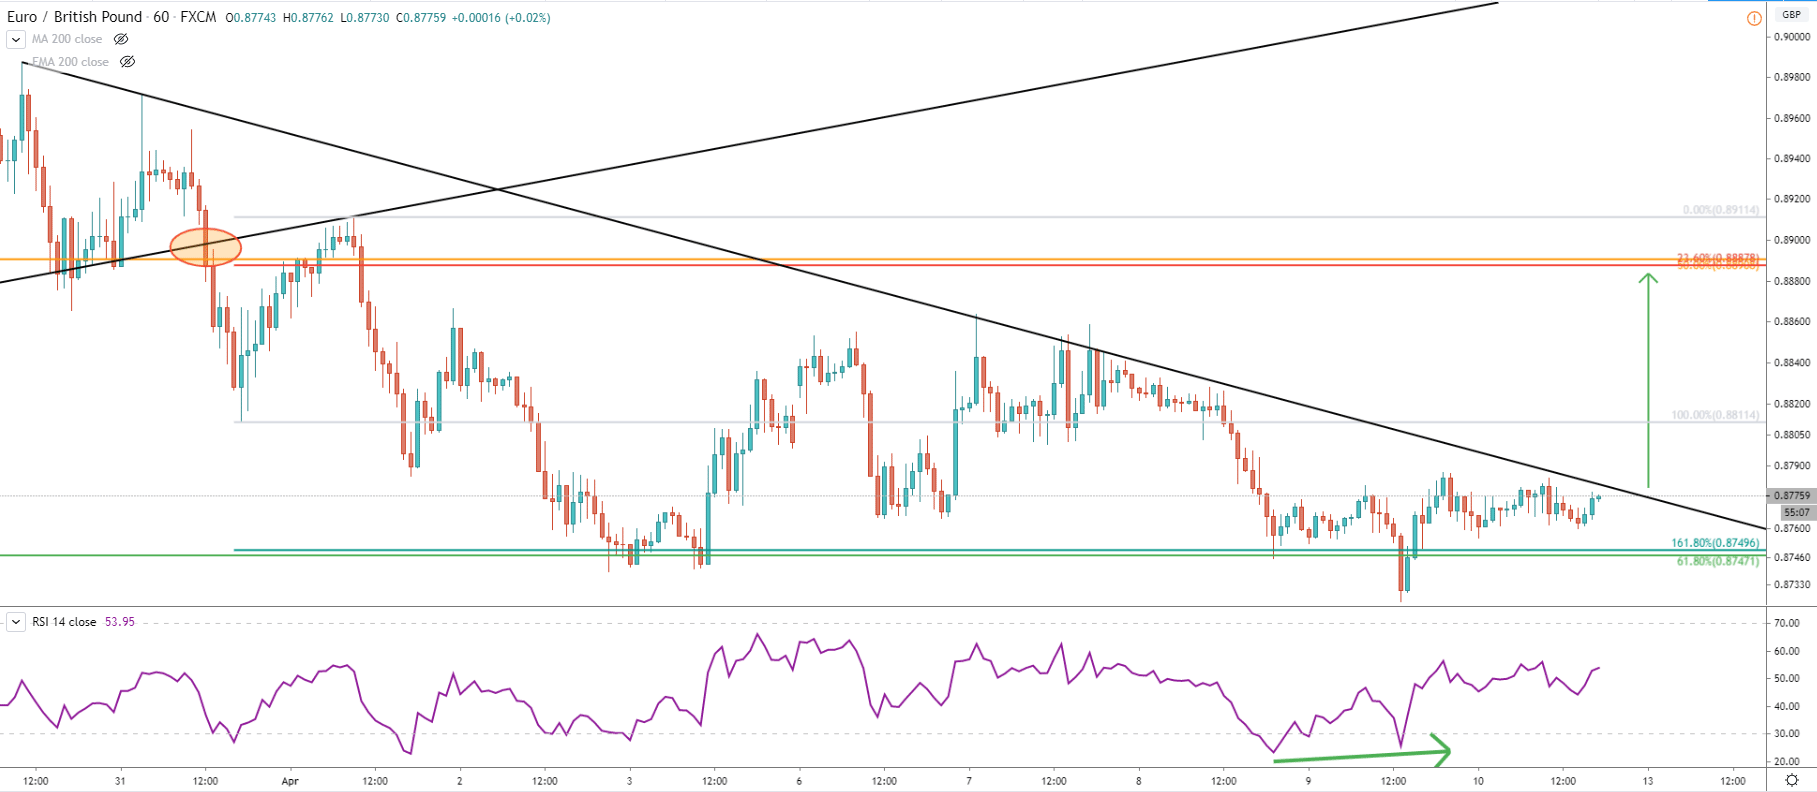
But while the growth can be expected, perhaps it is best to wait until the downtrend trendline will be broken on the 1H chart. When/if the price manages to break and close above, it could be the starting point of the upside rally towards the nearest resistance at 0.8890. Another factor worth mentioning is the formation of the bullish divergence on the RSI indicator, which also suggests the upcoming move to the north.
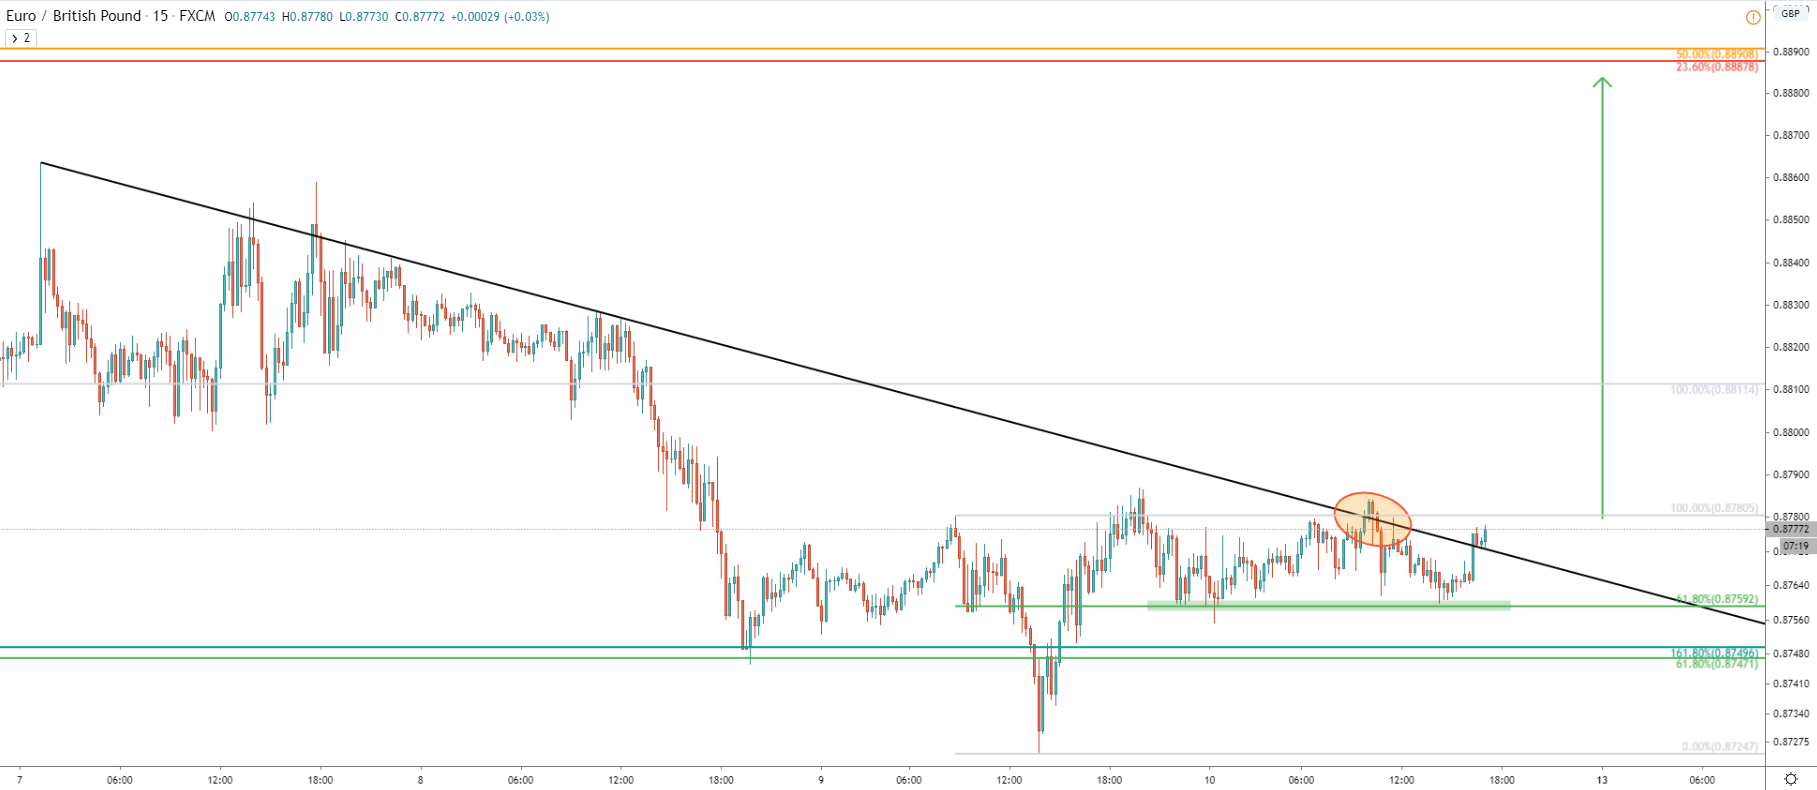
At the same time, we can see the breakout of the downtrend trendline of the 15M chart. This seems to be the very early sign that bulls are getting ready to make a move. Perhaps the rally will start on Monday, which is April 13, because traders usually don’t like to have their positions opened during the weekend. This is because of recent huge price gaps after the weekend, which can carry big risk.
The overall trend for EUR/GBP is bullish, and current correction to the downside could provide a good buying opportunity for the short and even long term. As a confirmation of the upside move, it is best to wait for the downtrend breakout on the 1H chart.
The key resistance level is located at 0.8890, which is confirmed by two Fibonacci retracement levels. It is also very close to the 0.8900 psychological level, which could easily be tested sometime during the next week.
The 0.8750 has shown itself as very strong support. There was a spike below, which tested the 0.8724 level. If this price will be broken, with 4h close below, it would invalidate bullish outlook and can result in the continuation of the downside move.
Support: 0.8760, 0.8746, 0.8724
Resistance:0.8787, 0.8853, 0.8888