
Published: October 5th, 2020
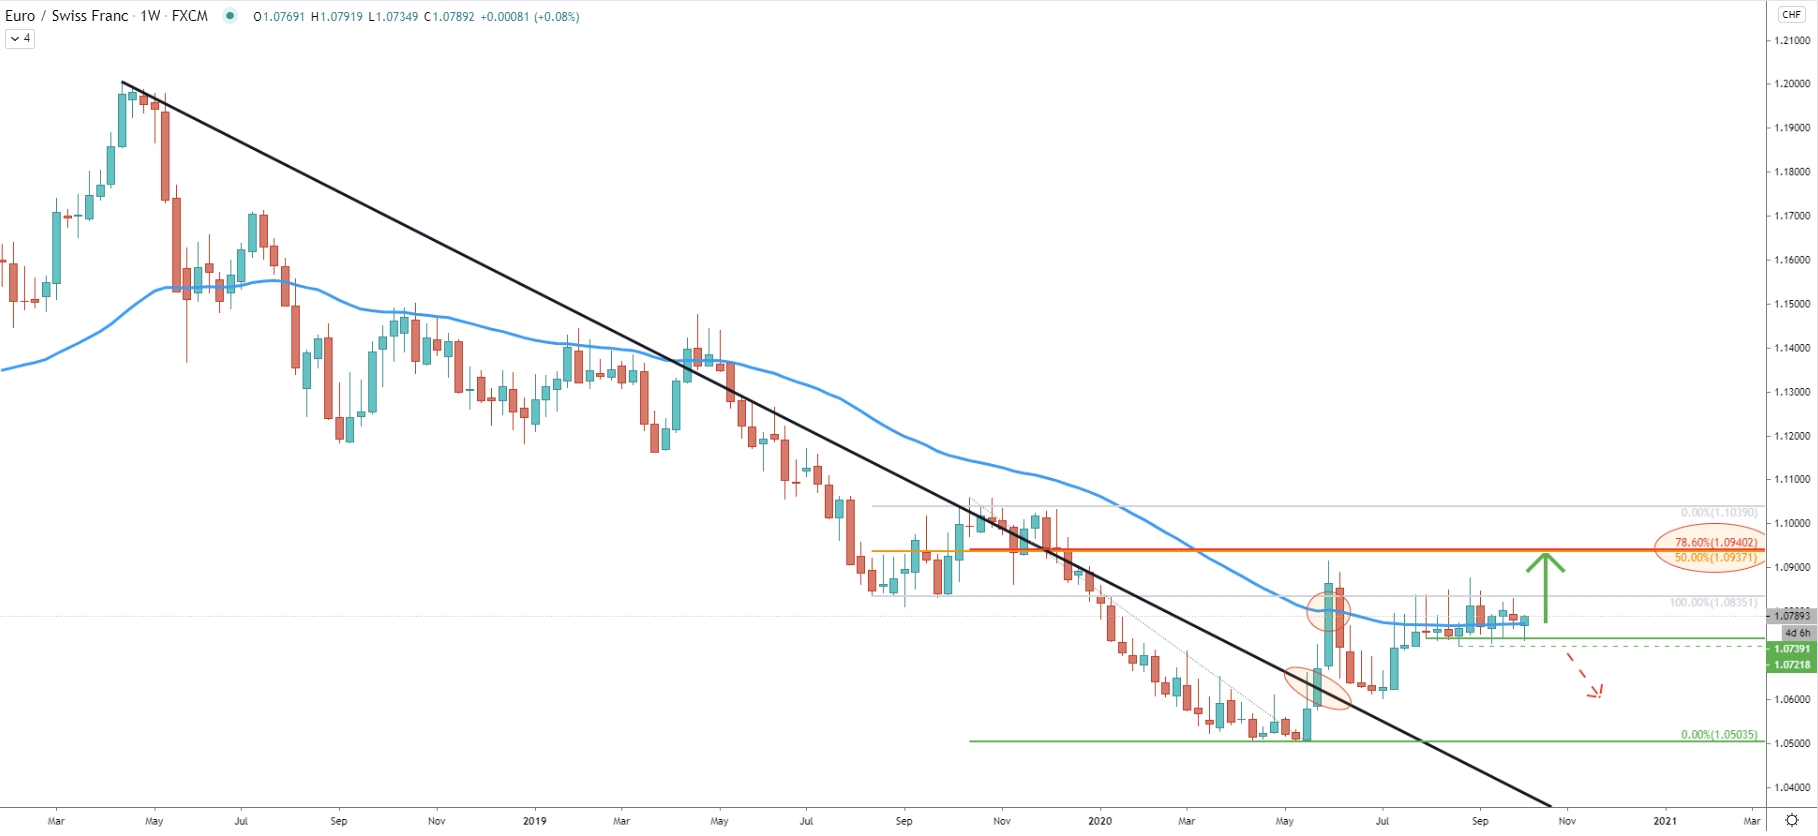
In May this year, EUR/CHF has found support at 1.0500 psychological level, where price formed a double bottom. The very same month, the pair went sharply up and broke above the downtrend trendline as well as the 50 Exponential Moving Average, suggesting a strong buying pressure in the long run.
During the past 3 months, EUR/CHF could not establish any sort of direction, but sooner rather than later there will be a breakout, which is likely to be to the upside. The nearest resistance is located at 1.0940 area, which is 150 away from the current level. This resistance is confirmed by two Fibonacci retracement levels, 50%, and 78.6% Fibs as per the weekly chart.
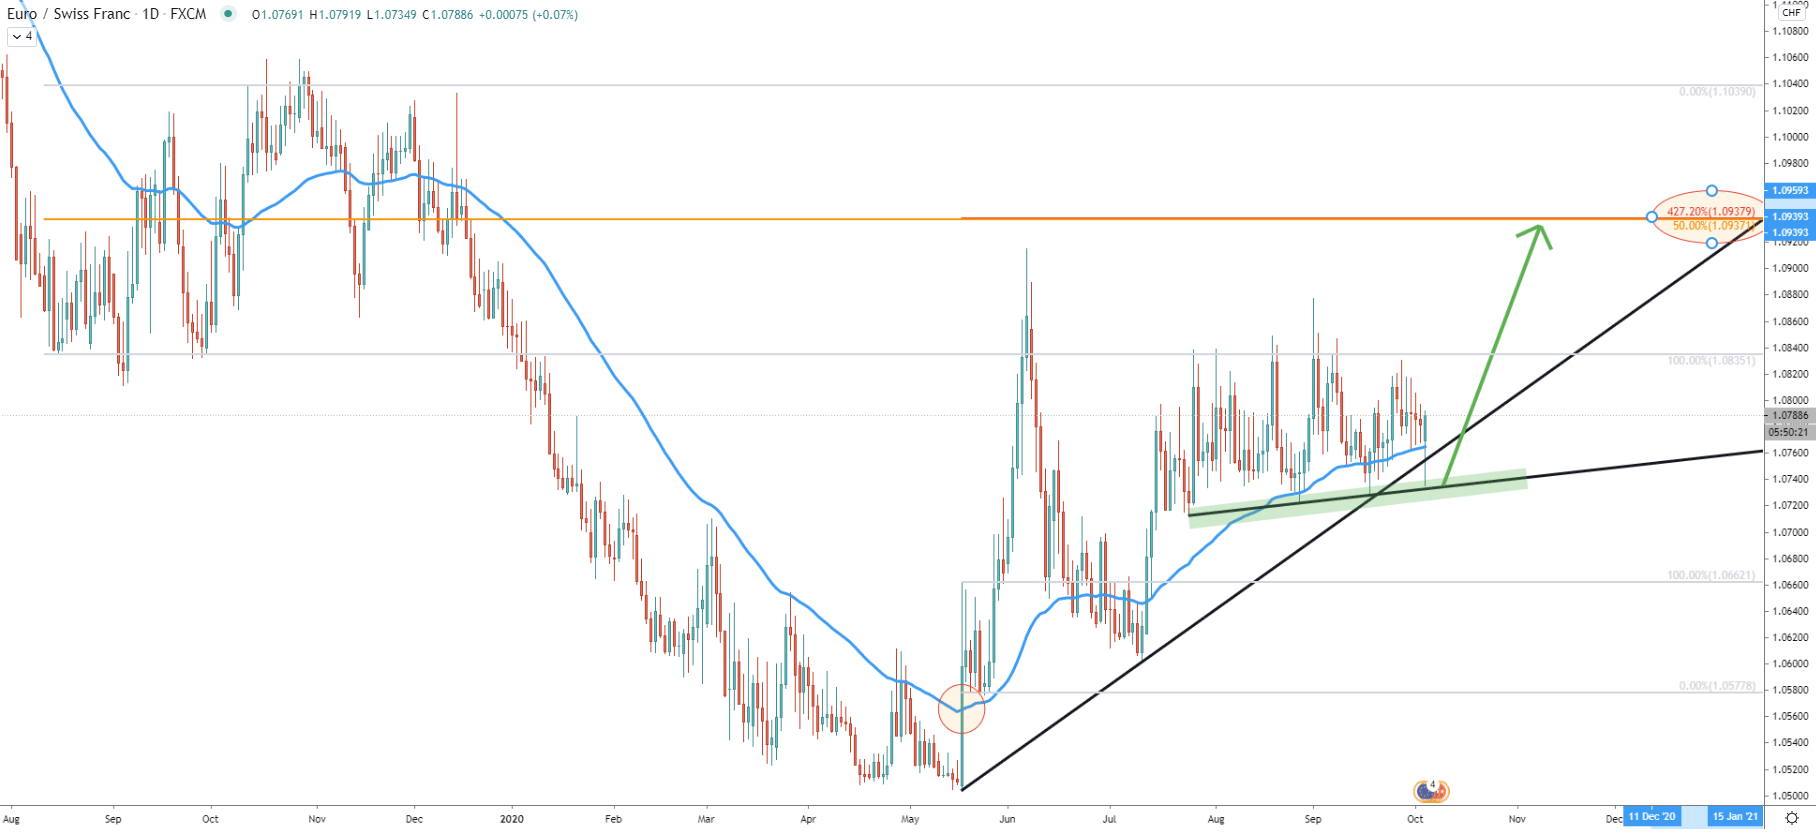
On the daily chart, today’s price has rejected two trendlines. First is the simple uptrend trendline, while the second is the support uptrend trendline. At the same time, the 50 EMA has been rejected as the price failed to break and close below. This is a very bullish price action, which might initiate the beginning of an uptrend continuation early this week.
The previously discussed resistance area near 1.0340 is now confirmed by 3 different Fibonacci retracement levels. 2 Fibs as per the weekly chart and 427.2% Fibs applied to the corrective wave down after breaking above the 50 EMA for the first time.
Today there was yet another rejection of the bottom of the ascending channel. Along with it, the 200 EMA was also rejected for the 4th consecutive time. The support area has been formed between 1.0721 and 1.0734, and as long as daily closing prices remain above, uptrend continuation is imminent. Perhaps EUR/CHF will be moving up towards the top of the ascending channel, to test the 1.0937 resistance level.
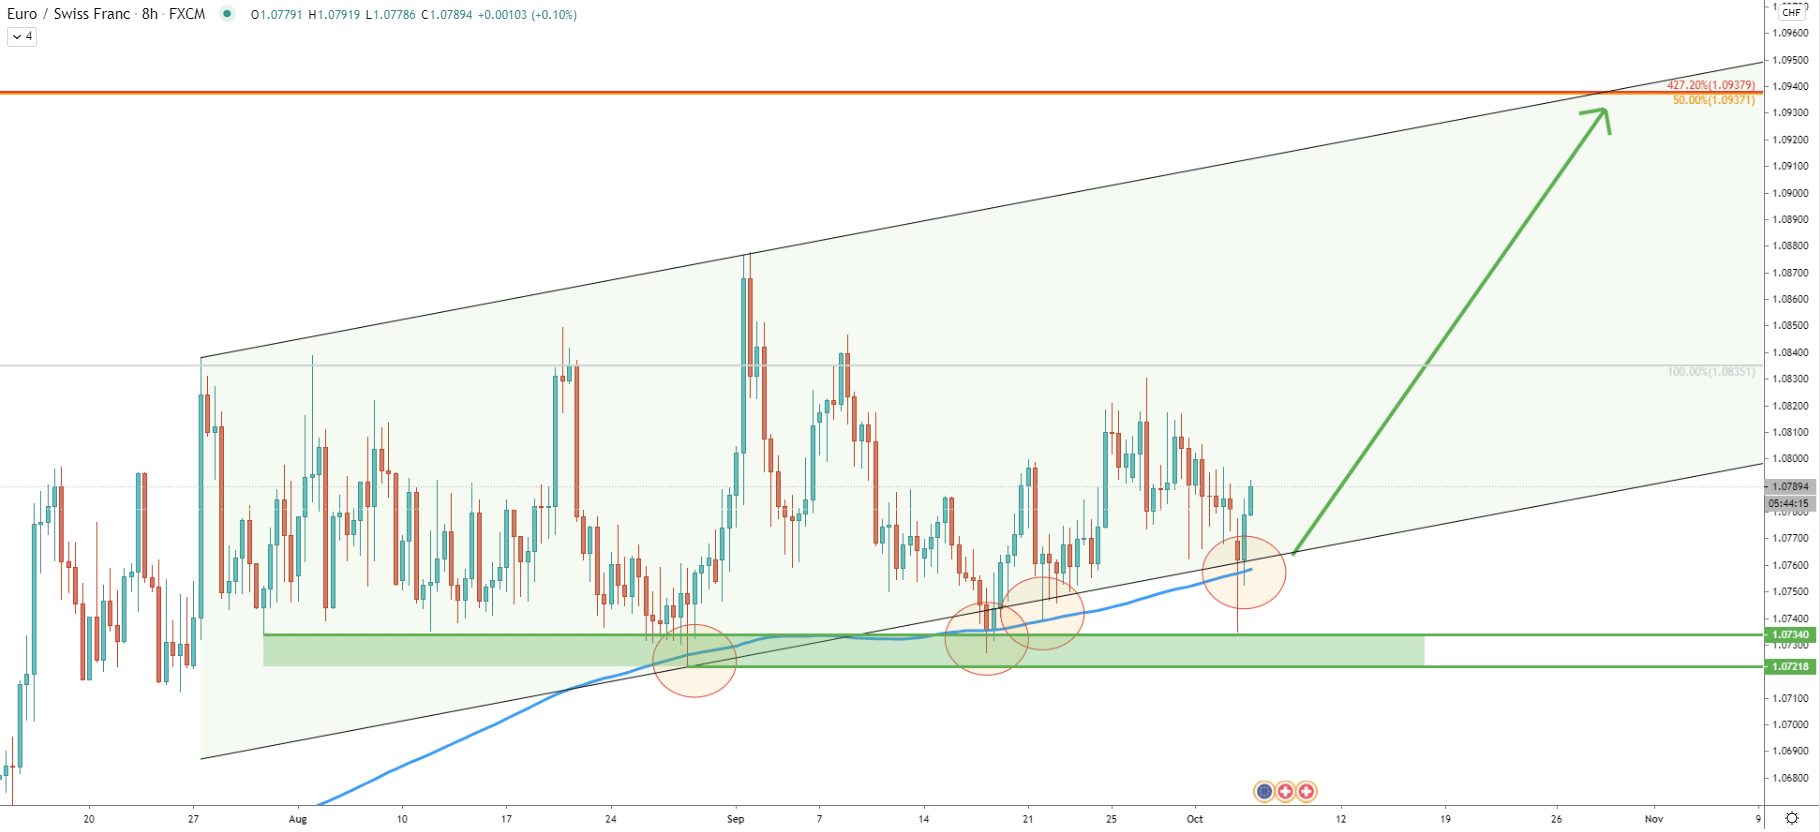
At the end of August, EUR/CHF rejected the 200 SMA on the 4-hour timeframe, which up until now is being respected. There were attempts to break lower where price spiked down below the SMA, although no clear break and close below has been established. It shows the importance of the 1.0734 support level, which today was rejected very precisely.
Prior to today’s’ downside move, EUR/CHF broke above the descending channel, yet again confirming bullish sentiment, and today on the spike down, there was no confirmation of the 200 SMA breakout. While short term consolidation could take place, EUR/CHF starting to look extremely bullish in the medium to long term.
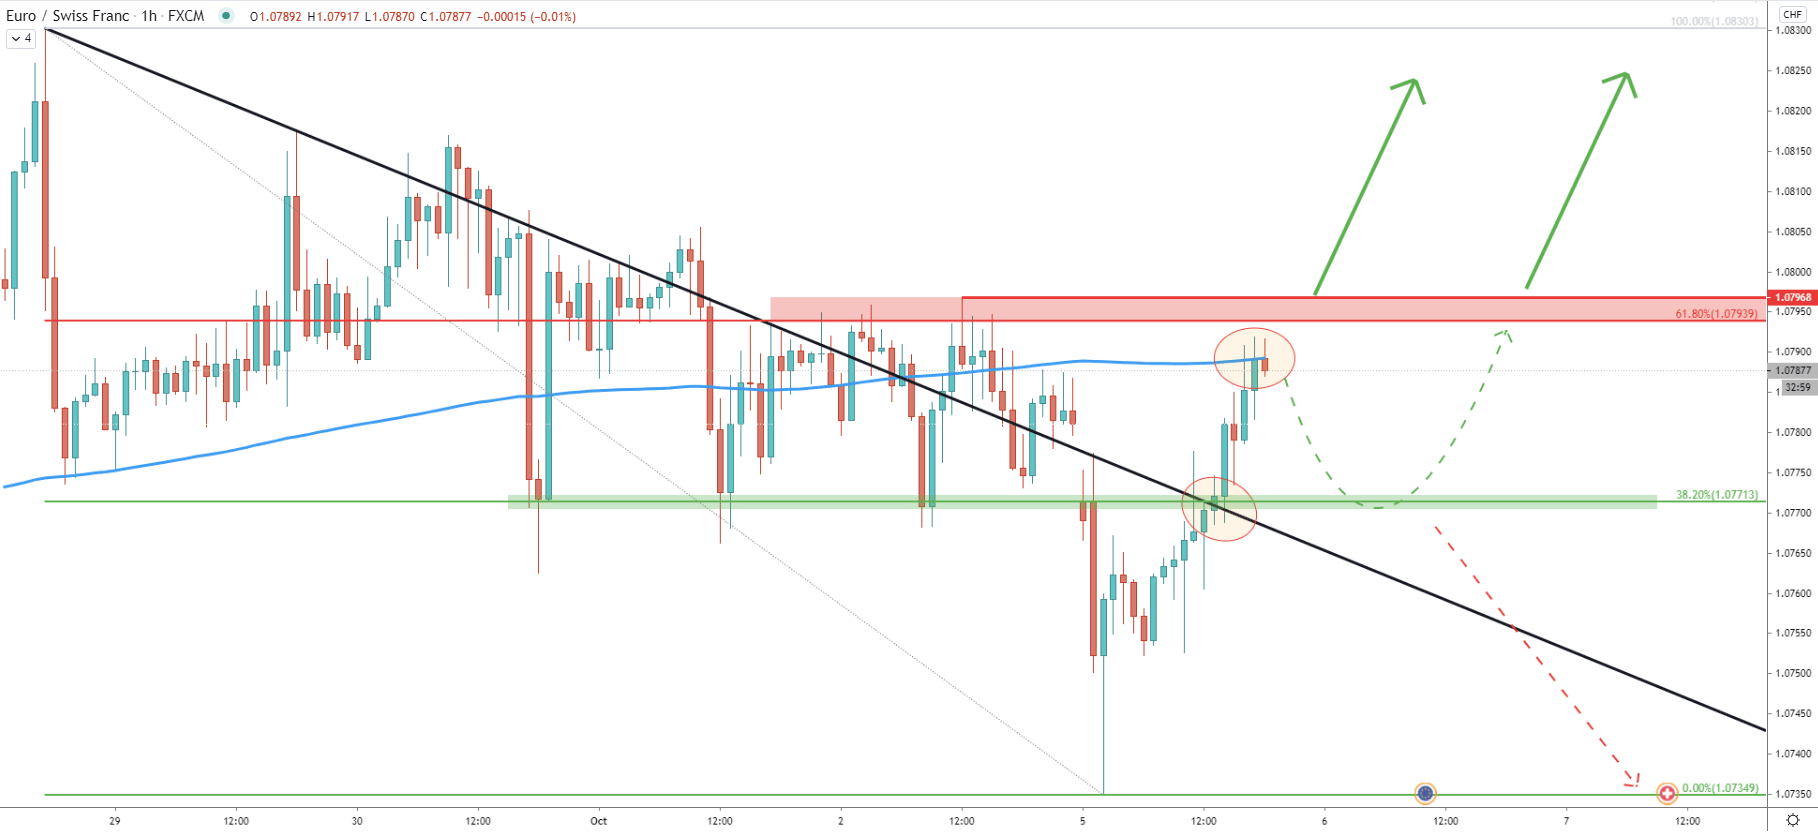
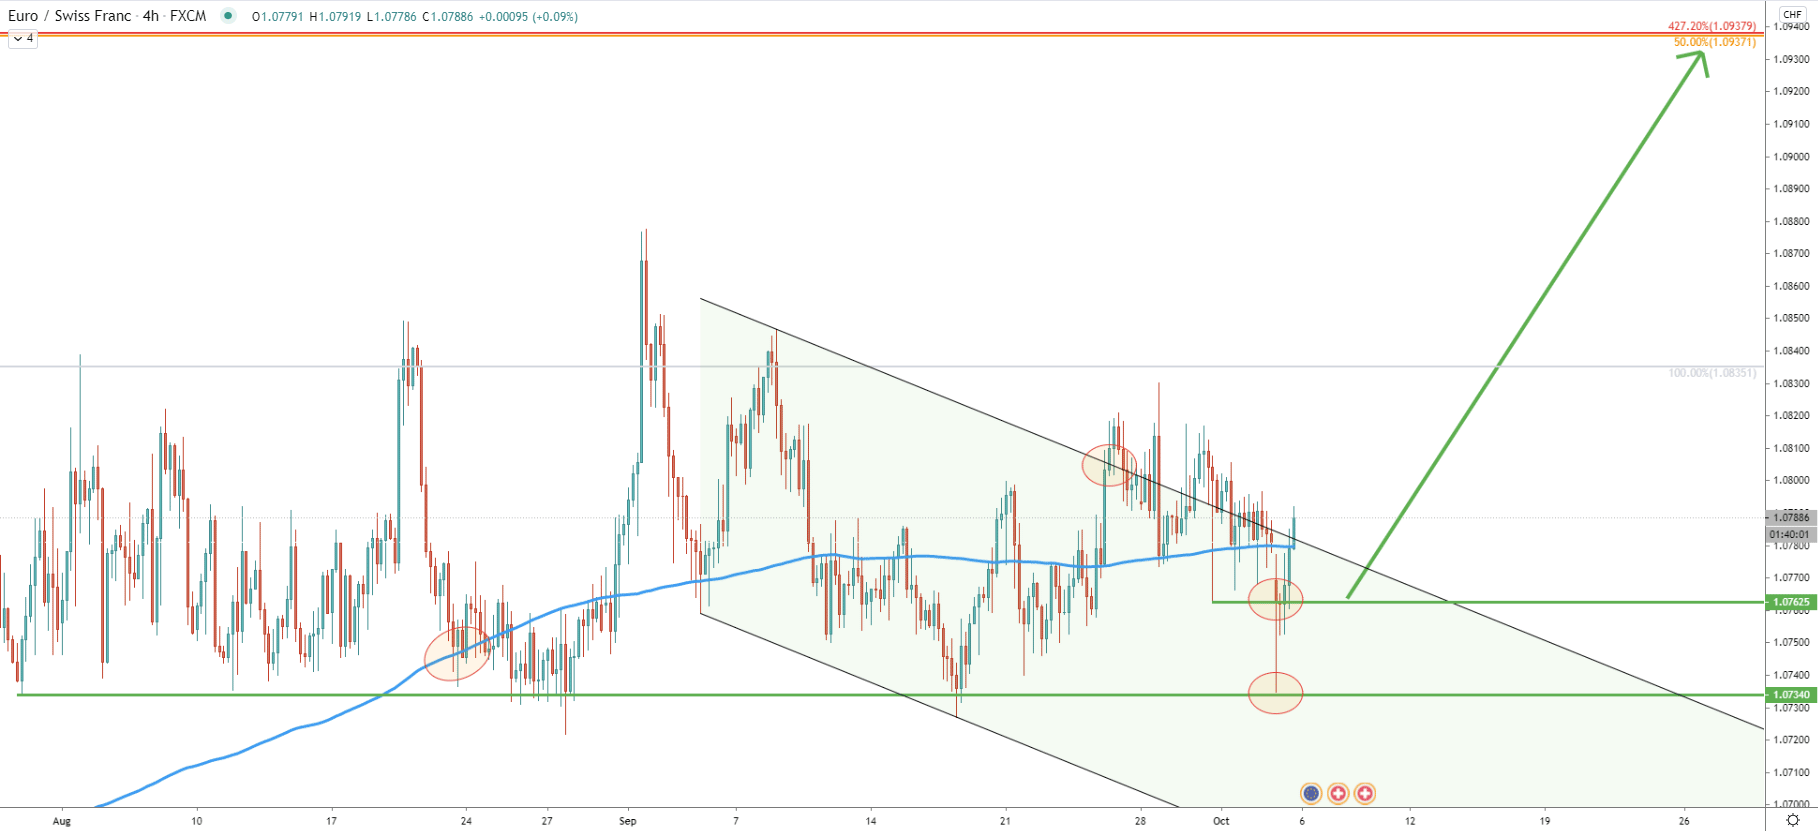
Finally, on the 1-hour chart, there was a break and close above the downtrend trendline and the price has reached 1.0791 high. Currently, EUR/CHF could be struggling to break to the upside because 200 SMA is acting as the resistance. This might result in a small pullback, where EUR/CHF can re-test the 1.0771 support, confirmed by 38.2% Fibonacci retracement level.
But, further growth could also continue without any downside move. The next resistance is located between the 1.0800 - 1.0794 area, which is confirmed by the 61.8% Fibonacci retracement level. Maybe buyers will be waiting for a confirmed daily or hourly break and close above the 1.0800 psychological resistance, before taking any action.
The consolidation phase, which has been going for 3 months, is likely to end very soon. The confirmation of the bullish trend should be a daily break and close above 1.0800 psychological resistance, which is likely to result in a price increase of 150 pips.
The key resistance is located at 1.0937 and is confirmed by 3 different Fibonacci retracement levels. If/when the price will start to move up, this resistance could be tested in a relatively short period of time, potentially 1 or 2 weeks.
As per the weekly chart, only daily and/or weekly break and close below 1.0721 support will invalidate the bullish forecast. In this case, the pair might be heading towards the 1.0500 key long term support.
Support: 1.0762, 1.0734,1.0721
Resistance: 1.0800, 1.0835, 1.0937


