
Published: December 18th, 2020
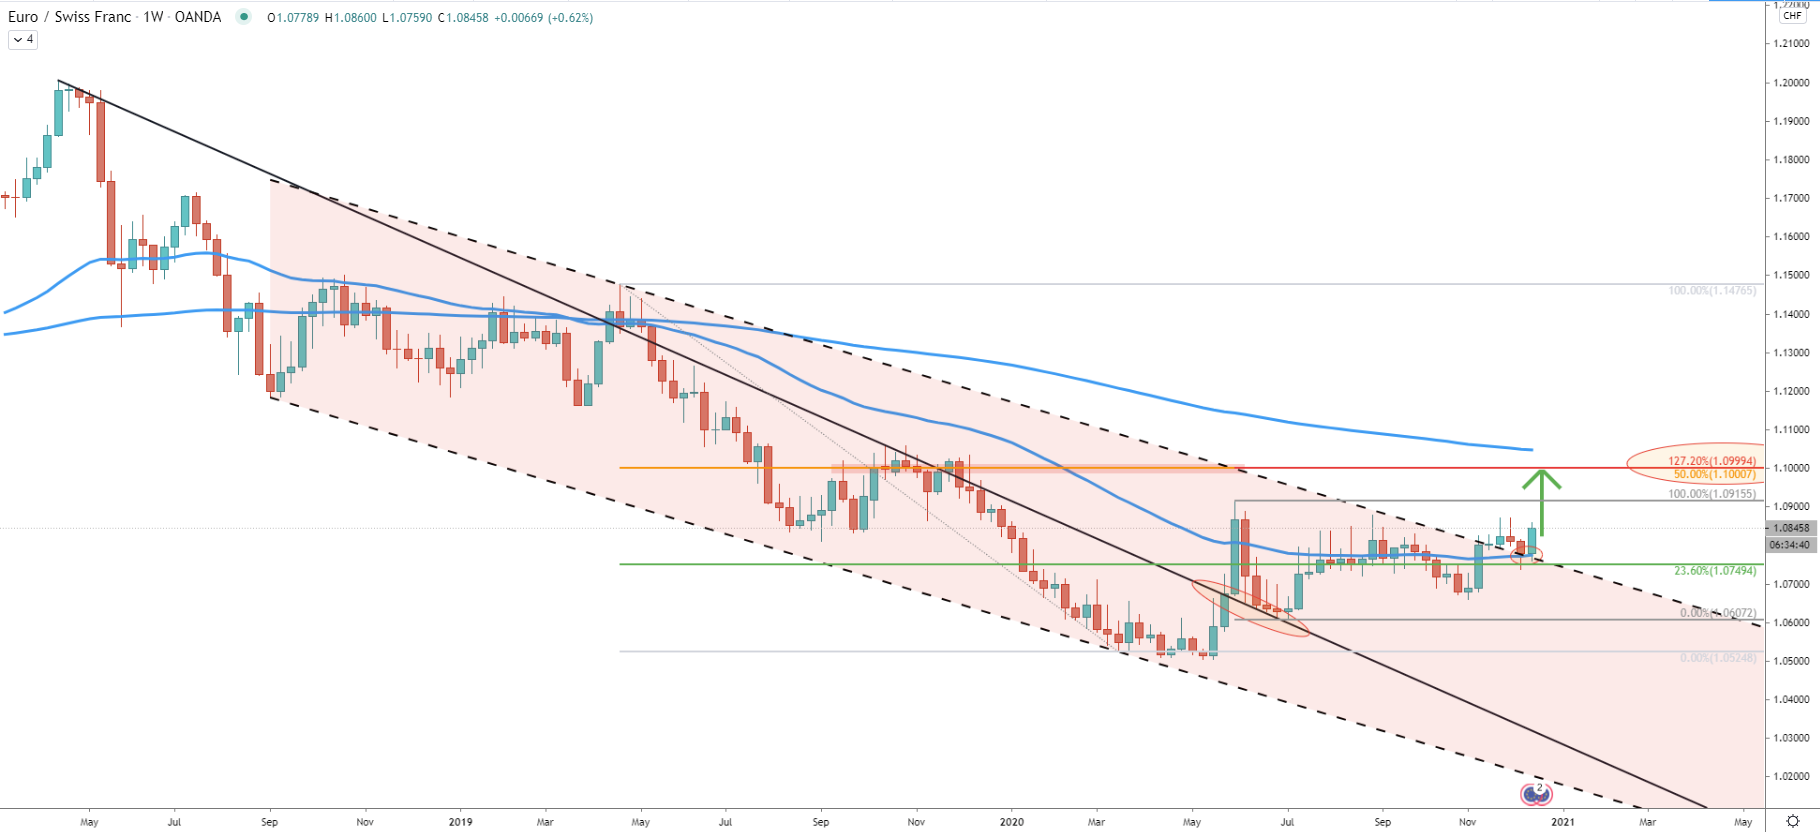
From May 2018 up until May 2020 EUR/CHF has been consistently trending down, resulting in a 1500 pip price decline, which equals a 12.5% drop. It was a significant downtrend, and right now it seems like the long term sentiment for EUR/CHF could be changing. The price action of the past few weeks shows, that the 23.6% Fibonacci support at 1.0749 got rejected along with the 50 Simple Moving Average. At the same time, price broke above the long-term descending channel, potentially signalling on a strong bullish pressure about to emerge.
As long as the price remains above 1.0700 psychological level, Fibonacci support and the 50 SMA, the uptrend should be expected to continue. The nearest and the strongest resistance is located at the strong psychological level, which is 1.1000. This level is confirmed by two Fibs, 127.2% and 50% as can be seen on the chart. Besides, it goes in line with the 200 SMA, which might be acting as the resistance in the next two weeks if the uptrend will be the case.
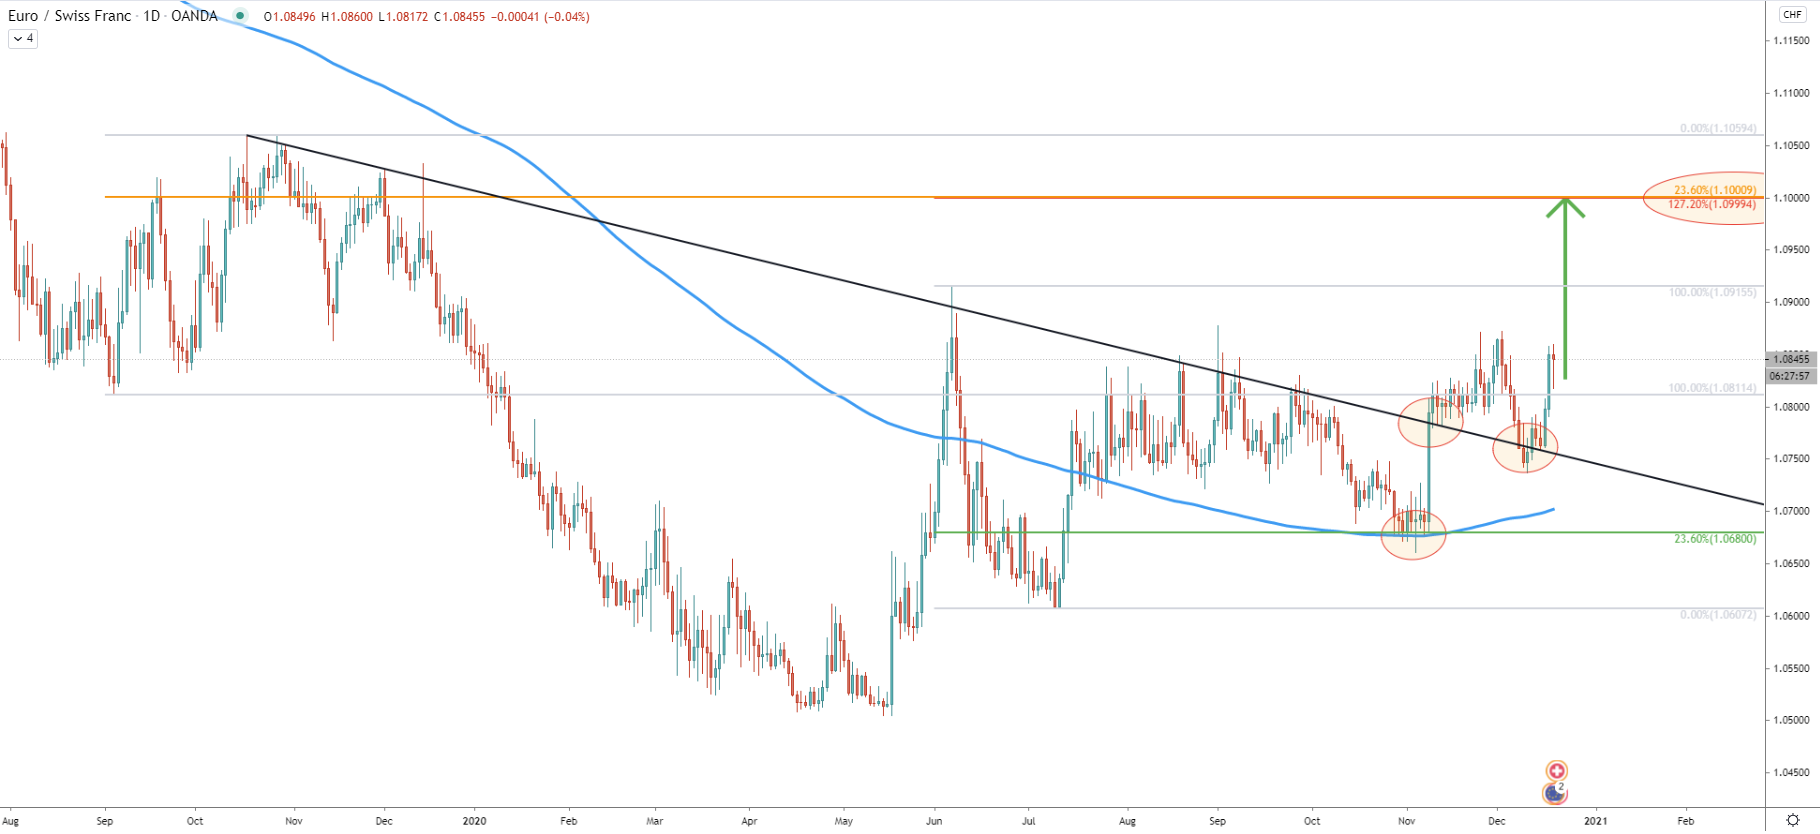
On the daily chart, price is still showing that the consolidation phase ongoing, because the 1.0900 resistance area hasn’t been broken. But at the same time, it can be seen that lower highs are starting to appear and EUR/CHF is rejecting support indicators one by one. Back in November, there was a rejection of the 23.6% Fibs at 1.0680, along with the 200 Simple Moving Average. Then the price went up sharply and broke above the simple downtrend trendline. On the pullback, it rejected the redline, which acted as the support, and it seems like the price will attempt to produce a new higher high.
The previously mentioned key resistance at 1.0000 is now confirmed by yet another Fibonacci retracement level, which is 23.6% Fibs applied to the previous corrective move up occurred back in 2019.
Yet another downtrend trendline was broken, the major and the minor. The minor downtrend trendline was broken early November, after which price went up, rejected the major downtrend trendline and corrected down towards the previously formed support. This support at 1.0738 was rejected, and then EUR/CHF finally broke above the major downtrend trendline. It certainly looks like the long-term uptrend is just about to begin. Nonetheless, downside corrections might take place, but it is highly likely that the major downtrend trendline will act as strong support for the time being.
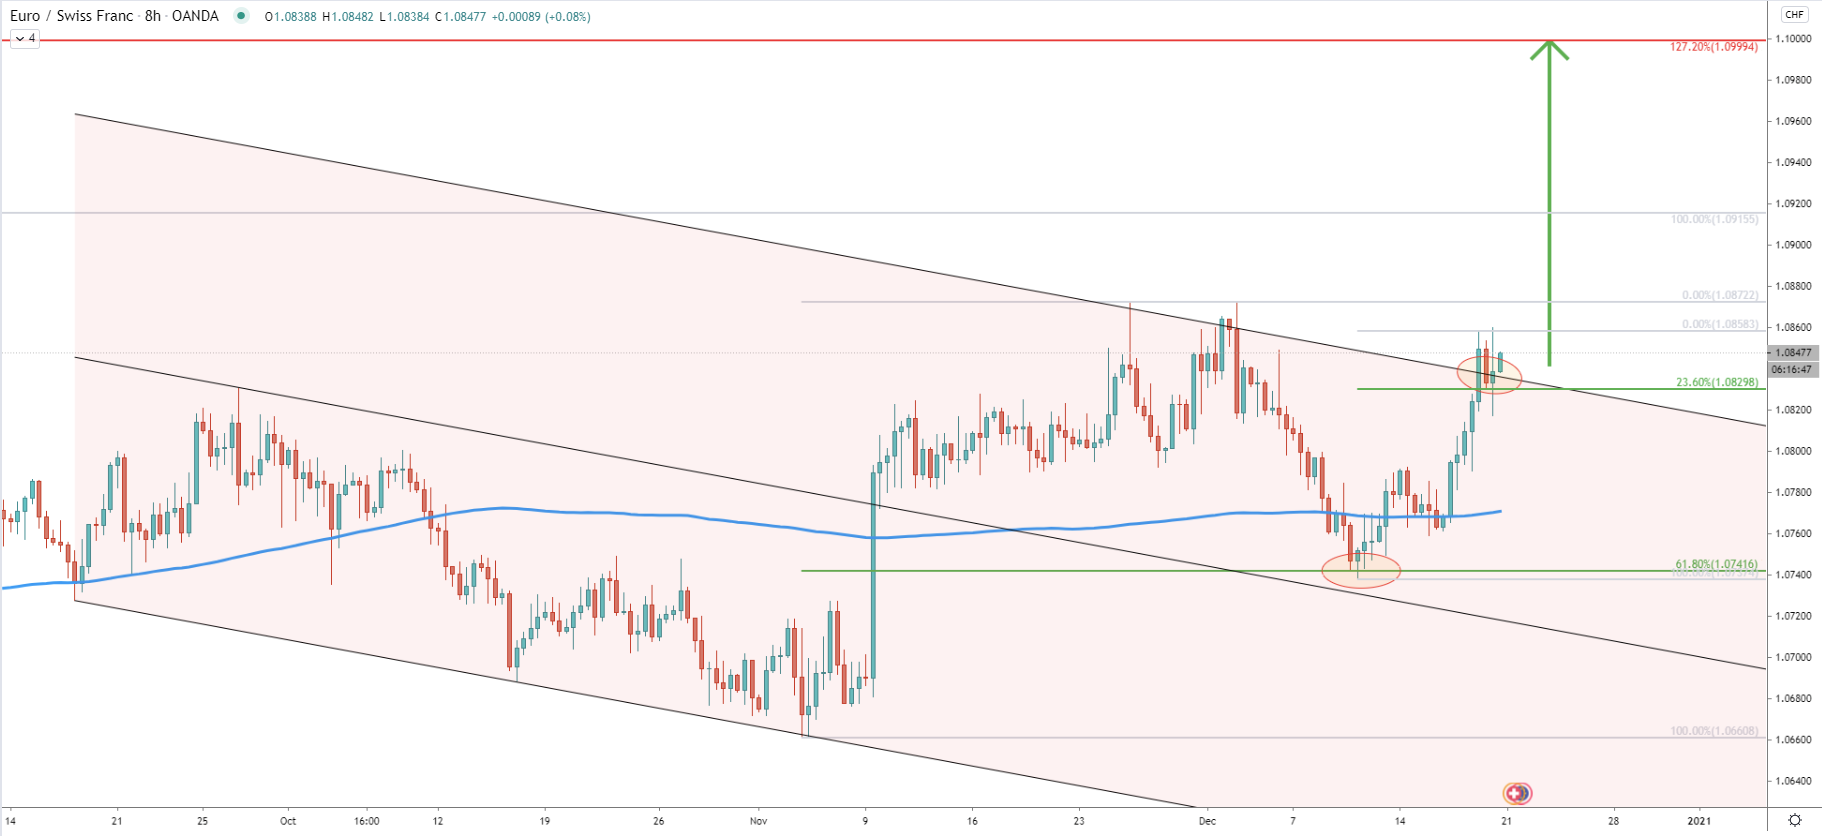
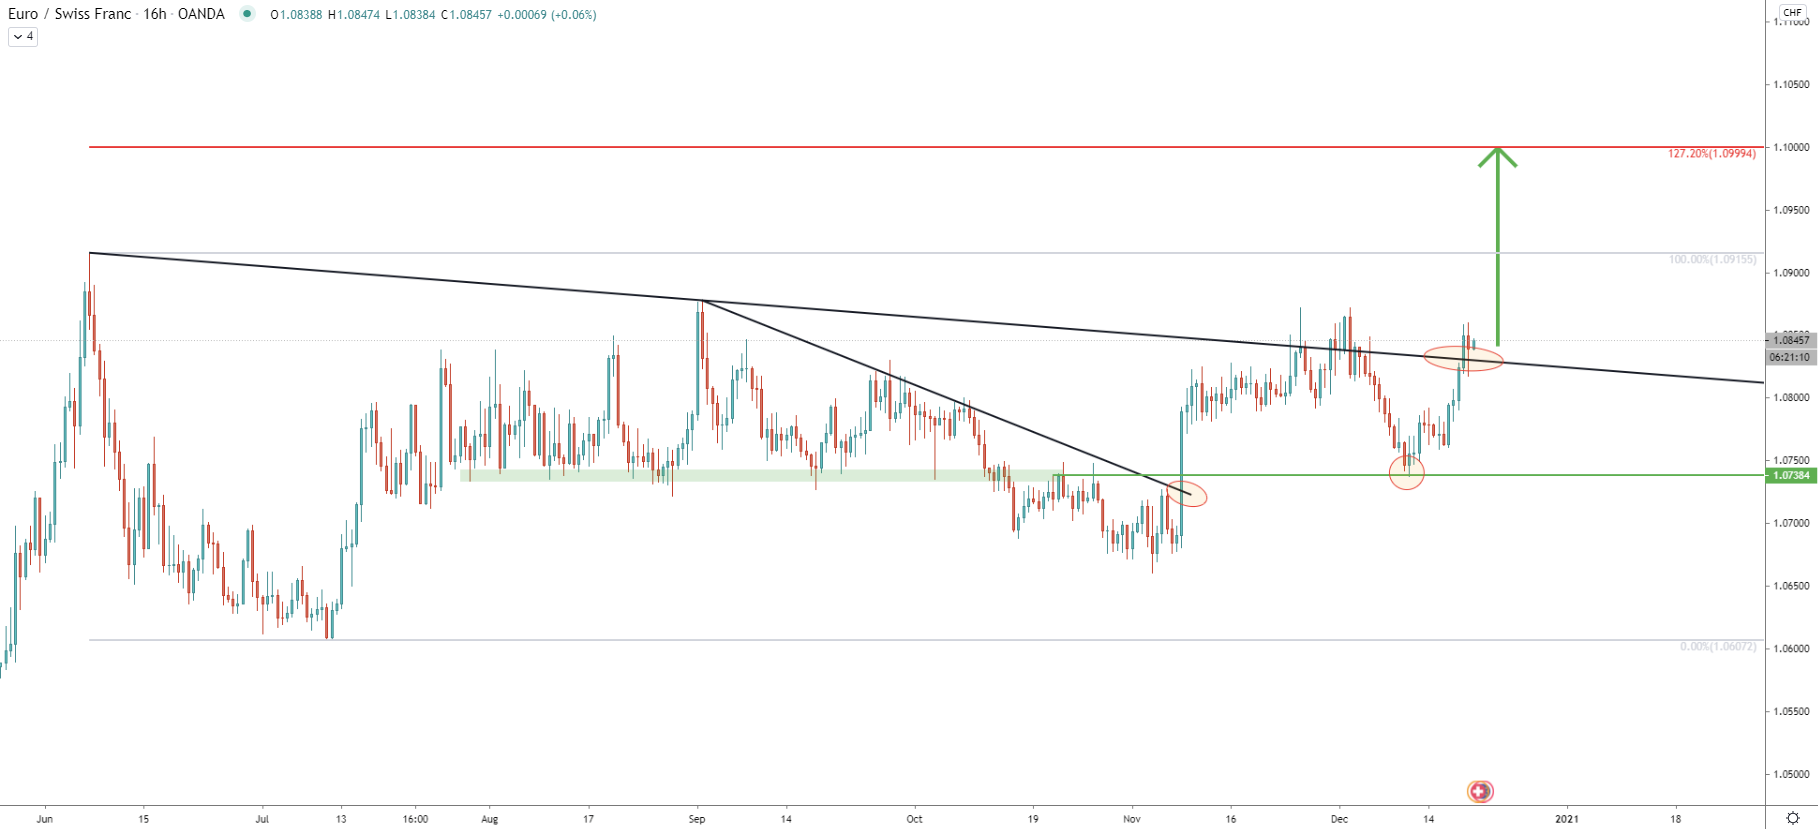
We already saw multiple breakouts of the trendlines as well as the descending channel on the weekly chart. On the 8-hour chart price also broke the descending channel and has reached and rejected the top of the extended channel. This week price broke and close above the upper trendline of the channel, validating the uptrend yet again.
After the breakout, a small pullback took place, but EUR/CHF rejected the 23.6% Fibs at 1.0829. While there is still a risk of a stronger correction, in the worst-case scenario of an uptrend, EUR/CHF might re-test the 1.0740 support, which is confirmed by 61.8% Fibonacci level.
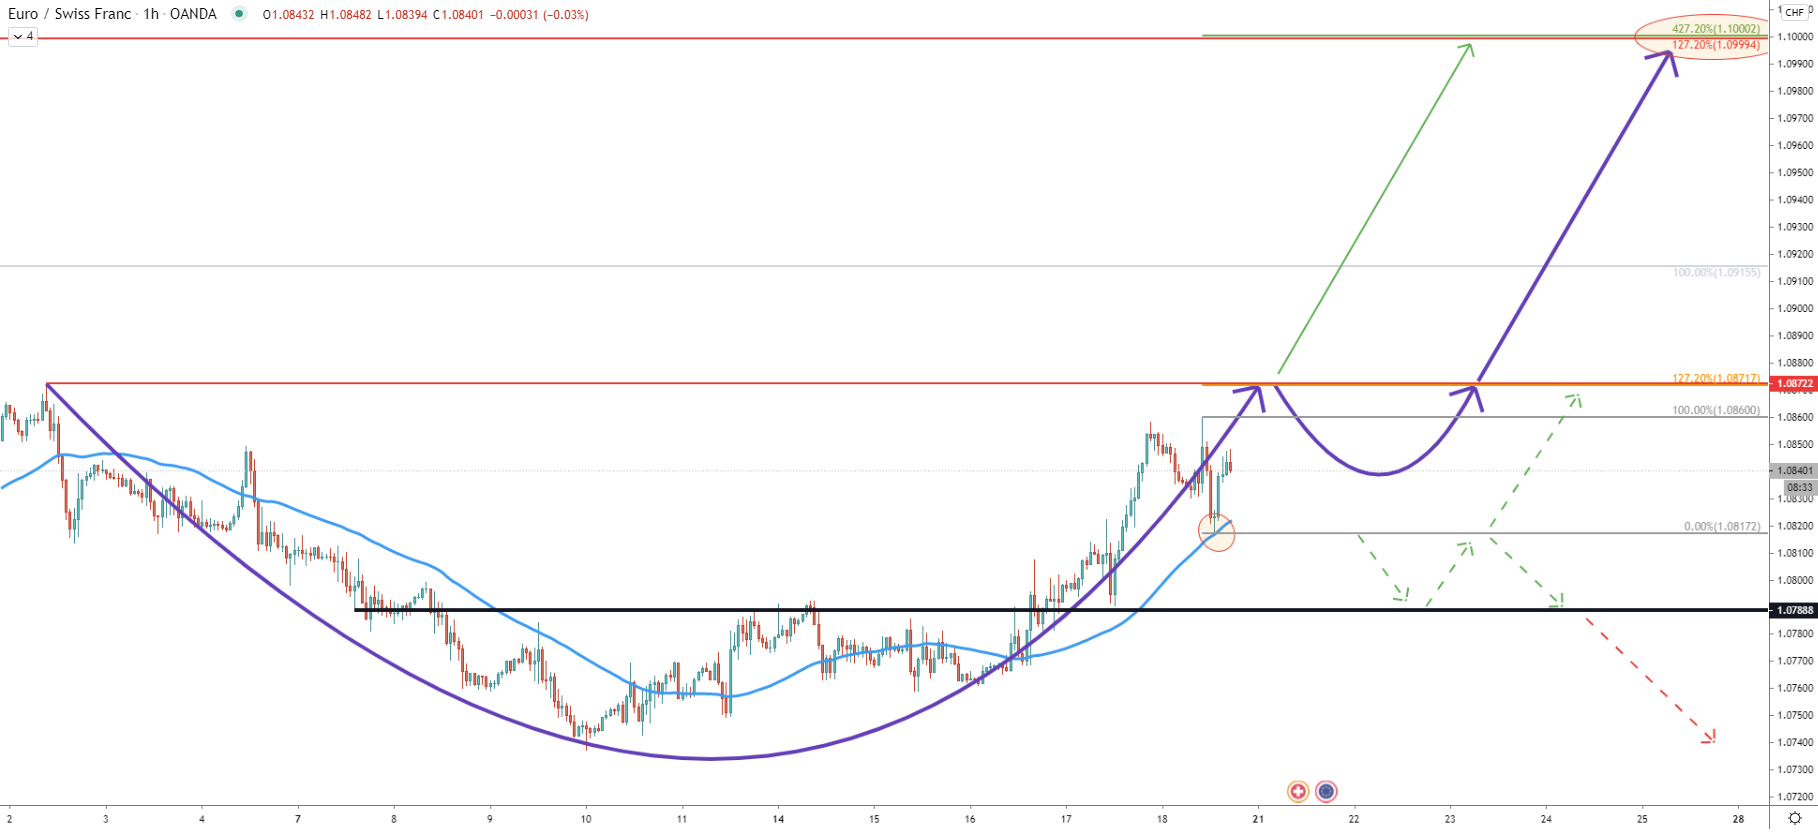
On the 1-hour chart, the price could be forming a “cup and handle” trend continuation pattern. It meanest that the nearest resistance at 1.0872 is likely to be rejected at first. Then pullback will take place and only after that the strong uptrend will begin.
Today there was a clean bounce off the 50 SMA, confirming the validity of a bullish trend on the lower timeframe. It will be very important to see the break above 127.2% Fibonacci resistance at 1.0872 for the uptrend to start. Because if it will get rejected and EUR/CHF will start to produce lower lows, It is highly likely that 1.0788 supply/demand area will be tested once again.
The EUR/CHF could be right at the key moment in time, where the larget uptrend is emerging. The nearest resistance is 160 pips away, which is a strong move for such a currency pair as EUR/CHF.
As per the Weekly, Daily and 1-hour chart, there are 4 different Fibonacci retracement levels all pointing out to one price. This price is 1.1000, an extremely strong psychological level, which is expected to be tested in the next week or two.
As per the 1-hour chart, nearest support is at 1.0817, where 50 SMA was rejected cleanly today. Break below this level will not invalidate bullish outlook but will make it much less attractive for buyers. And only break below the 1.0788 could be the confirmation of the bearish trend, which is likely to result in prince drop towards the 1.0740 previously formed support.
Support: 1.0830,1.0815, 1.0740
Resistance: 1.0870, 1.0915, 1.1000


