
Published: October 23rd, 2020
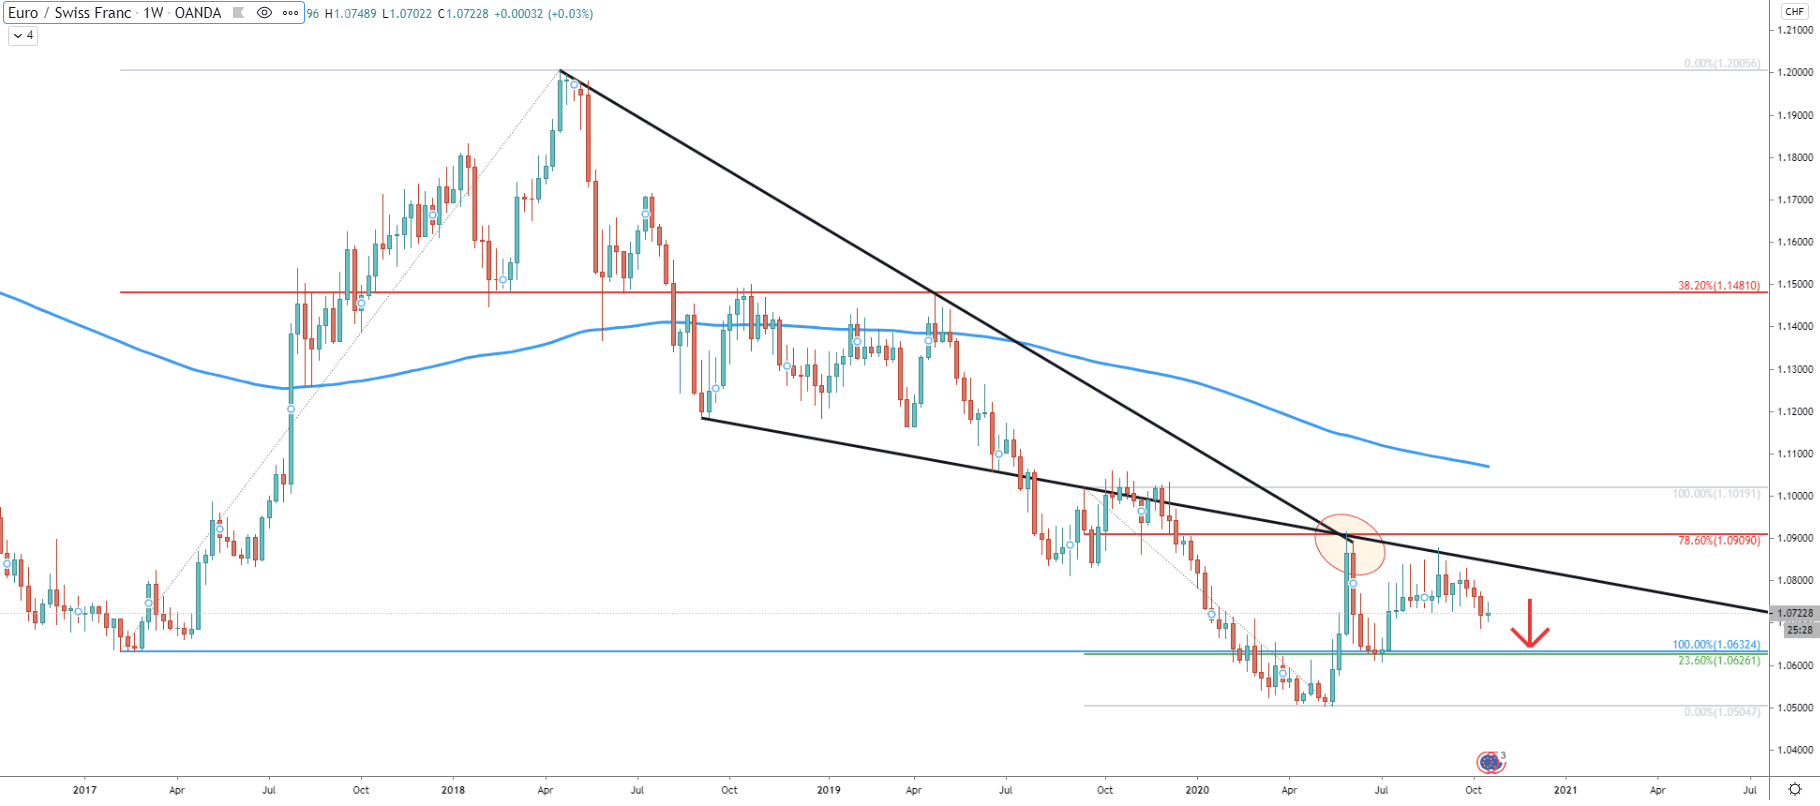
The long term EUR/CHF price action shows a clear bearish trend. In April, after the pair tested an all-time low, the price corrected up sharply, reaching the 1.0900 resistance area. This resistance is confirmed by a 78.6% Fibonacci retracement level which was rejected. At the same time, EUR/CHF rejected the simple and the average-price downtrend trendline. It goes to show that the long-term downtrend remains valid and there could be more room for the price decline.
Nonetheless, the nearest resistance is located near the 1.0630 area, which is 23.6% Fibs. This level also corresponds to the previous support zone printed back in 2017. At this point, there is a high probability that the downtrend will continue and another 100 pip drop in price can be expected.
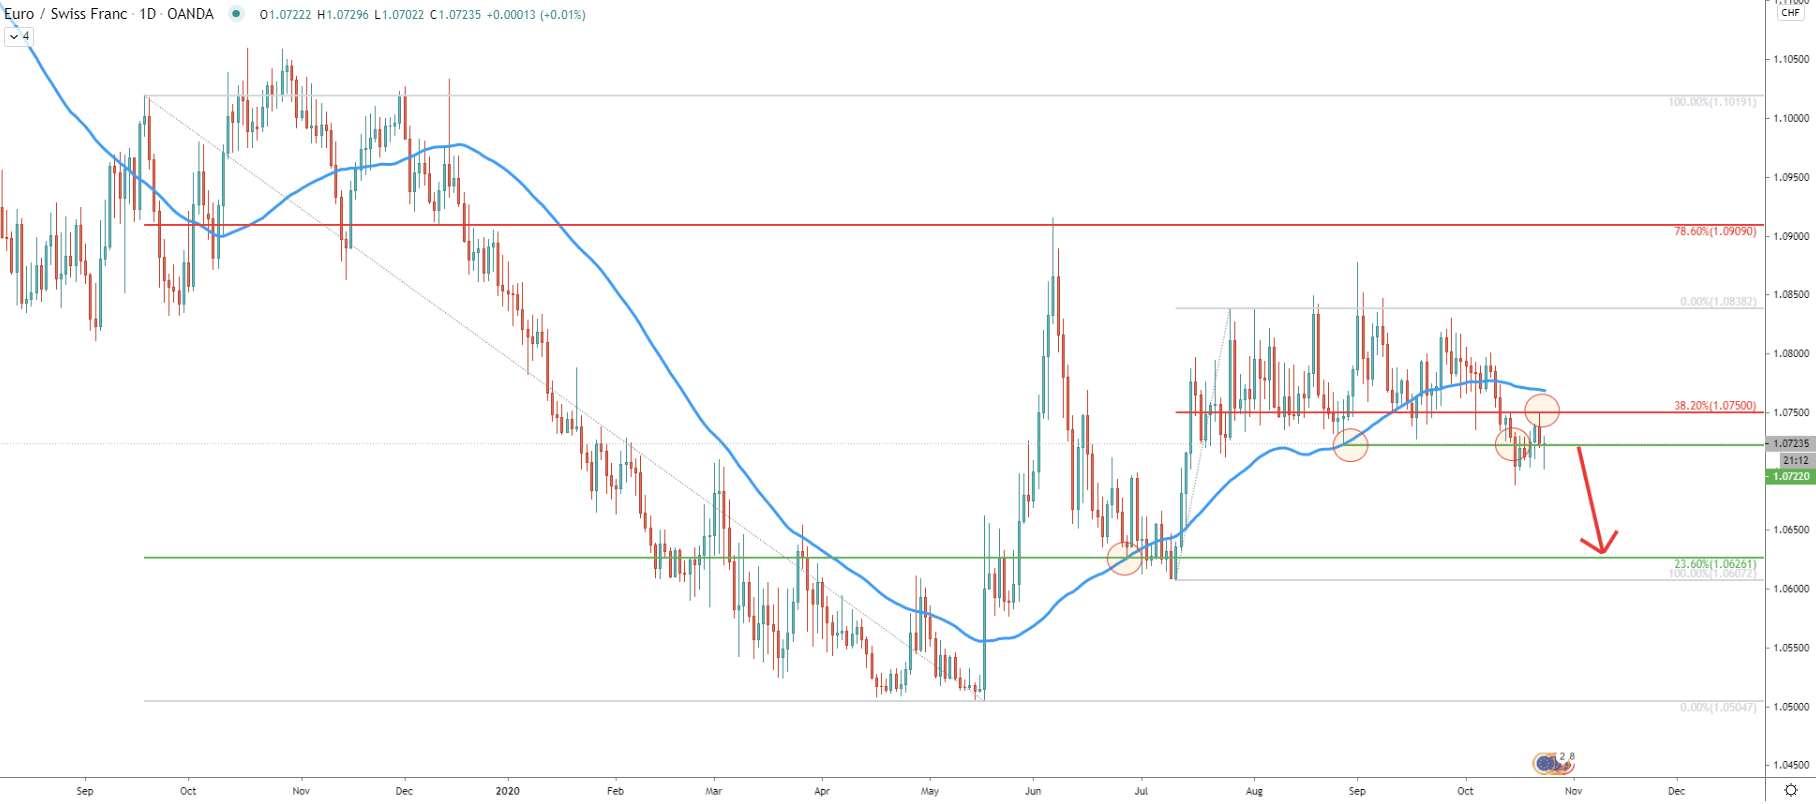
After EUR/CHF rejected the 1.0900 resistance area, the consolidation phase has begun. Price has been stuck between 1.0620 support and 1.0900 resistance for the past 5 months. The range trading is ongoing and considering a clean rejection of the 38.2% Fibs at 1.0750, which occurred yesterday, the probability of the downside move remains extremely high. Besides, the previous point of the rejection of the 50 Exponential Moving average at 1.0723 has been broken.
To summarise, the support has been broken and the resistance has been rejected. It could be a clear indication that bears are in full control and next week’s price could be starting to decline. We can also see that the 1.0626 support corresponding to the point where previously 50 EMA was rejected, making it an attractive take profit level for sellers.
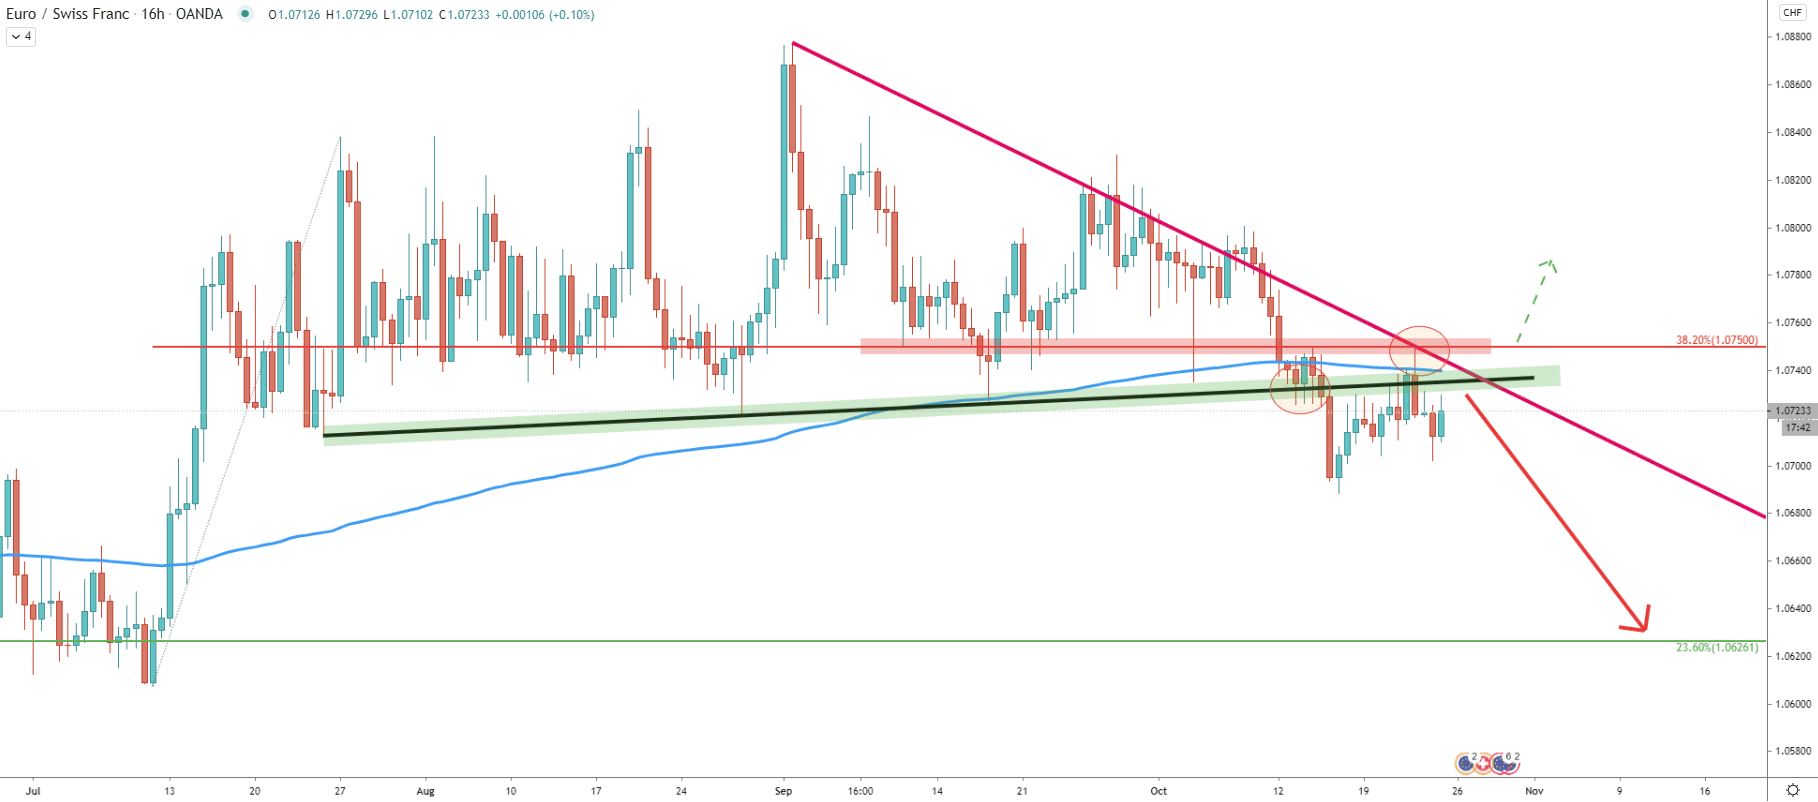
The support uptrend trendline has been penetrating under strong selling pressure. Then price corrected up and cleanly rejected 1.0750 resistance for the second time in a row. At the same time, the downtrend trendline along with the 200 Exponential Moving Averages was rejected. This yet again indicates the seller’s dominance and should result in a downtrend continuation. However, for this scenario to play out, the 1.0750 resistance should remain respected, without any sort of the break and close above it.
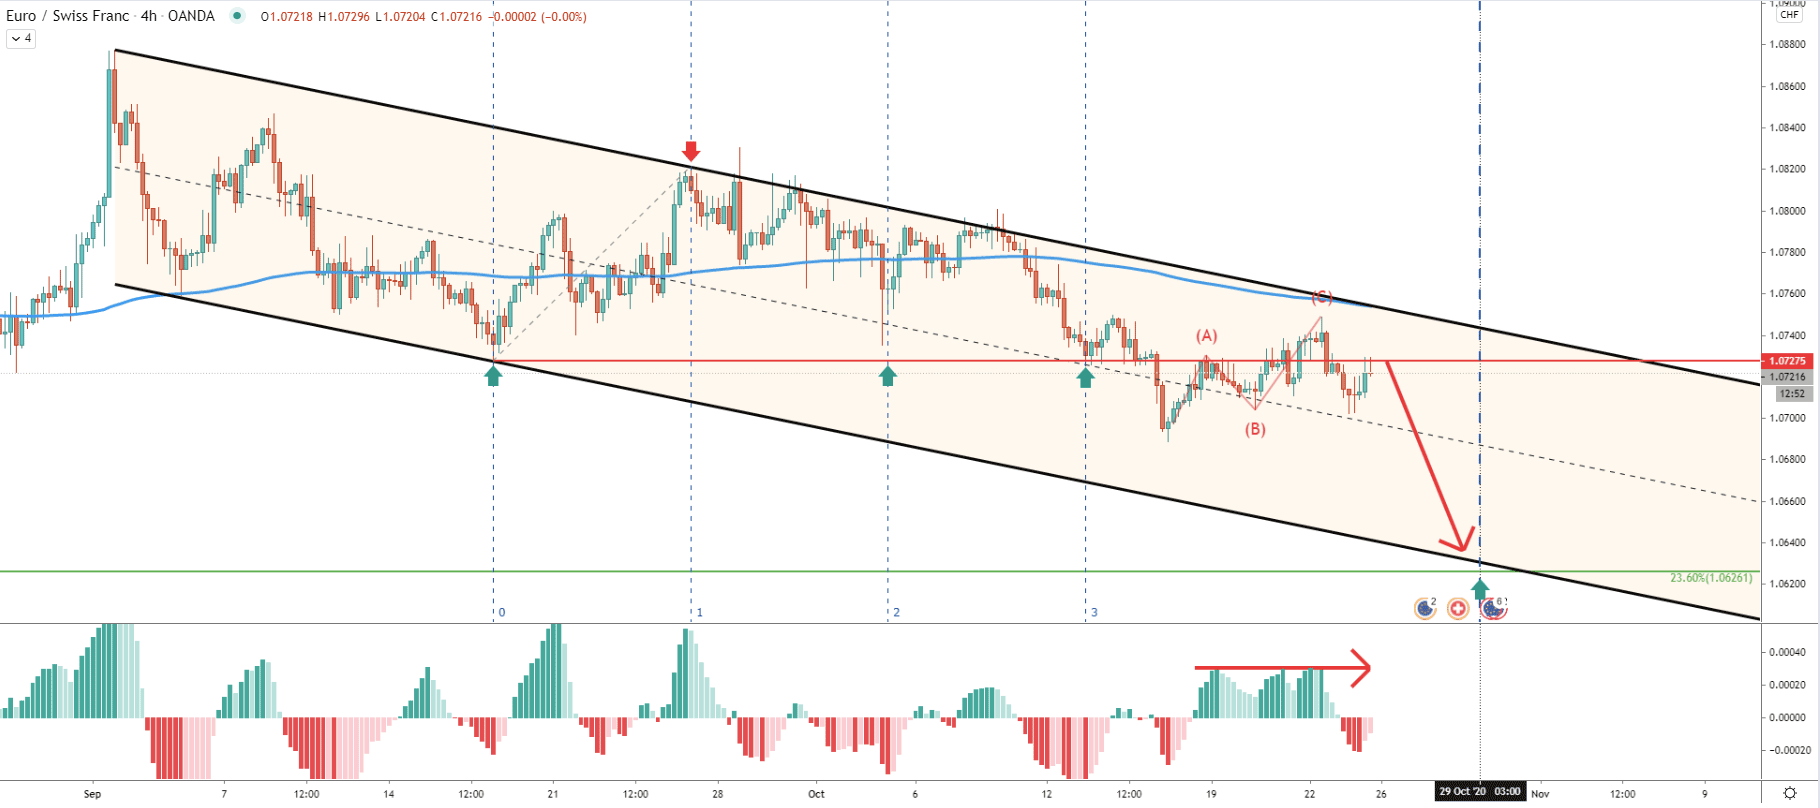
Probably the most interesting char is on the 4-hour timeframe. Here, the price continues to trade within the descending channel where a break below 1.0727 can be witnessed. This was the previous support level which currently is acting as the resistance. At the same time, using the Elliot Wave theory, EUR/CHF could have completed an ABC upside correction after breaking below the key support. While ABC correction was forming, the MACD oscillator produced a bearish divergence, indicating the luck of the buying power. Considering that the price is right at the resistance, selling pressure should be expected to be at its’ extreme early next week.
Looking at the Fibonacci cycles, it can be seen that cycle 3 should have been bullish, although the price failed to reject the 1.0727 support. The next cycle is on October 29, which could be the end of the expected upcoming downside move. This means that as long as the current resistance holds, EUR/CHF could drop by 100 pips in just 4 trading days.
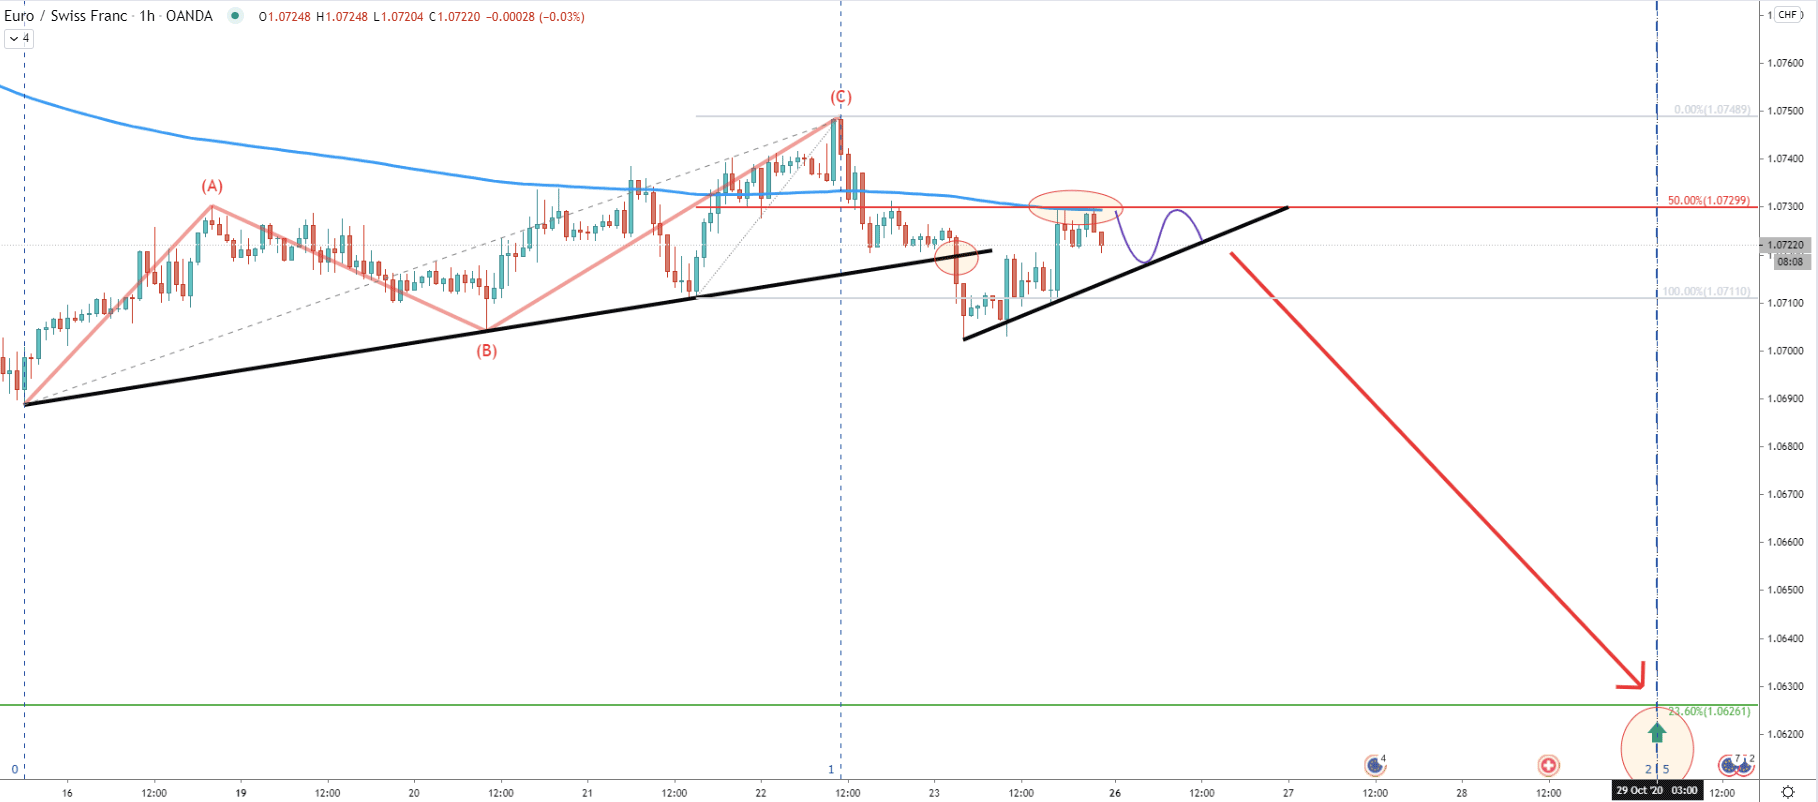
On the hourly chart, the uptrend trendline was broken after which the price corrected up. On the correction, the 50% Fibs at 1.0730 has been rejected cleanly along with the 200 EMA. There are probably too many bearish signals at the same time, which is not a very common thing. Right now EUR/CHF could initiate a short-term range-trading while trading between the 1.0730 resistance and the uptrend trendline. Although break and close below the trendline is likely to trigger a massive selloff, where fast price decline can take place. And based on yet another Fibonacci cycles, it can be seen clearly that October 09 is a very important date, which could be either the end of the downtrend or the beginning of the downtrend as long as the current resistance holds.
EUR/CHF correctional phase could have just finished and the long-term downtrend continuation is expected. There is a 100 pip downside potential which might take only 4 trading days for the pair.
As per the weekly chart, the nearest support is located at 1.0626, which is confirmed by the 23.6% Fibonacci retracement level. And based on two Fibonacci cycles, this target could be tested as soon as October 29.
As per the 16-hour chart, daily break and close above 1.0750 resistance will immediately invalidate the bearish scenario. In this case, a fast upside move could be produced by EUR/CHF.
Support: 1.0700, 1.0630
Resistance: 1.0730, 1.0750, 1.0900


