
Published: August 28th, 2020
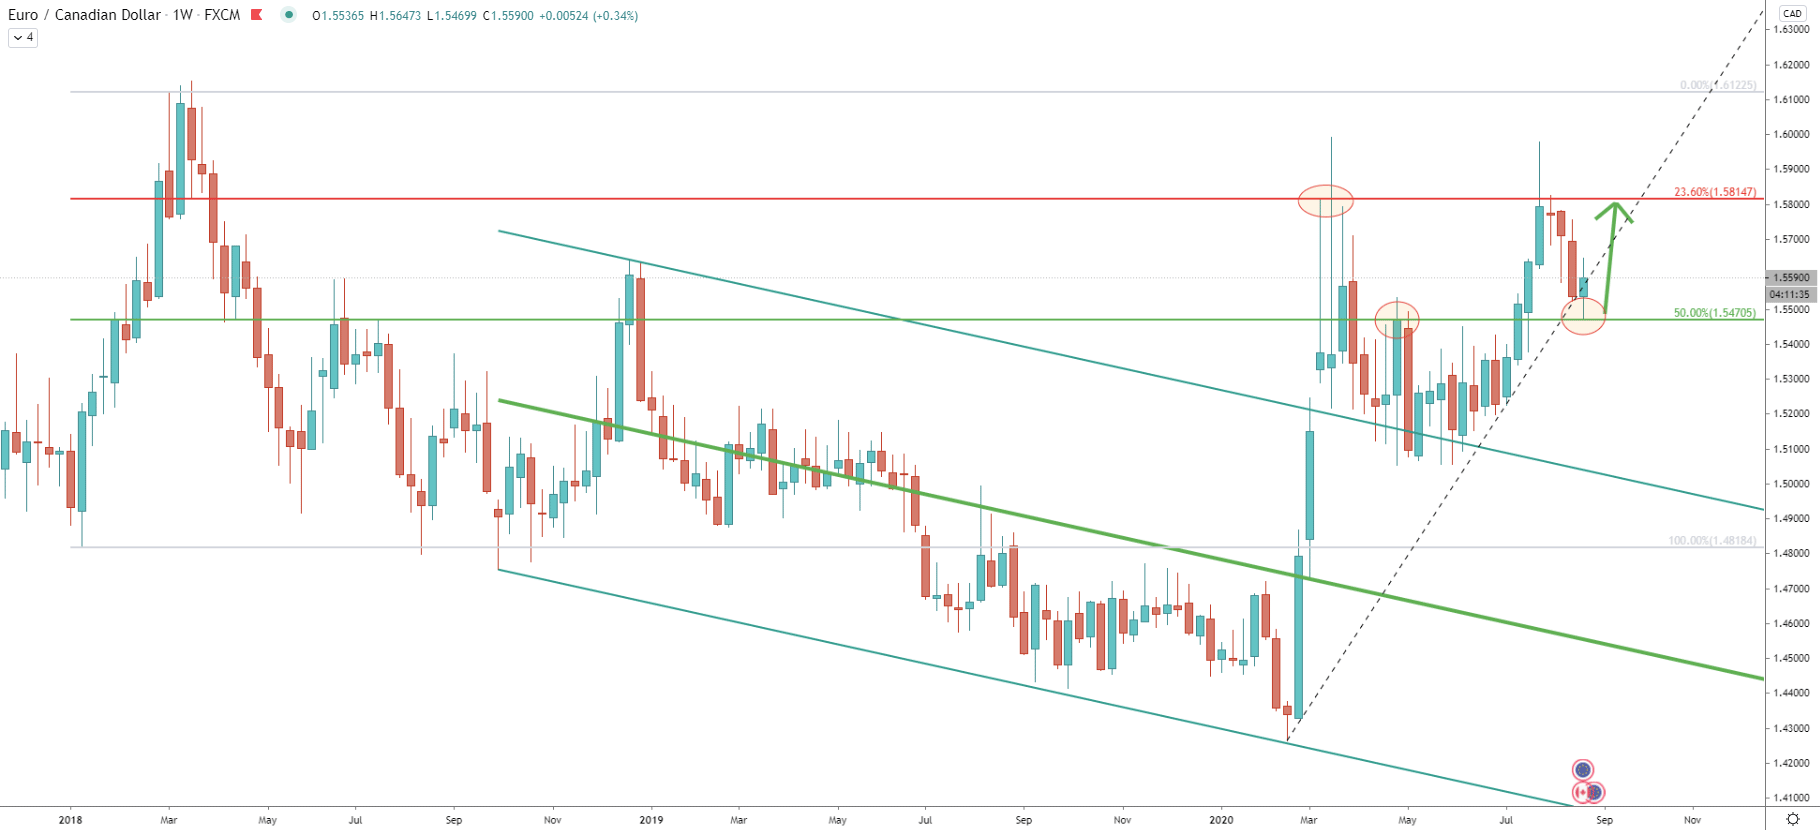
To start with, the Fibonacci retracement indicator has been applied to the last wave up, where EUR/CAD topped out at 1.6122 area. While this Fibs seems to be outdated, it actually shows important support and resistance levels in the long term. The 23.6% Fibs at 1.5814 has been acting as the resistance twice already, where the price produced a double top. But there was a clear rejection of the 50% Fibs at 1.5470, which does suggest the validity of a long term uptrend.
Previously, 50% Fibs was the resistance level, but now it is the support that was rejected along with the uptrend trendline on the Weekly chart. Considering that the uptrend might be valid, it could be reasonable to assume that the price will be re-testing 1.5814 resistance once again.
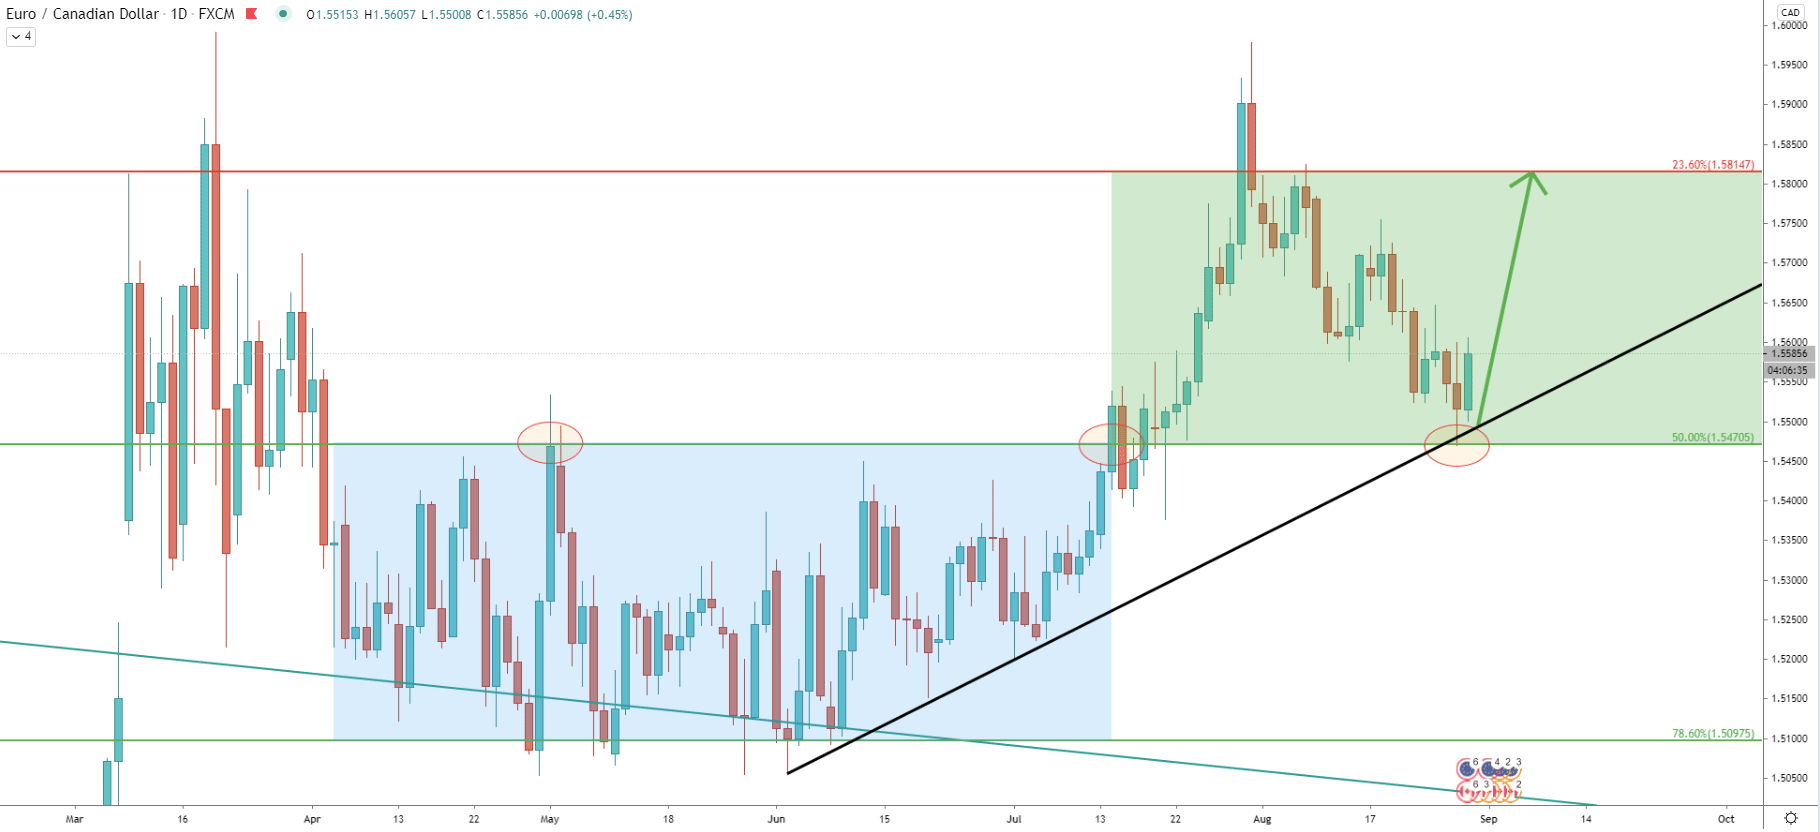
Here we can see areas where the price has been running. The bottom area clearly was broken and now the price has entered the second consolidation zone which is in green. The uptrend trendline was also rejected on the daily chart, which occurred just yesterday. This might be the beginning of yet another upside wave but only if current support holds.

Along with the uptrend trendline and the 50% Fibonacci support, the 200 Exponential Moving Average was also rejected. Besides, EUR/CAD has reached and rejected the lower trendline of the descending channel. This makes 1.5470 an extremely strong demand level, and we can see that price already started to rise.
Fibonacci was applied to the corrective wave down, after the first range area (in blue on the daily chart) was broken. It shows that the 261.8% retracement level corresponds precisely to the previously mentioned resistance at 1.5814.
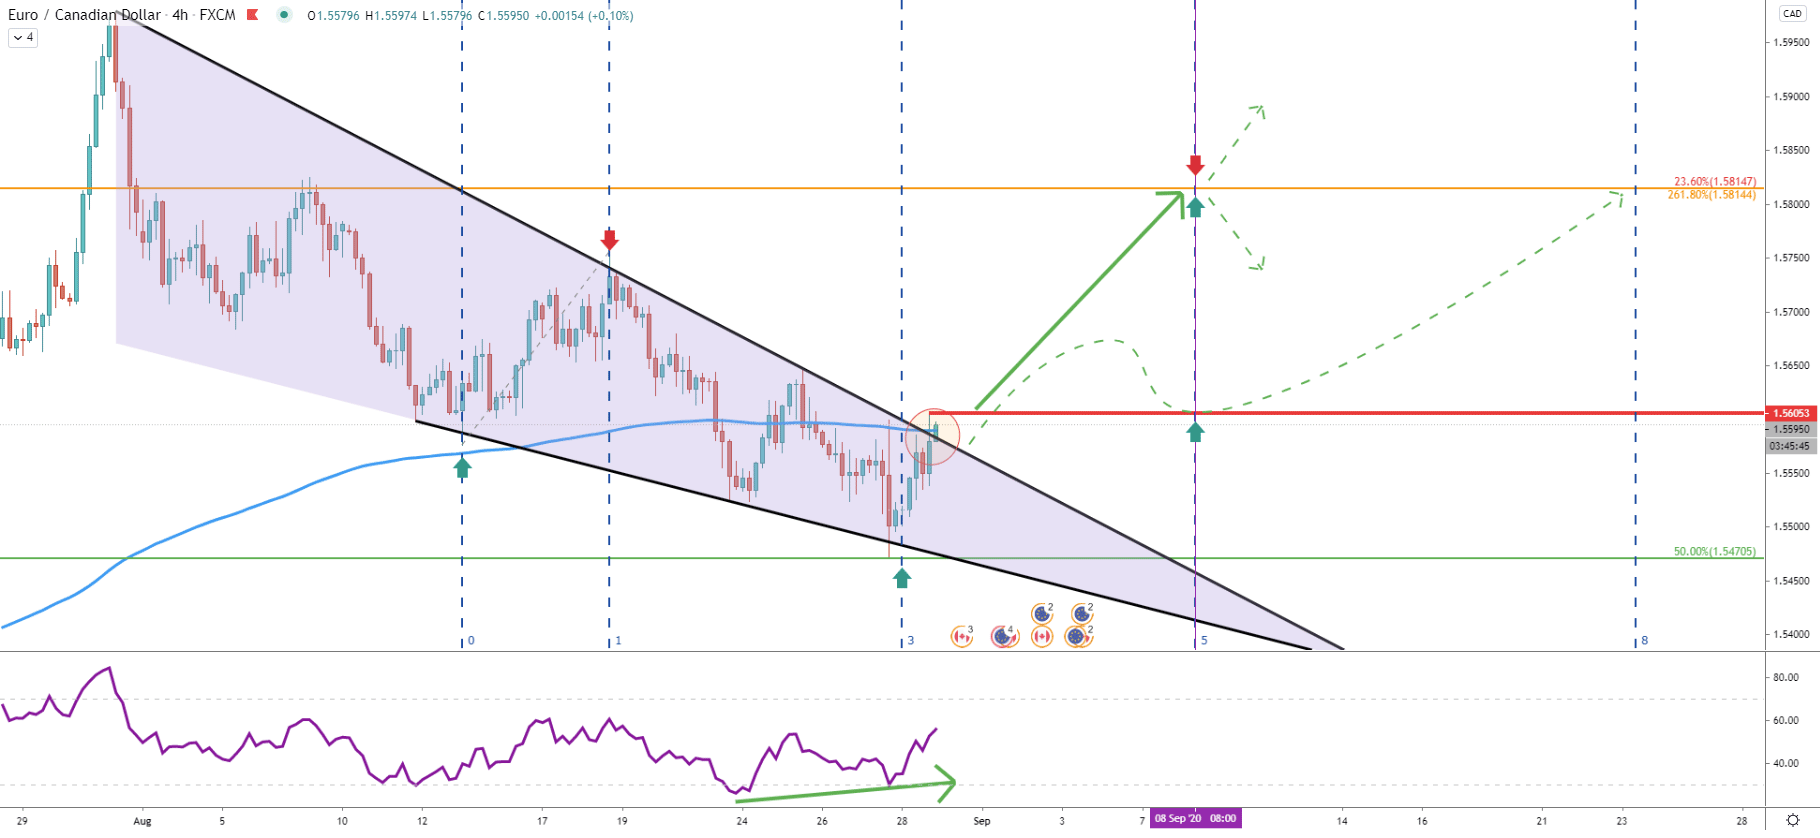
Since August EUR/CAD has been forming a triangle pattern resulting in a steady price decline. But the bottom has been tested at 1.5470 where RSI formed a bullish divergence suggesting trend reversal. Today pair has approached the top of the triangle and the 200 EMA. It seems like 1.5605 will be a very important resistance to overcome. Because as long as the price remains below, EUR/CAD uptrend is not completely confirmed.
Therefore, buyers could be waiting for the clean break above the triangle as well as the EMA before taking any actions. This might occur today or early next week, although failure to go higher could result in the continuation of the downtrend.
On the other hand, Fibonacci cycles show, that yesterday a new cycle started, and considering all the price action, it is expected to be a bull cycle. Nonetheless, prior to the uptrend, consolidation might still continue.
But when/if there will be a breakout, there are several scenarios outlined on this chart. Price could be heading towards the upside target without any major correctional moves. It also could break above but then consolidate until the September 8, when the new Fibonacci cycle begins.
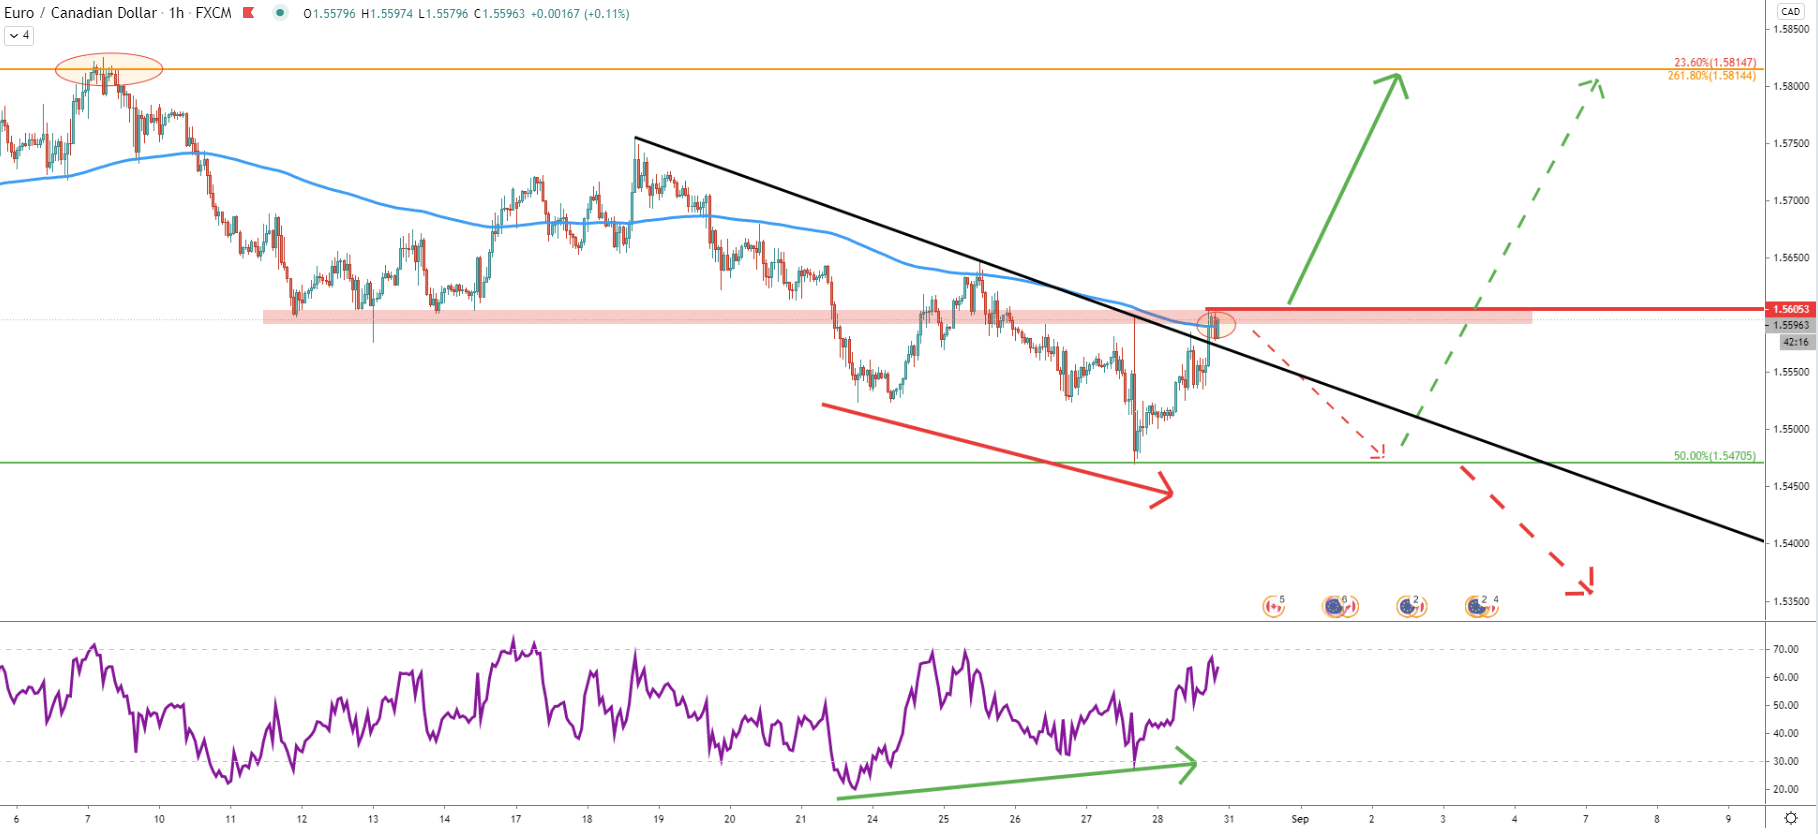
On the hourly chart, RSI also formed a bullish divergence, and then price broke above the downtrend trendline. But, the 200 EMA resistance is still being respected, which prevents EUR/CAD from further growth. This resistance previously was the support, and this fact makes it an important level to watch. There are several possible outcomes at this stage. Either price will break above resulting at the beginning of an uptrend. Or, the price will reject this resistance and start moving lower. The question will be whether the 1.5470 support will hold or not.
EUR/CAD is showing signs of a potential trend reversal which is expected to start early next week. For such a forecast price must break and close above the 1.5605 resistance, which should invite more buyers.
As per the weekly and 8-hour charts, the key resistance is located at 1.5814, which is over 200 pips away from the current price.
As long as the price remains below 1.5606, the probability of the downtrend remains high. However, only daily break and close below the 1.5470 support will completely invalidate bullish outlook and at that stage, EUR/CAD downtrend is likely to continue.
Support: 1.5544, 1.5470
Resistance: 1.5605, 1.5814


