
Published: August 4th, 2020
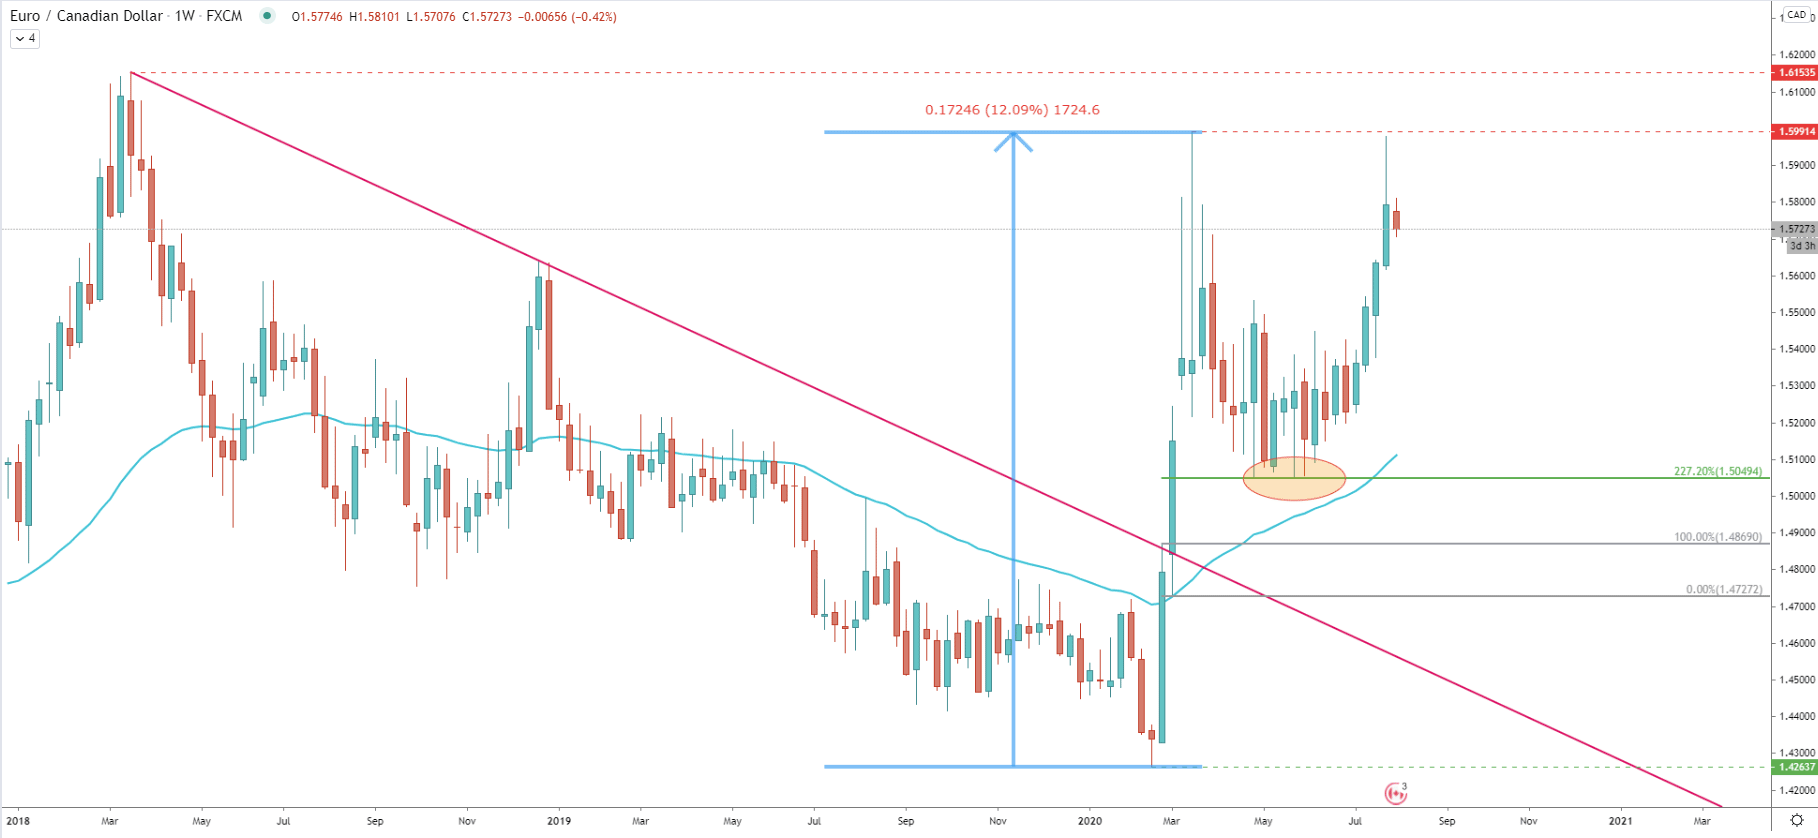
Back on February 19, EUR/CAD tested the bottom at 1.4263. Then the price flew up to the 1.5991, and that rally resulted in the 12.09% price increase in just one month. This was a 1724 pip move, which has been conducted under extreme buying pressure. However, the price has corrected down, where EUR/CAD has lost nearly half of the profit made. The correction ended at 1.5049, which is 227.2% Fibonacci retracement level applied to the corrective wave down where 50 Exponential Moving Average was rejected cleanly on March 2.
Near 1.5049 support, pair has been consolidating for 10 weeks while forming a double bottom. Nonetheless, during the past 4 weeks, the price has been on a steady rise once again. From the 1.5049 support, it went up by 924 pips, and on July 31 tested the high at 1.5979. Overall, the trend remains heavily bullish and while it seems that the double top near 1.6000 is forming, there is still no definitive confirmation that there will be a reversal to the downside. Therefore, the probability remains in favor of the uptrend continuation.
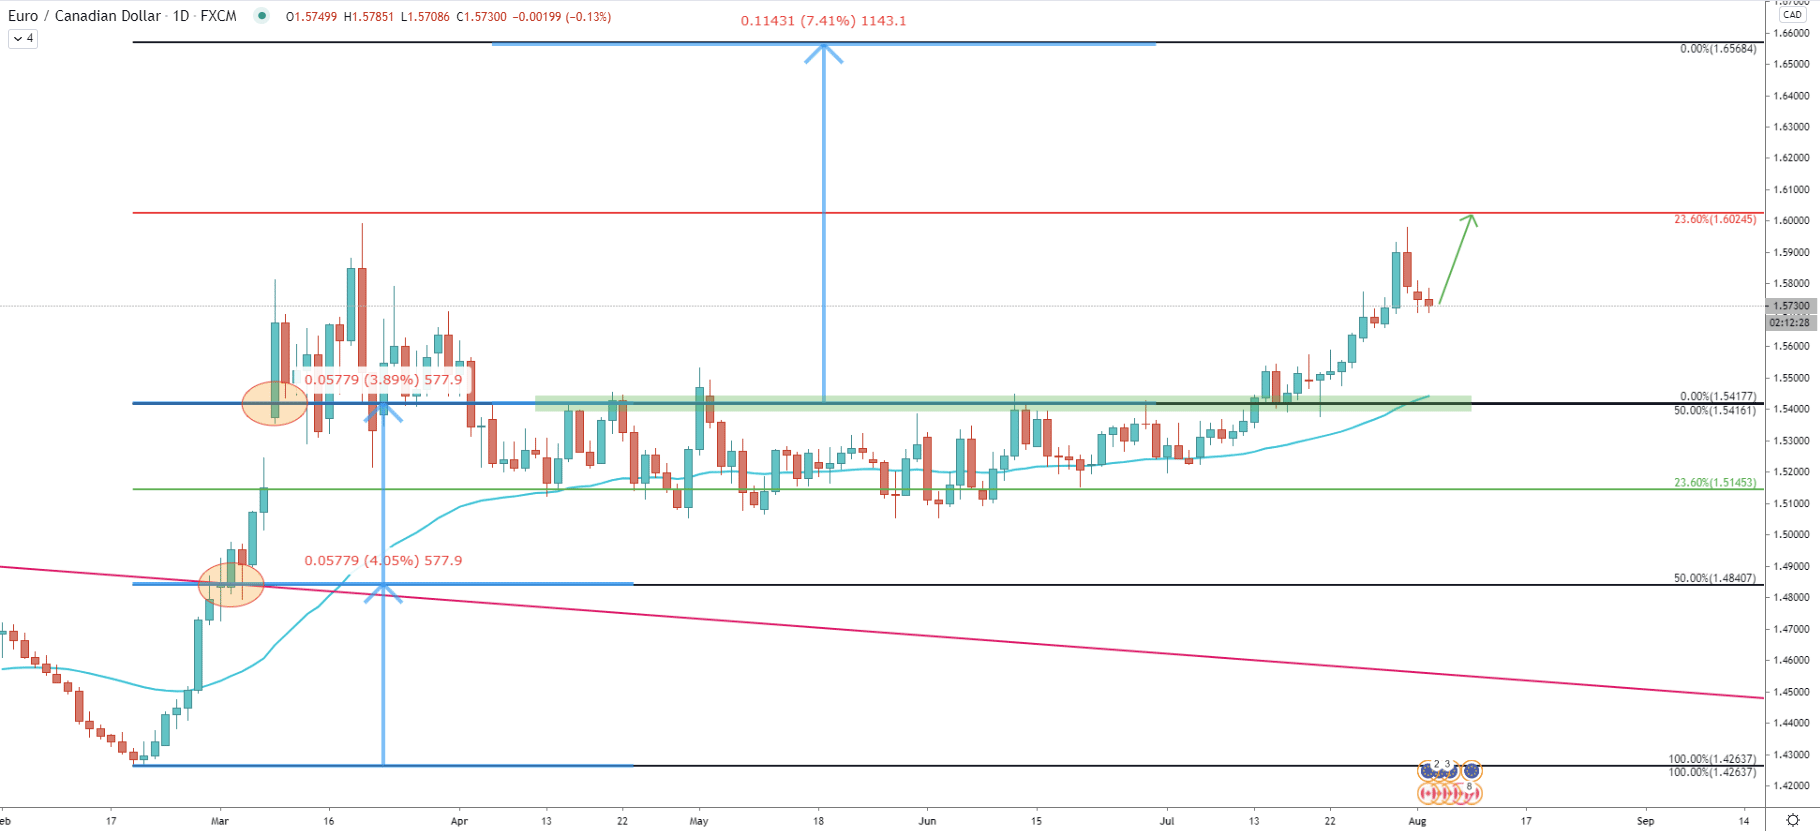
On the daily chart, we have applied the Fibonacci retracement indicator to the downtrend trendline breakout point. The upside target (0% Fibs) at 1.5416 has been broken, and the price continued to trend up. We have applied the extended Fibonacci indicator to see potential resistance levels. Fibs show, that the nearest resistance is seen at the 23.6% level, which is 1.6024.
During the consolidation phase, the First target at 0% Fibs has been acting as the supply/demand zone on multiple occasions. But eventually, 1.5417 proved to be the support, yet again confirming EUR/CAD bullish intentions, at least in the short term.
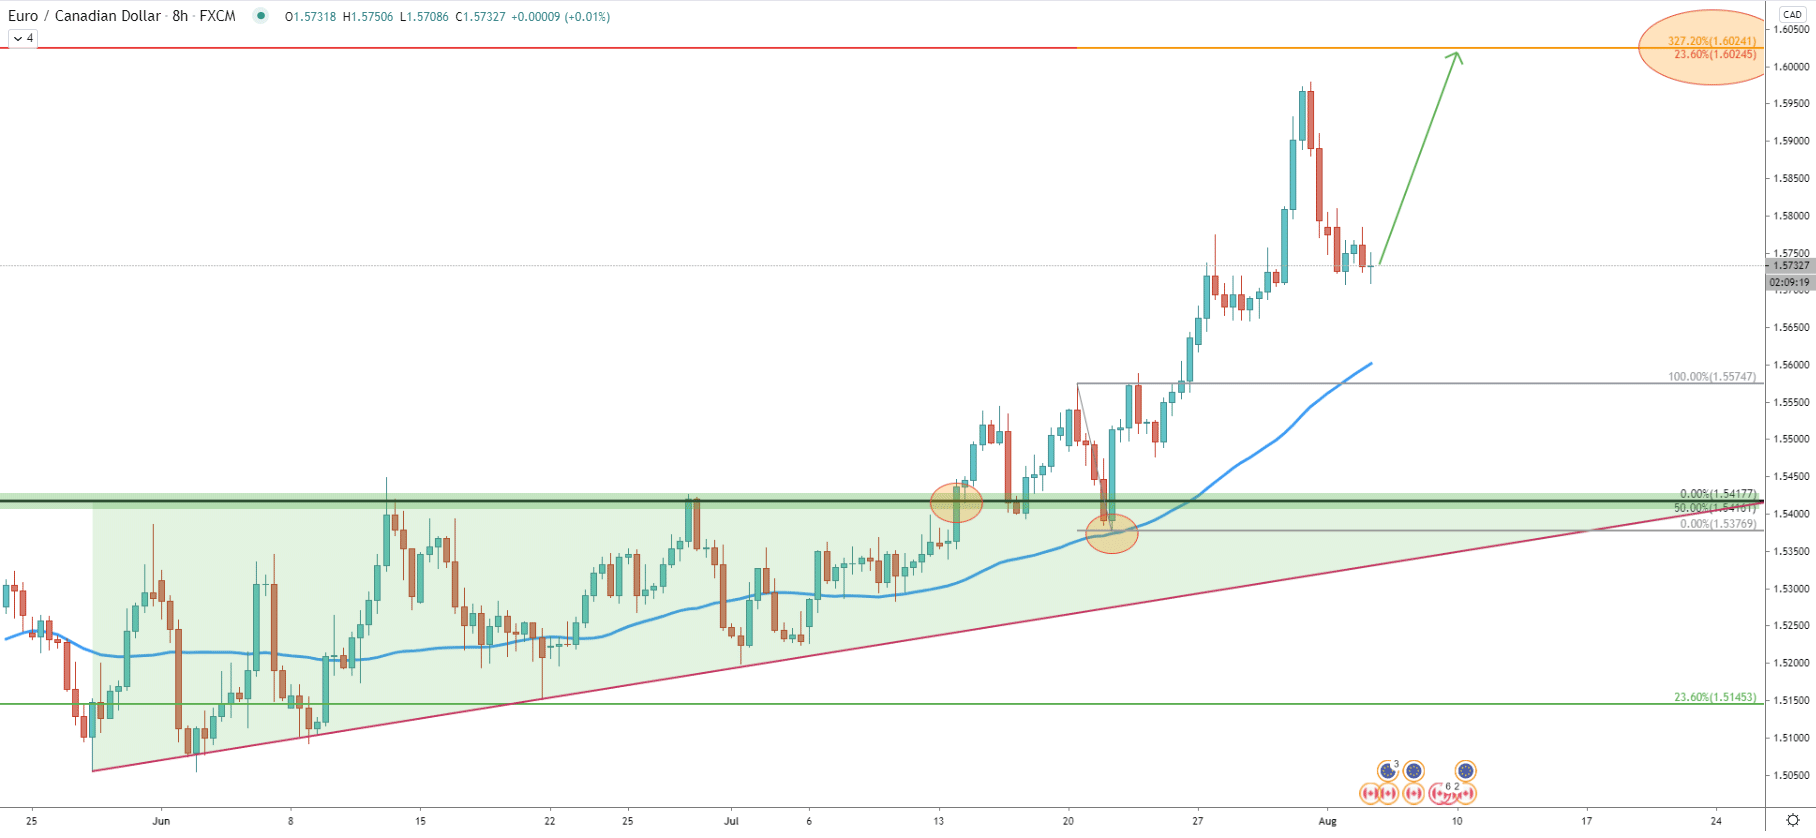
On this chart, EUR/CAD formed a triangle pattern, broke above, pulled back, and rejected the 50 Exponential Moving Average along with the triangle support area. We have applied the Fibonacci retracement indicator to that pullback, which shows that 327.2% cleanly corresponds to the 1.6024 resistance as per the Daily chart.
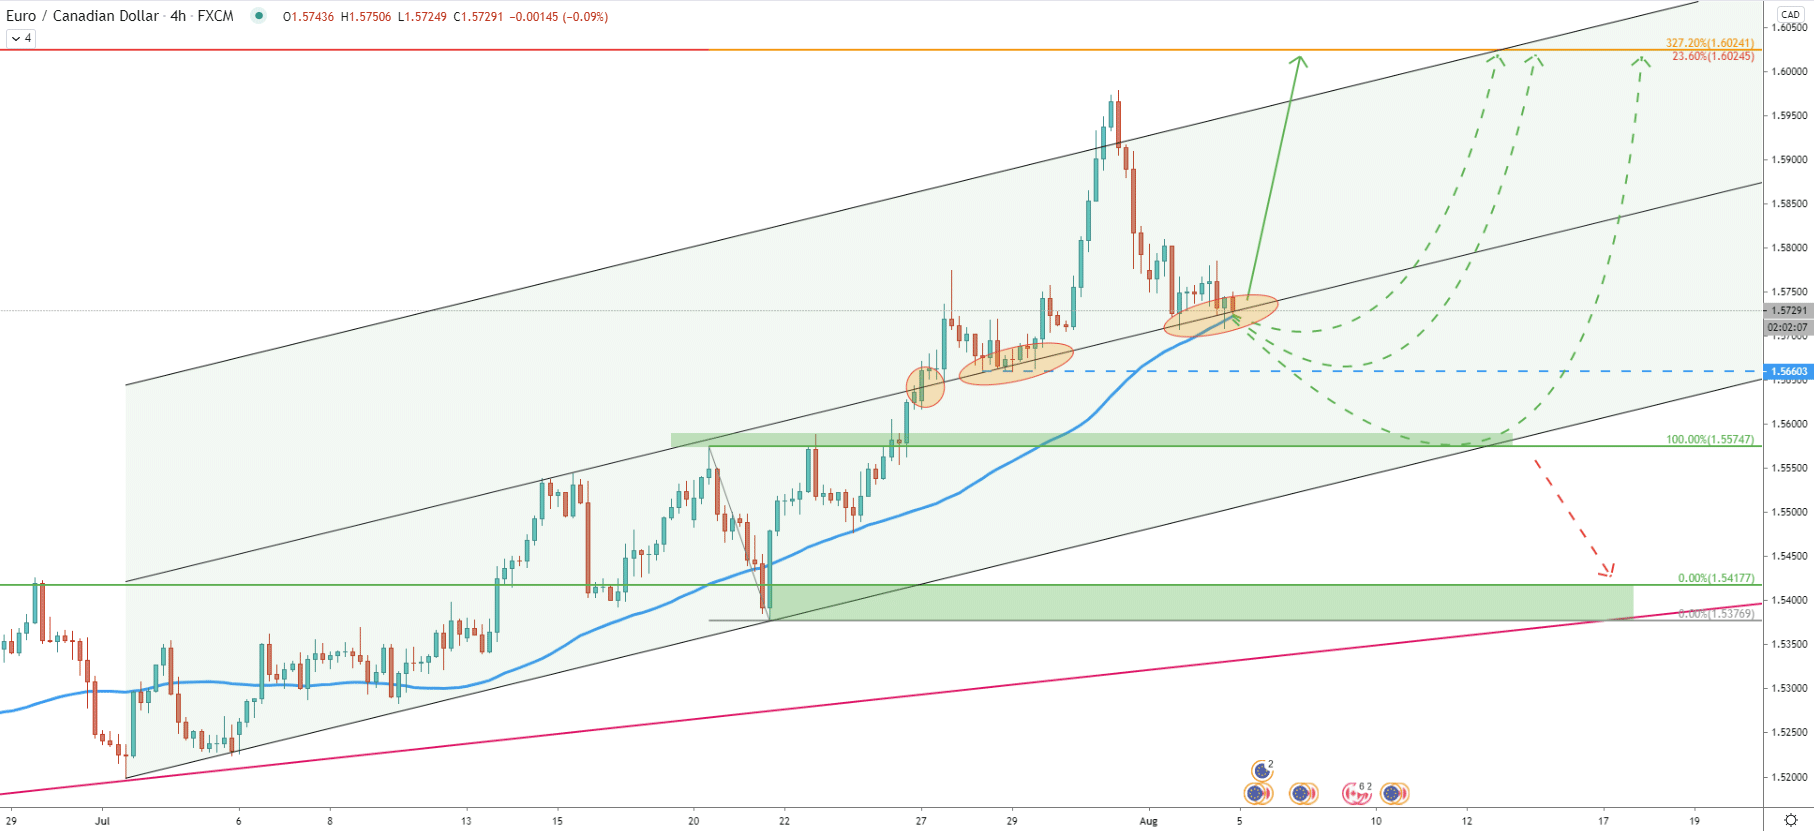
On the 4-hour chart, there are multiple price scenarios that can be expected. While the trend remains up, obviously all the scenarios are in favour of the uptrend continuation. Today price has reached and rejected the middle trendline of the extended ascending channel. Along with it, EUR/CAD had bounced off the 200 Exponential Moving Average yet again showing, that currently price is in the support area.
There could be some battle between bulls and bears while EUR/CAD is trading near 1.5700 psychological level. For the short period of time bears could be taking over, extending the downside correction. In this case, pair can correct down either towards the 1.5660 or even 1.5575 support levels before uptrend will resume.
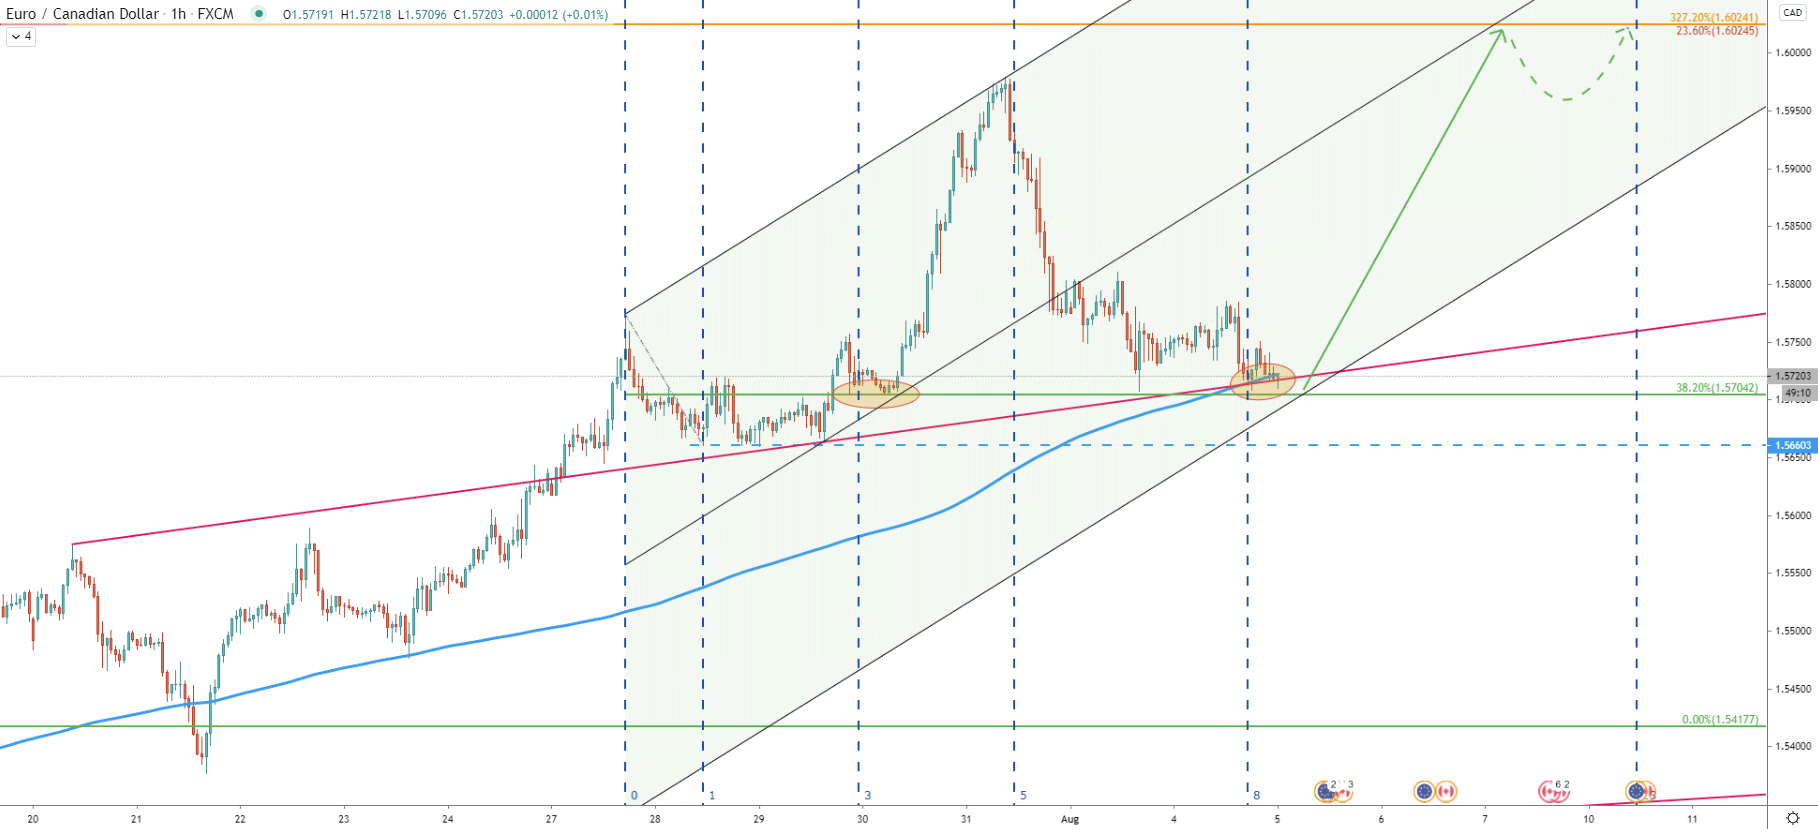
On the hourly chart, we have used an extended descending channel where price has almost reached the bottom. This goes to show, that for the short period of time, consolidation could take place. However, considering that price has bounced off the 200 EMA as well as the average-price uptrend trendline, EUR/CAD could be starting to move up at any time.
Besides, Fibonacci cycles show, that cycle 8 has already started, which is suggesting that the next wave could have just begun.
The EUR/CAD trend remains very bullish and the price is expected to continue trending up. Multiple support indicators are being rejected and new Fib cycle has just started. This goes to show, that as long as 1.5700 psychological support is holding, EUR/CAD should be starting to rise in the next 24 hours.
As per the weekly, 8-hour and 1-hour chart, based on two Fibonacci resistance levels as well as the top fo the ascending channel, the key resistance is seen at 1.6024.
Price has made a very strong upside move during the recent weeks. As per the weekly chart, the potential double top has been formed, which might result in the trend reversal in the coming days. But there must be a daily and maybe even weekly close below 1.5700 support to confirm the trend reversal.
Support: 1.5707, 1.5660, 1.5575, 1.5417
Resistance: 1.6024, 1.6568