
Published: December 14th, 2020
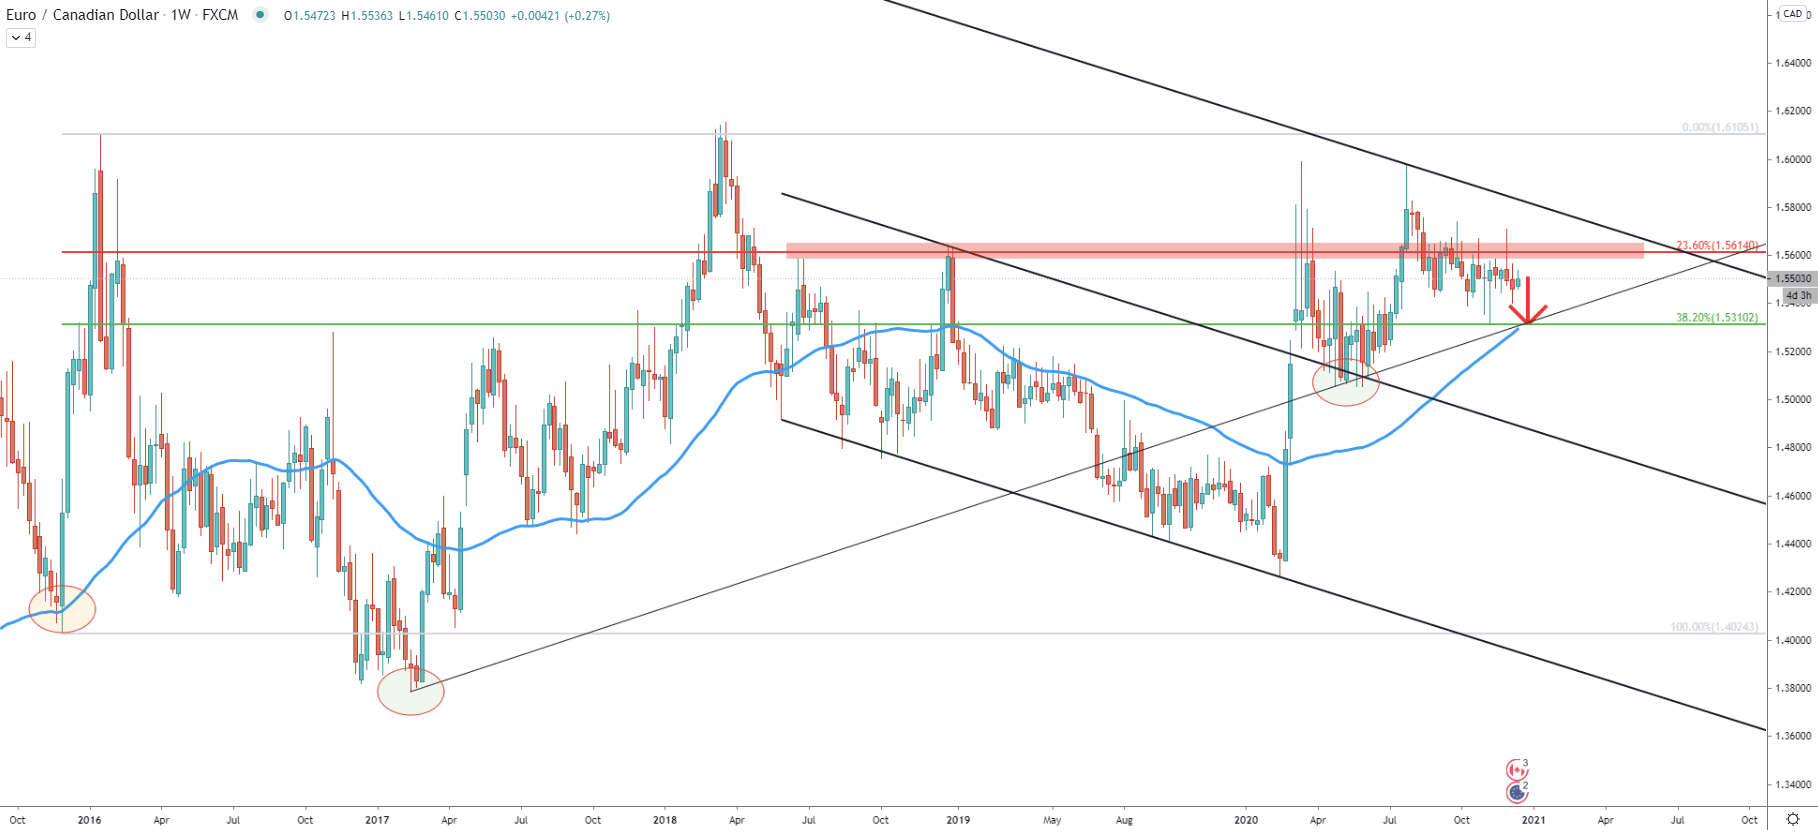
Starting off with the weekly chart, it can be seen that back in April, EUR/CAD broke above the descending channel and has reached/rejected the extended upper trendline. This has occurred at the end of July when EUR/CAD produced a double top near 1.5980. At the same time, it is clearly visible that EUR/CAD has formed a strong resistance near 1.5614, which is also confirmed by the 23.6% Fibonacci retracement level as can be seen on the chart. Up until now, this resistance is being respected, suggesting an ongoing selling pressure.
On another side, there is the support at 1.5310, which is confirmed by 38.2% Fibonacci retracement level, and previously was rejected cleanly. It is possible that EUR/CAD will move down, to re-test this support as well as the average-price uptrend trendline and 50 Exponential Moving Average. Perhaps this time, it will be extremely important to watch the price action around this support, if/when reached. Because it should certainly give further clues on the long-term price development for the EUR/CAD.
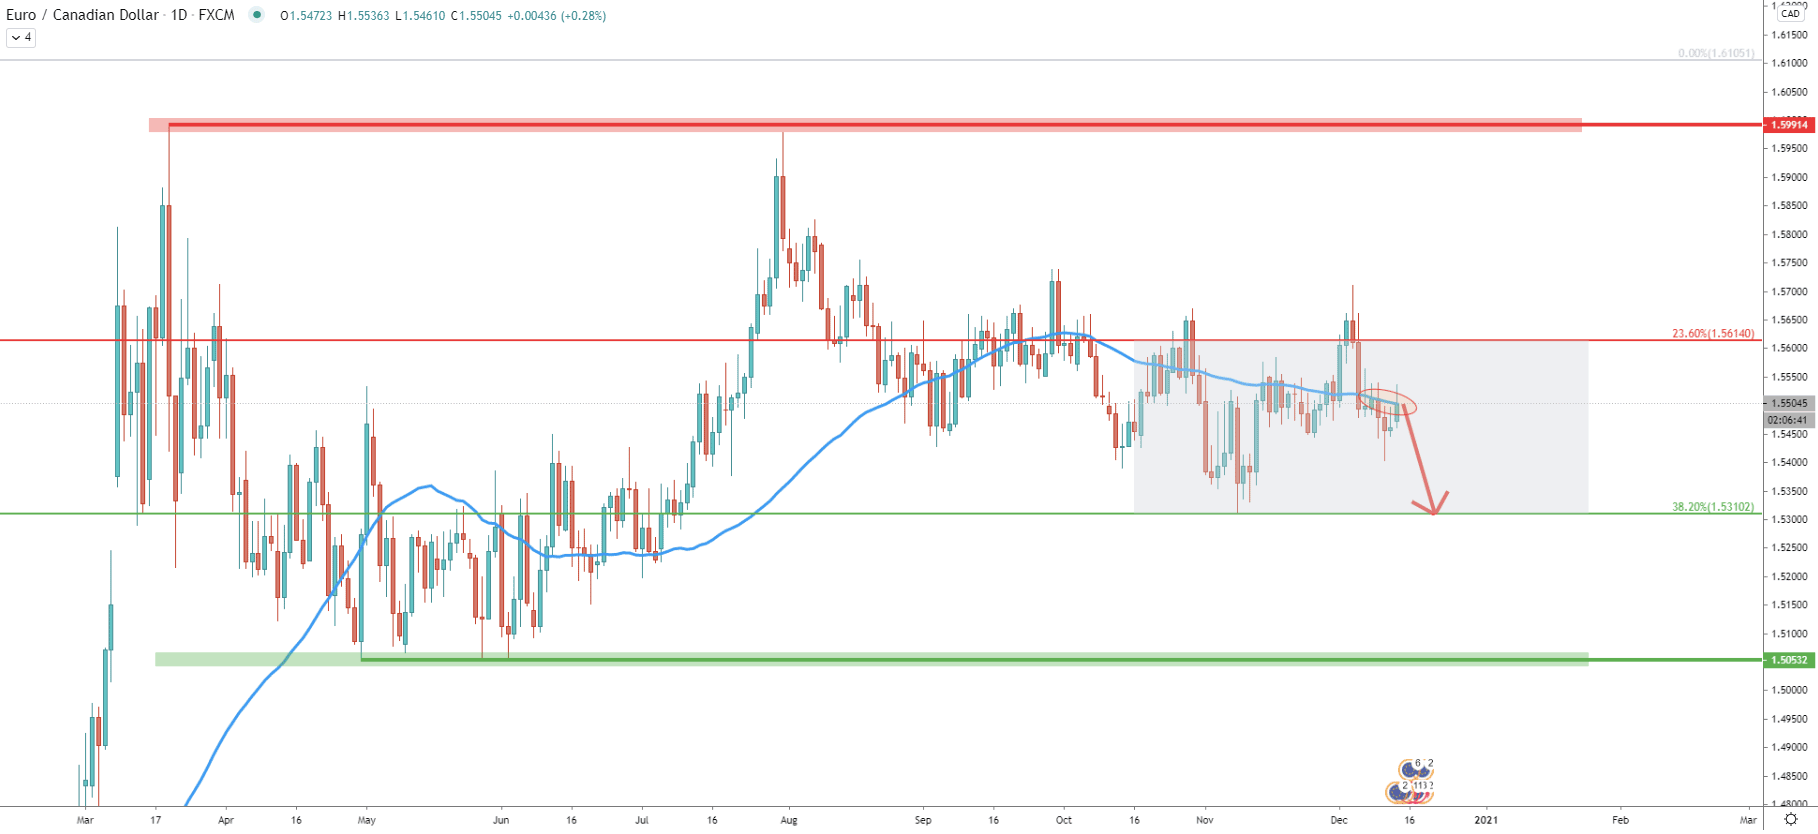
On the daily chart, there is major and minor consolidation areas that were formed during the past 8 months. The major resistance can be spotted near 1.6000, an extremely strong psychological level. The support has been formed near 1.5000, yet again a strong psychological level.
In regards to the minor support and resistance, they correspond to the Fibonacci levels as per the weekly chart. The support is near 1.5300 and the resistance is near 1.5600. Currently, the price is stuck between all these levels, and considering the fact that 50 EMA has been broken and currently acting as the resistance, the probability remains in favor of the downtrend. Obviously, the nearest target could be the bottom of the minor range, which is 200 pips away from the current price.
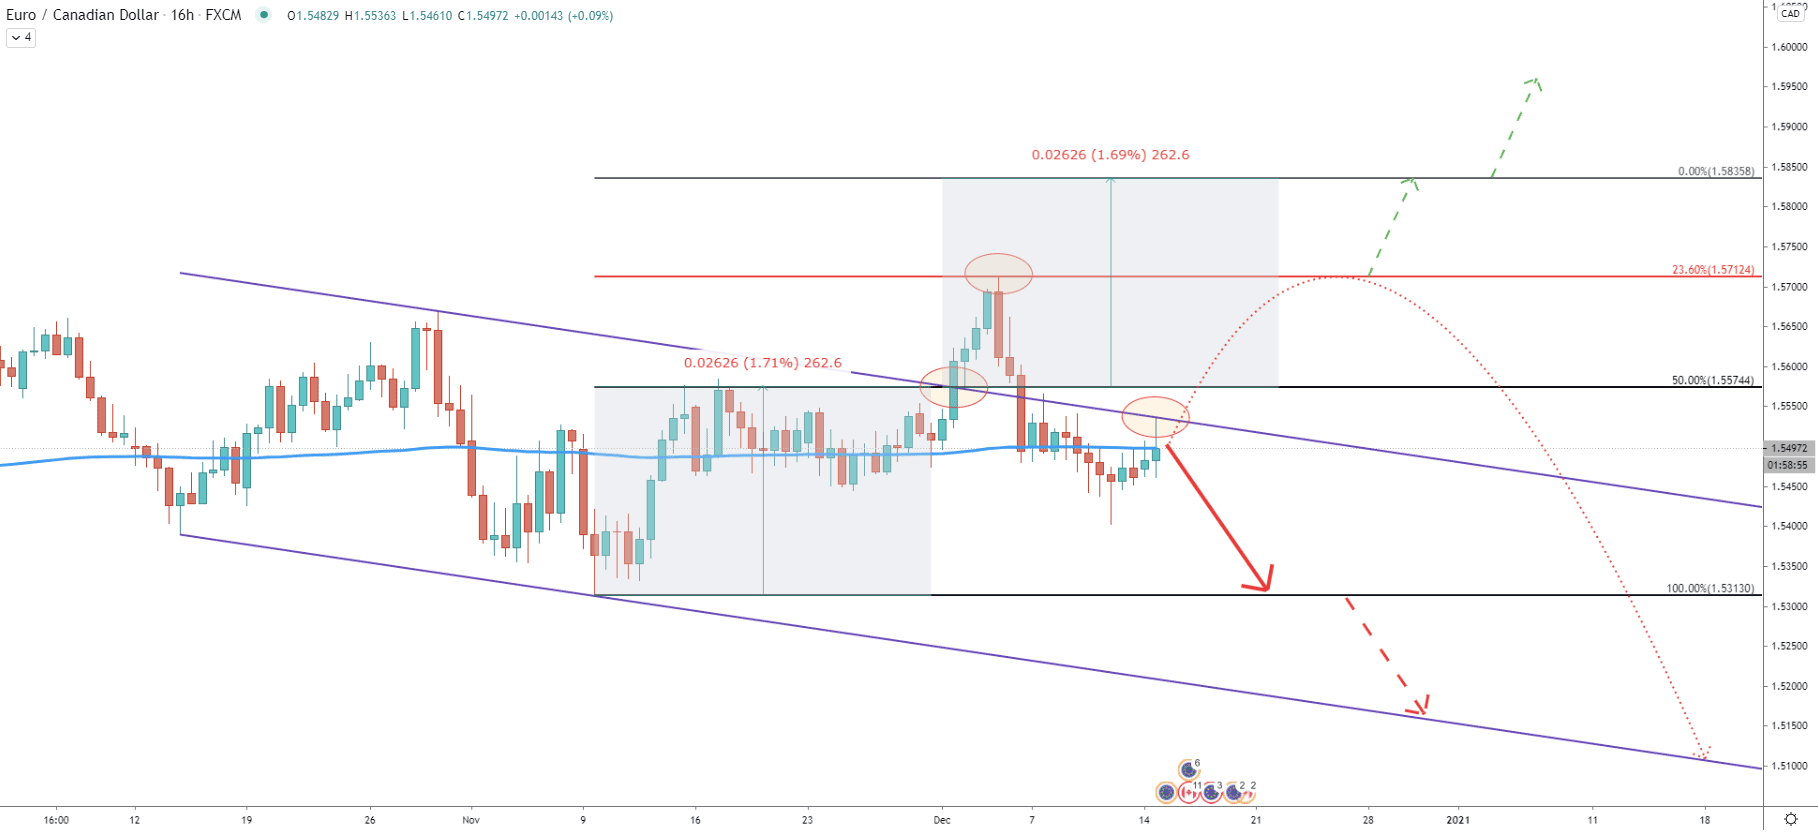
At the beginning of December, EUR/CAD broke above the descending channel. Fibonacci retracement indicator was applied to the breakout point, which shows taht 23.6% Fib resistance at 1.5712 got rejected cleanly. This implies that the top could have been formed and the price is now ready to continue trending down.
Currently, the price remains below the 200 EMA, which is actually being rejected along with the upper trendline of the descending channel. This might suggest that the downtrend is already valid, and it is only a matter of time for the new wave.
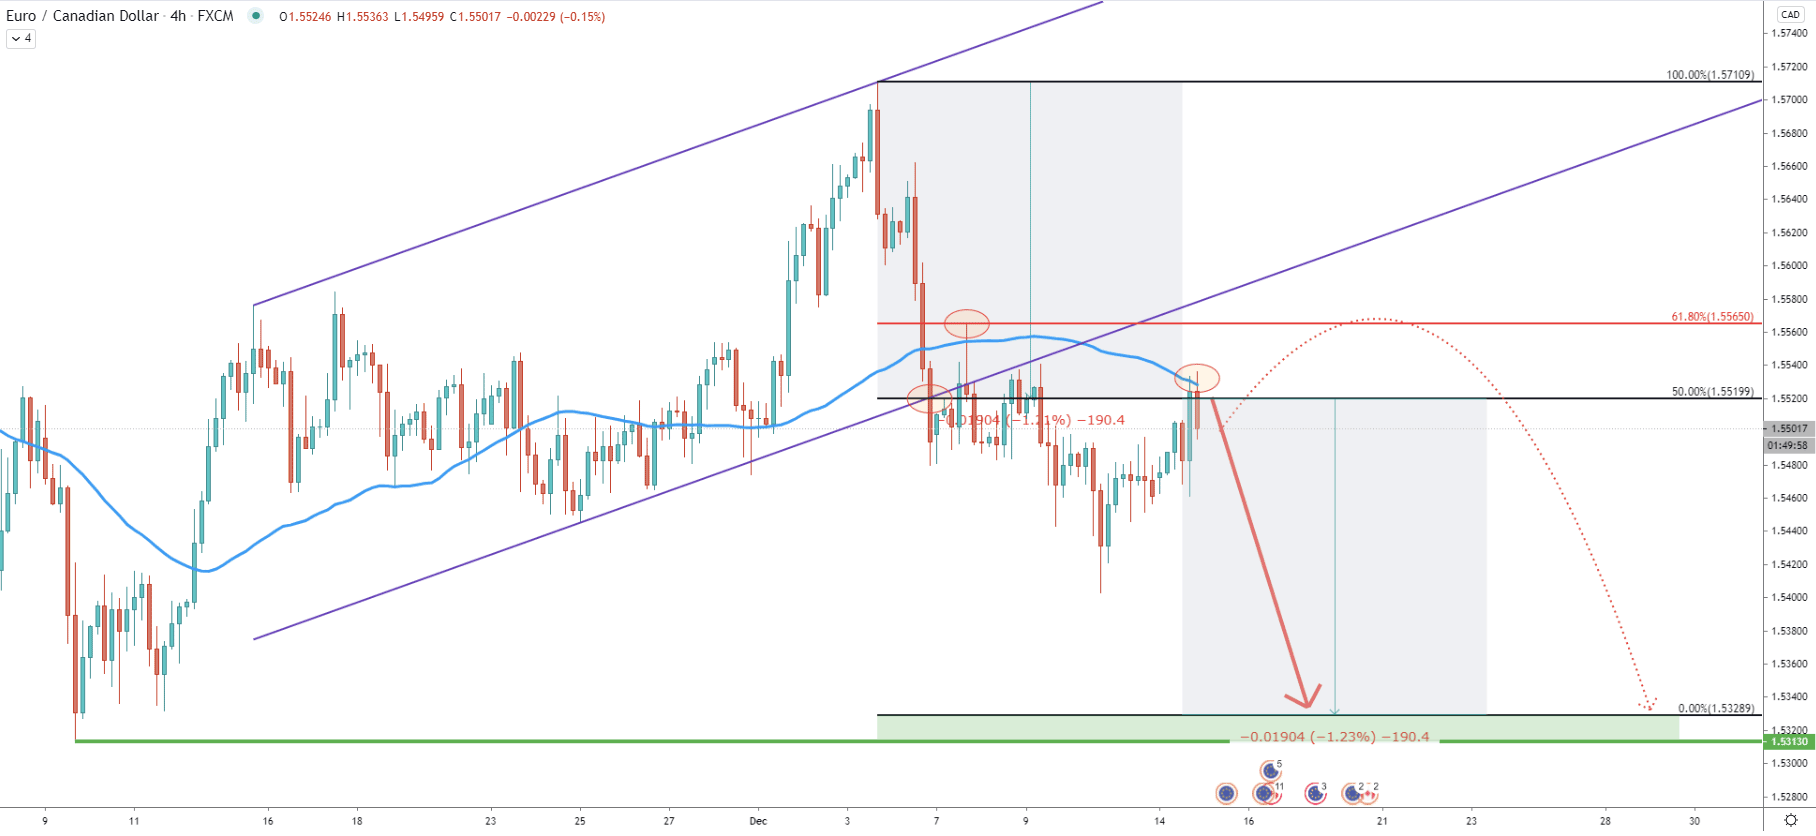
The ascending channel has been broken, validating the potential downtrend or at least a single wave down. Based on the Fibonacci, applied to the channel breakout point, the final target is located at 1.5329, which is very close to the previously established low t 1.5313. This makes an area between 1.5300 - 1.5330 a strong demand zone. Nonetheless, the price might still consolidate for the time being before/if EUR/CAD will start moving lower. It is possible that the 1.5565 resistance level will be re-tested once again. As can be seen on the chart, this resistance previously got rejected cleanly and it is based on the 61.8% Fibs.
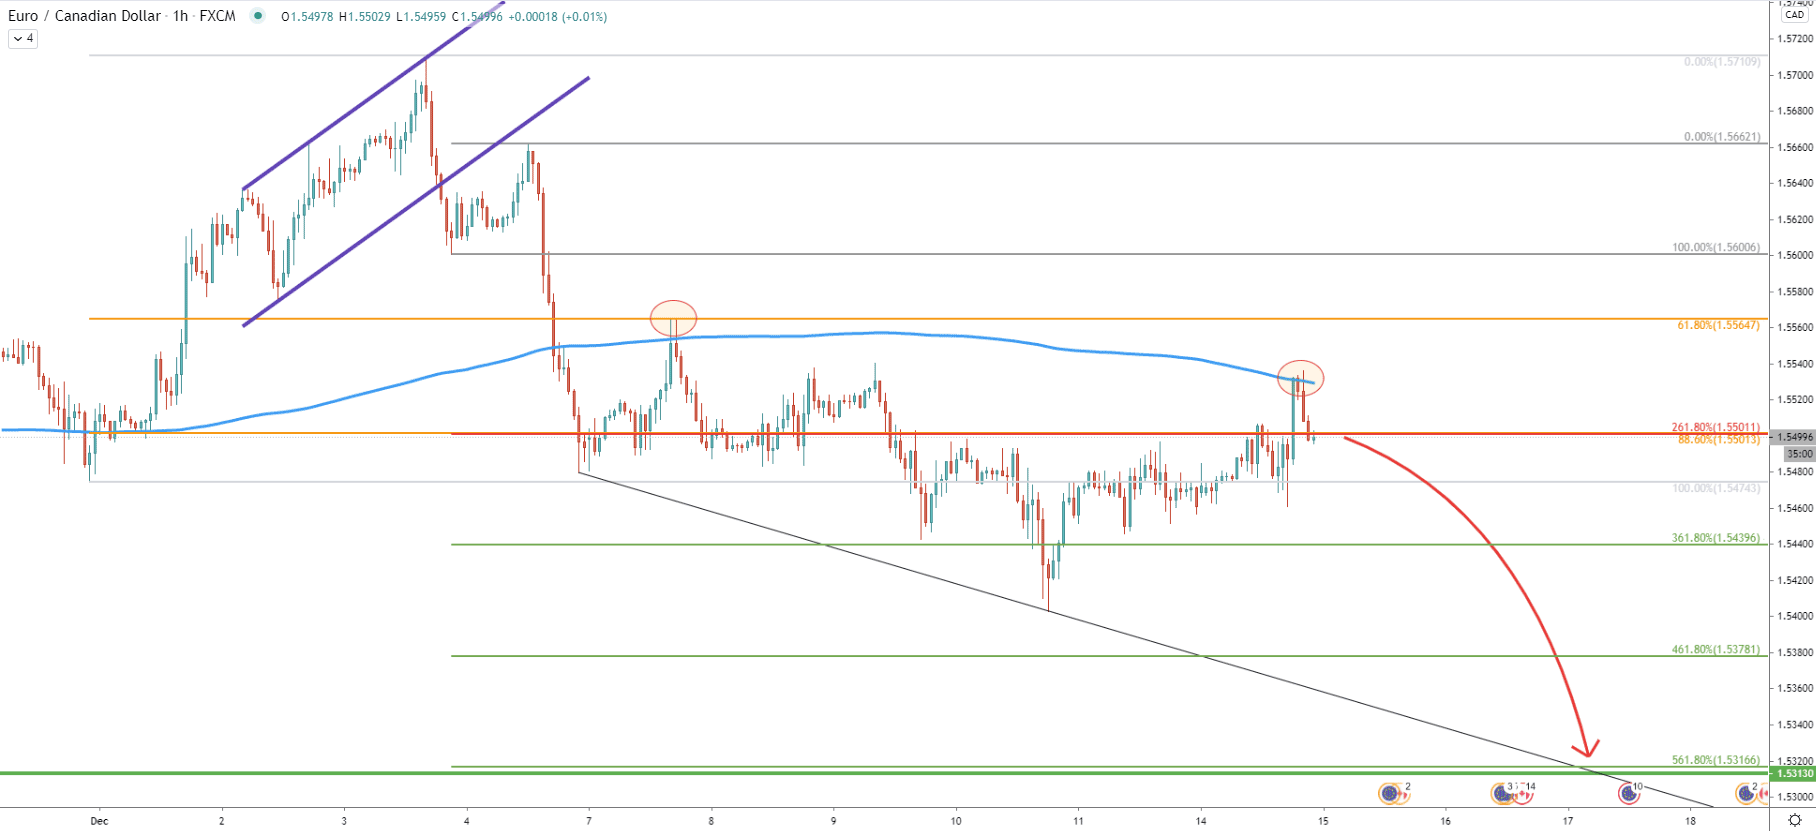
Finally, on the hourly chart Fibonacci retracement indicator was applied to the corrective wave up, after the price broke below the ascending channel. It shows multiple support levels, and any of them might act as the final downside target if rejected.
Right now, EUR/CAD is just below the 1.5500 key psychological resistance, which is confirmed by 261.8% and 88.6% Fibs. As long as the price remains below the 200 EMA and the 1.5500 resistance, the probability of the downtrend will remain very high. And based on the 561.8% Fibonacci crossing with the support downtrend trendline, EUR/CAD might decline by 200 within the next 48 hours.
EUR/CAD consolidation phase is ongoing, although the current price action is in favor of a downtrend, where the price is likely to test the bottom of the minor range. This might result in a 200 pip price drop thought this week.
As per the 4-hour chart, the strong demand area is based between 1.5300 and 1.5330.
As per the 4-hour chart, the nearest resistance is located at 1.5565. It is possible that EUR/CAD will re-test this level and produce a spike above it. However, only daily break and close above will invalidate bearish outlook, and only then EUR/CAD can be expected to move towards the top of the minor range.
Support: 1.5330, 1.5310
Resistance: 1.5565, 1.5614, 1.5712