
Published: September 28th, 2020
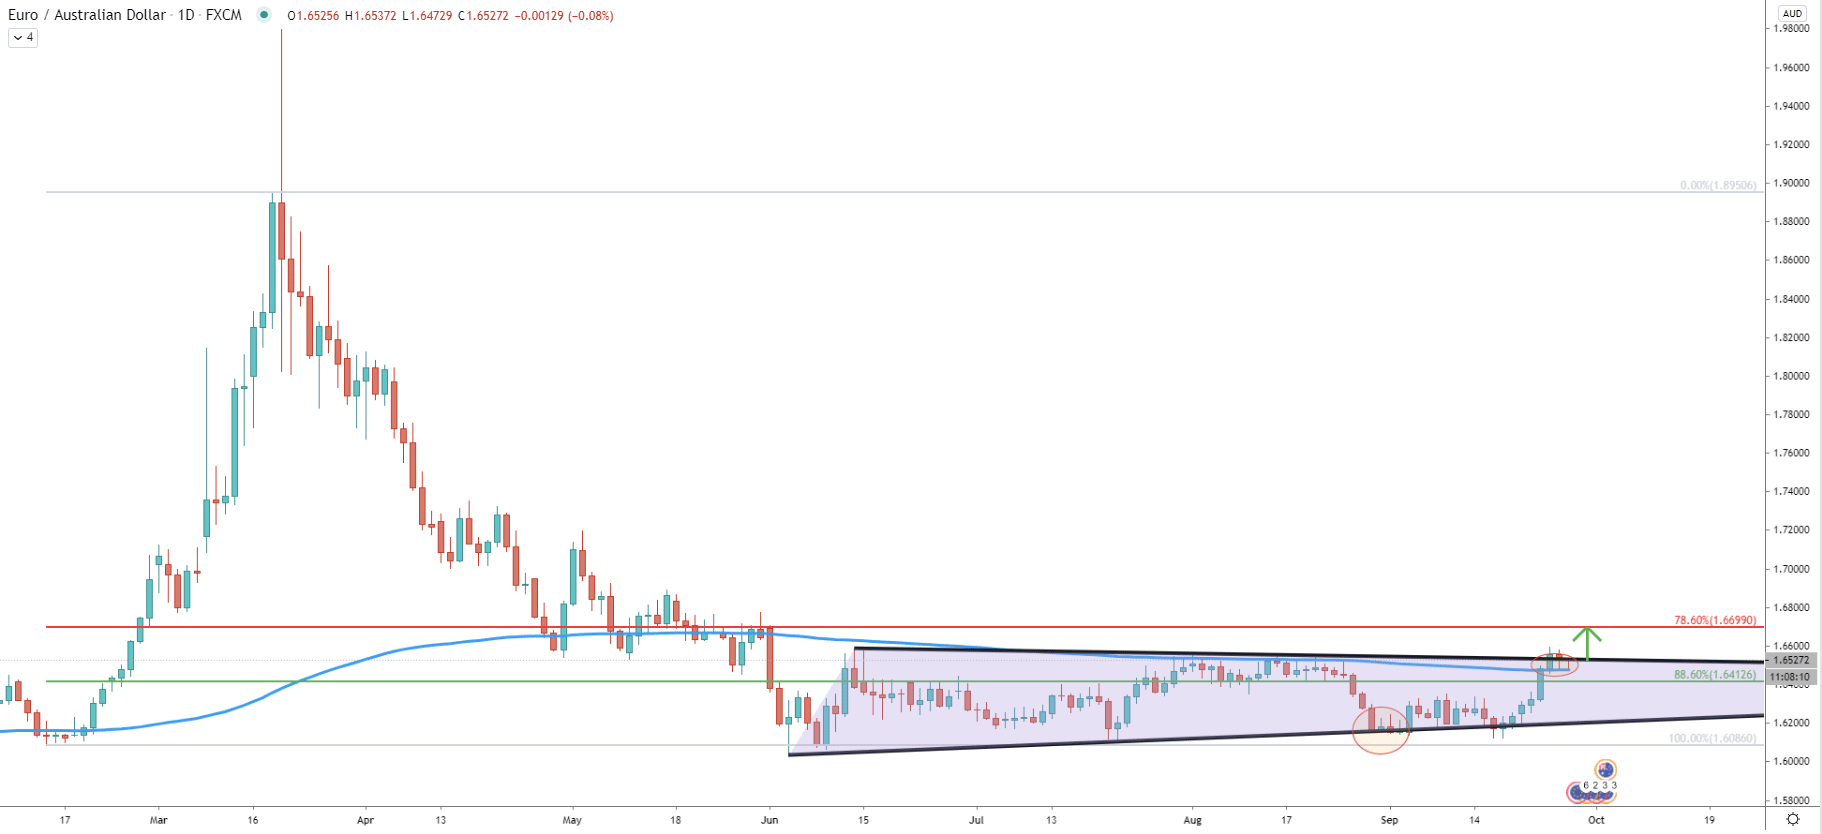
Since June, when the price bottomed out at 1.6086, EUR/AUD has been forming a triangle pattern. Earlier this month pair rejected the uptrend trendline and started to move up. At the end of last week, EUR/AUD broke above the triangle as well as 200 Exponential Moving Average. This is an extremely bullish sign for the EUR/AUD, which might result in substantial gains in the weeks to come.
Nonetheless, the nearest resistance level is located at 1.6700, which is a strong psychological level corresponding precisely to the 78.6% Fibonacci retracement level. As can be seen on the chart Fibs we applied to the overall rally, which took place back in February-March this year.
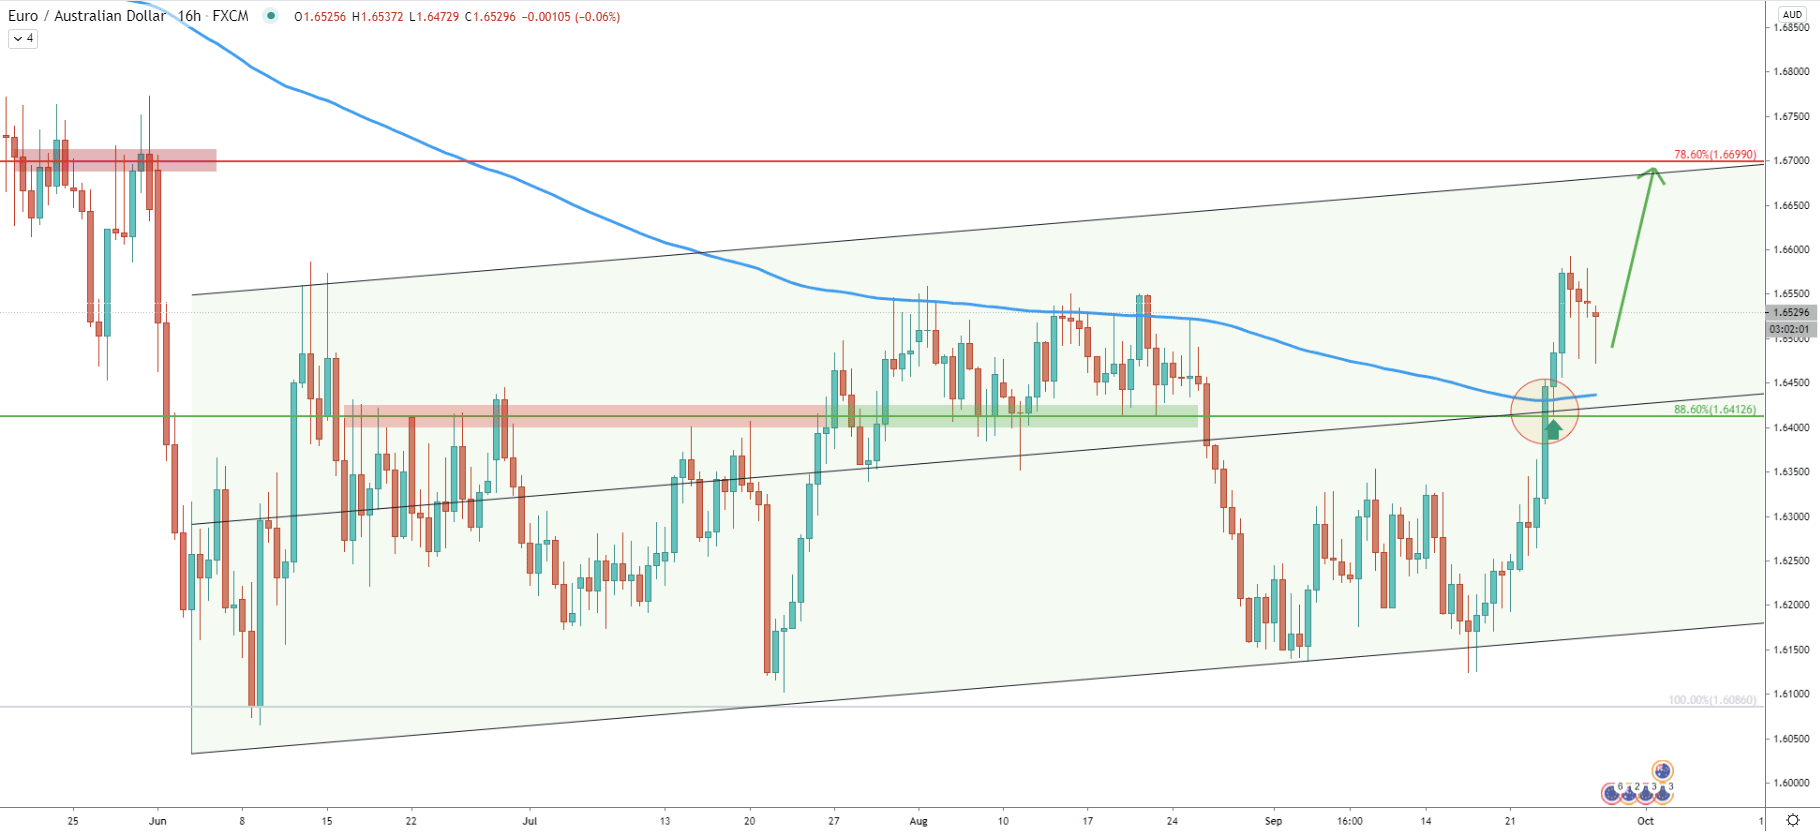
EUR/AUD continues to trade within the ascending channel on the 16-hour timeframe. On the September 23 price went up sharply and broke above multiple resistance indicators. The first one is the middle trendline of the ascending channel. The second is the 200 Exponential Moving Average. And the third is the 88.6% Fibonacci retracement level at 1.6412. In the past, this price clearly was a strong supply/demand level. Although the most recent price action shows that EUR/AUD broke above this important resistance with confidence and under a heavy trading volume. Also, after breaking above 88.6% Fibs, it is clearly seen that it acted as the support, which was rejected cleanly.
Perhaps this shows that bulls are strongly dominating and this tendency is highly likely to continue, especially considering all the facts that will be presented on the following charts. Besides, the previously mentioned upside target at 1.6700, almost exactly corresponds to the top of the ascending channel.
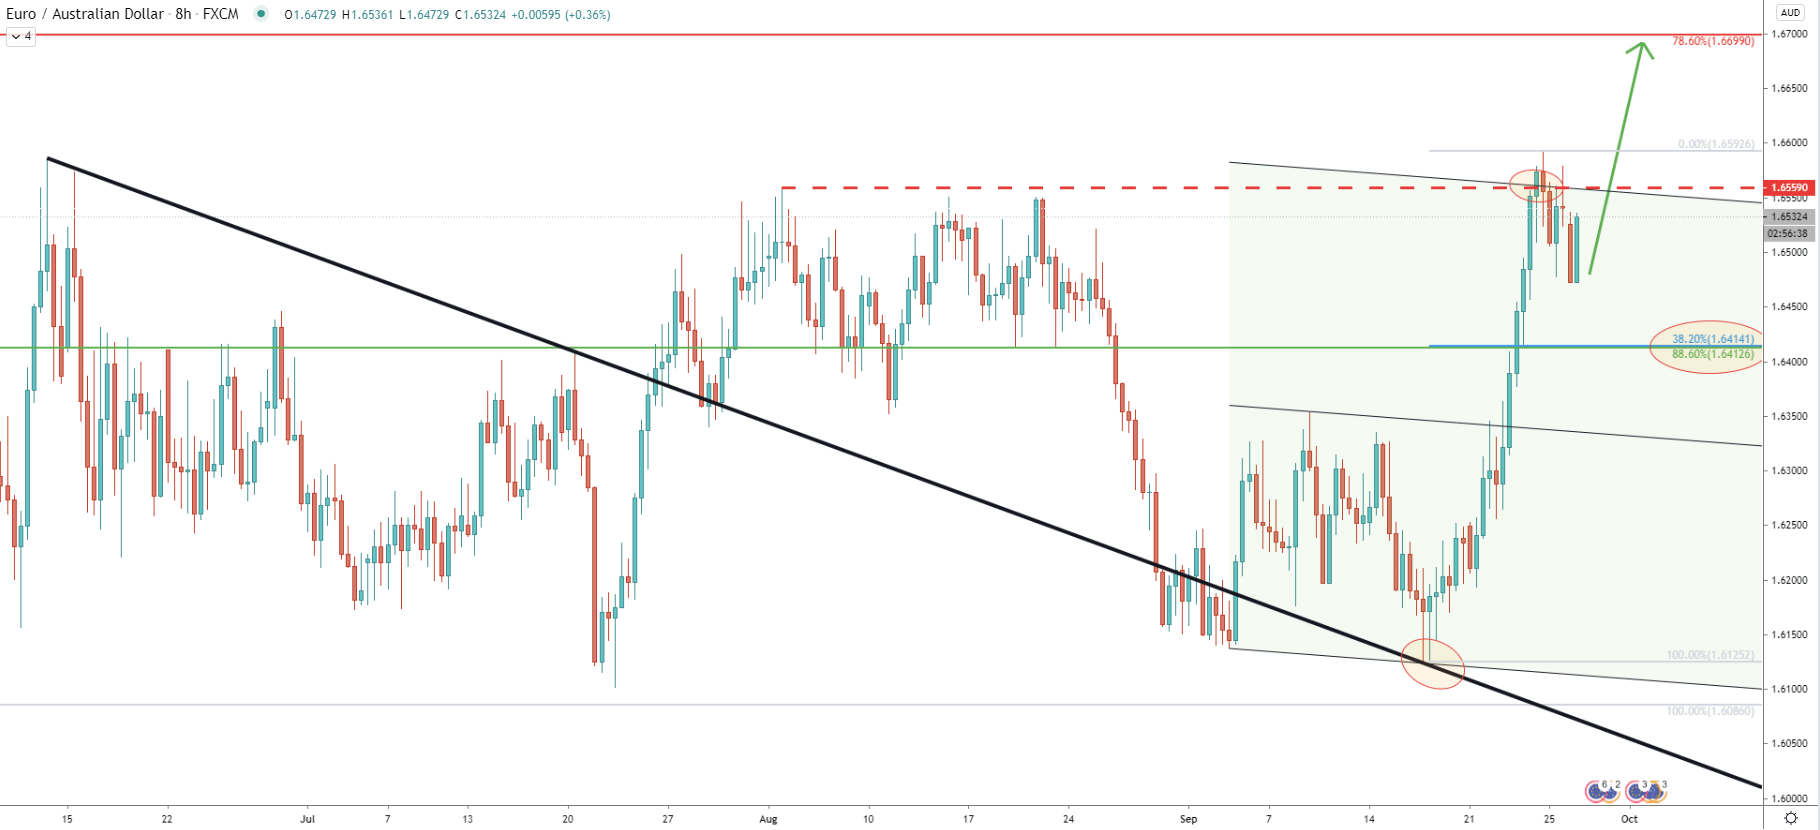
When the last bottom was tested at 1.6125, EUR/AUD rejected the average-price downtrend trendline after which the uptrend has started. Last week, the pair broke above the upper trendline of the extended descending channel as well as the previously formed resistance at 1.6560. Currently, the key support level is located at 1.6415 area, which corresponds to two Fibonacci retracement levels. The first being 88.6% as per the daily chart, and the second being 38.2% Fibs applied to the current upside move.
Therefore, if the uptrend to continue, in the worst-case scenario, EUR/AUD might re-test the 1.6415 area, before/if the price will continue rising. However, such a scenario seems to hold very little probability at this stage.
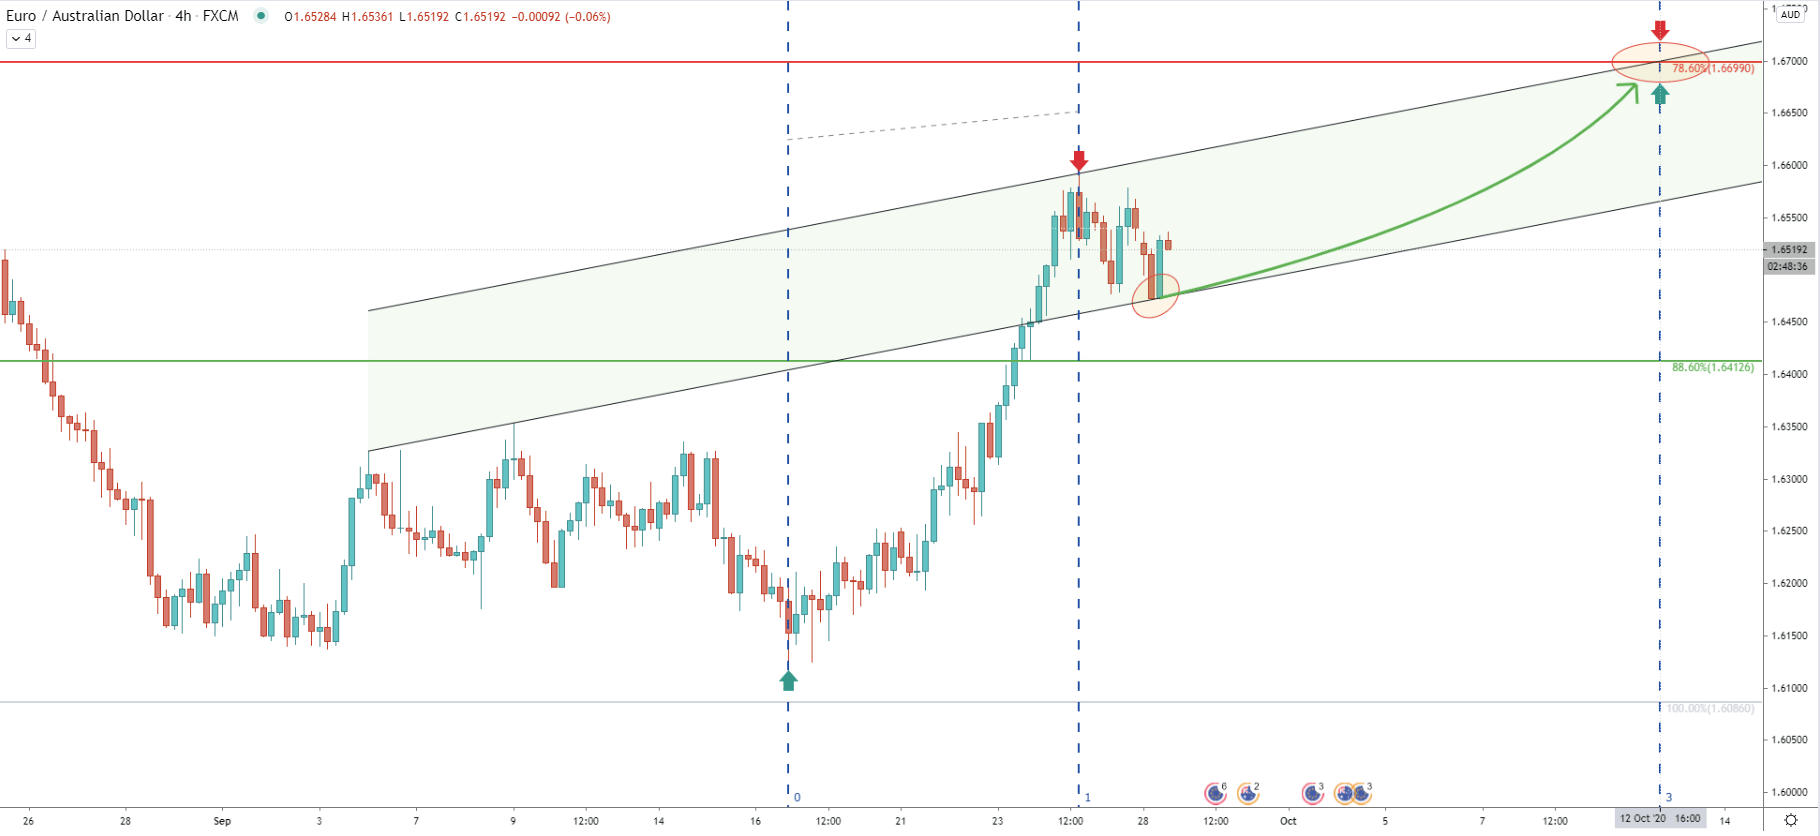
Fibonacci time zone indicator was applied through the previously formed low and the most recent high. It shows the next potential down cycle on October 12 which corresponds to the upper trendline of the ascending channel applied using the average-price uptrend trendline. It is possible that the consolidation phase will take place, and EUR/AUD will test the upside target at 1.6700 only two weeks from now.
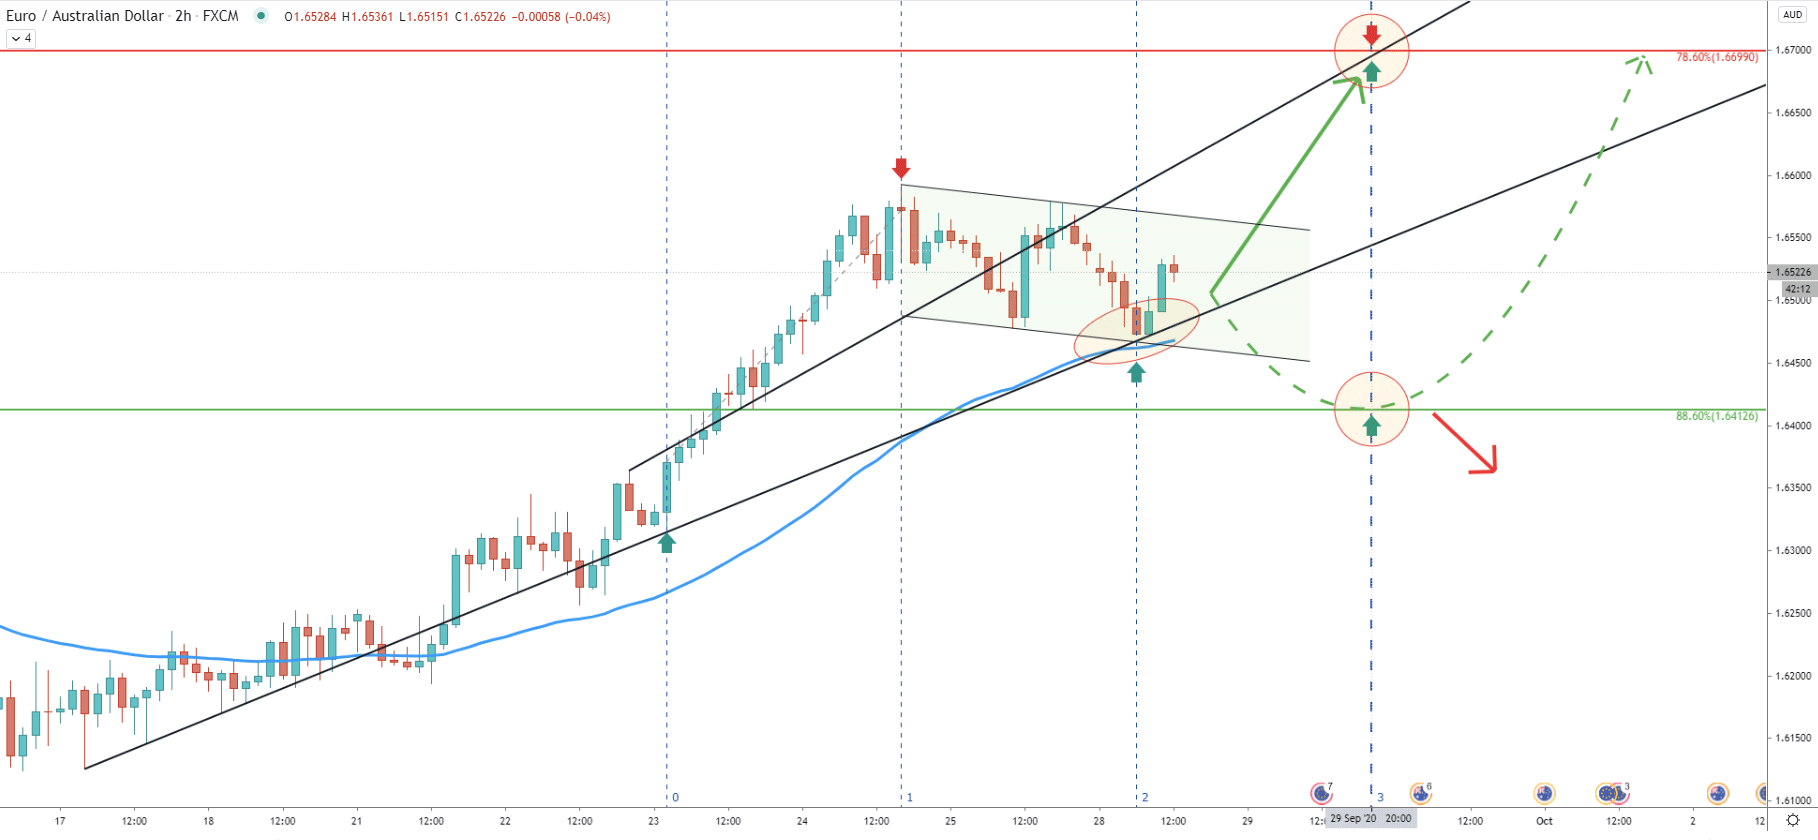
Quite to the contrary of the cycle analysis on the 4-hour chart, here we can see that price might go up much sooner. Fibonacci time zone indicator was applied through the last point of rejection of the uptrend trendline and the most recent lower low. It is very clear that the new cycle has just started, and most probably it will be a bullish cycle. This is because the 50 EMA along with the uptrend trendline was rejected clearly today.
Therefore, if the uptrend continuation already taking place, EUR/AUD can potentially test 1.6700 in just a few days from now, Because the next Fibonacci cycle is on September 29 and it corresponds to the average-price uptrend trendline. But it is also possible that up until the next cycle, the price will continue to move lower, to re-test the 1.6415 support level before/if the pair will start rising.
EUR/AUD broke above multiple resistance levels at the end of the last week. The most recent pullback resulted in a clear rejection of the uptrend trendline as well as the Exponential Moving Average, validating the uptrend. As long as the recently produce low at 1.6473 holds, the probability will remain in favor of the uptrend continuation.
As per the daily chart, the nearest resistance is located at 1.6700, which is the strong psychological level confirmed by a 78.6% Fibonacci and implies the potential growth of 150-200 pips in the coming days or maybe weeks.
The very first sign of the price weakness could be a daily break and close below the most recent low at 1.6473. Although to completely invalidate the bullish outlook, EUR/AUD must also break below the key support level at 1.6412.
Support: 1.6412
Resistance: 1.6700


