
Published: March 27th, 2020
In recent days may AUD pairs have shown signs of potential trend reversal or correction. It seems that investors choosing Australian Dollar over most other currency pairs. In today’s analysis, we will observe the EUR/AUD currency pair and upcoming price action in the coming weeks.
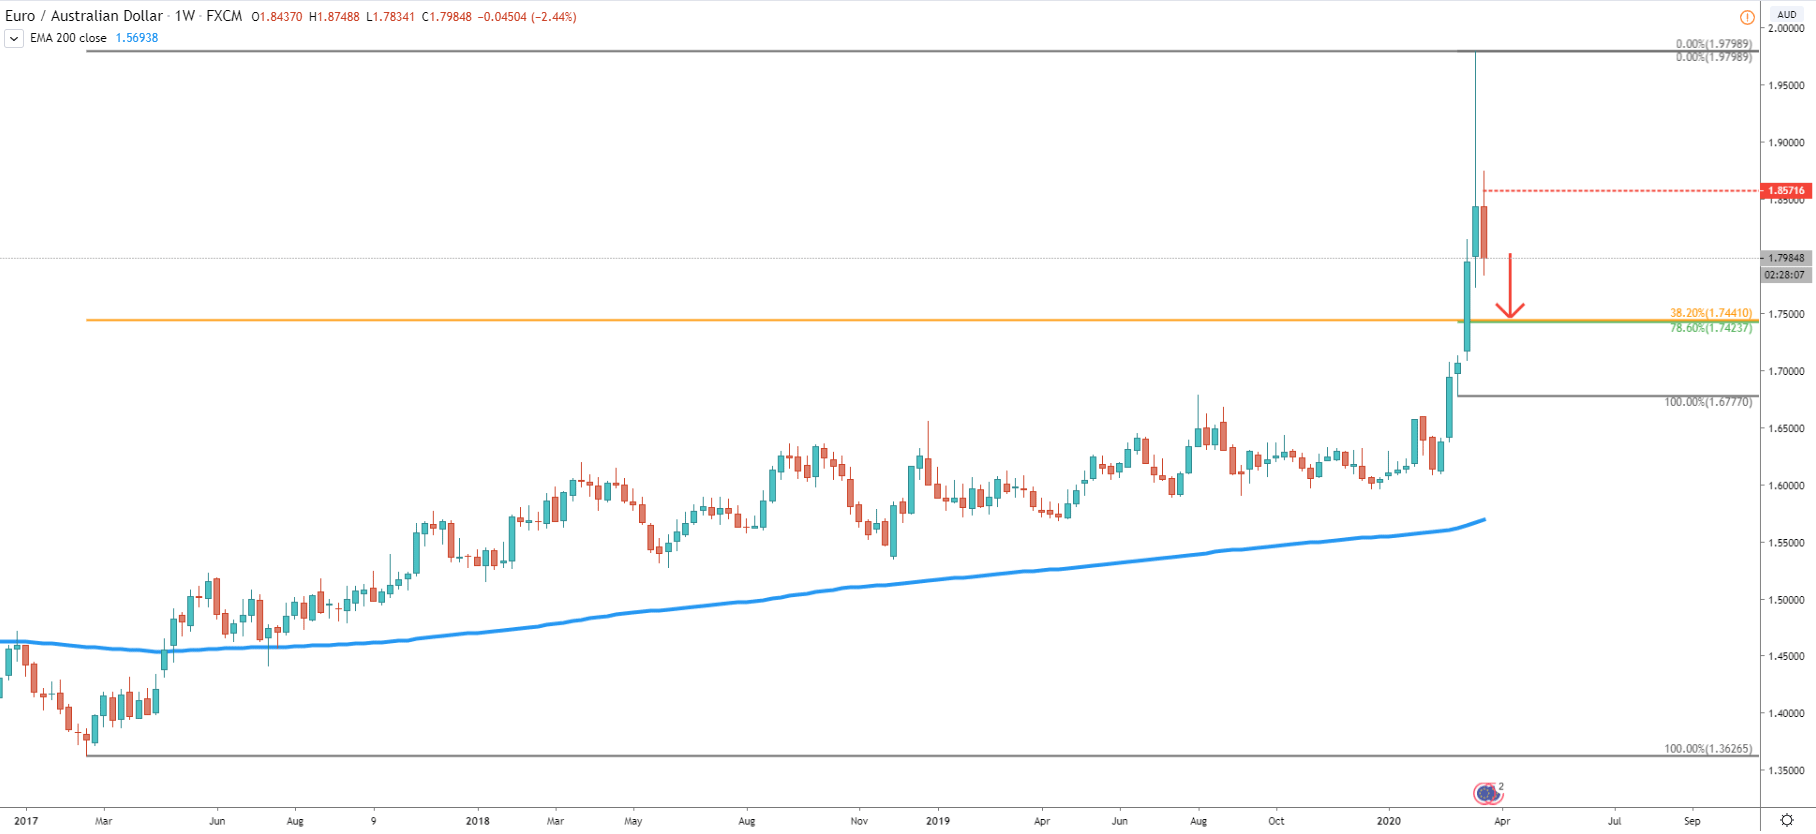
The Weekly charts show us the potential downside target if the correction down will continue. There are two Fibonacci retracement indicators applied to the chart. One to the minor wave up and another to the major wave up. Both of them are pointing to 1.7420 -1.7440 area, which could be strong demand zone. Currently this level could be acting as a magnet in the medium to short term, and price is expected to test this price area within couple of weeks.
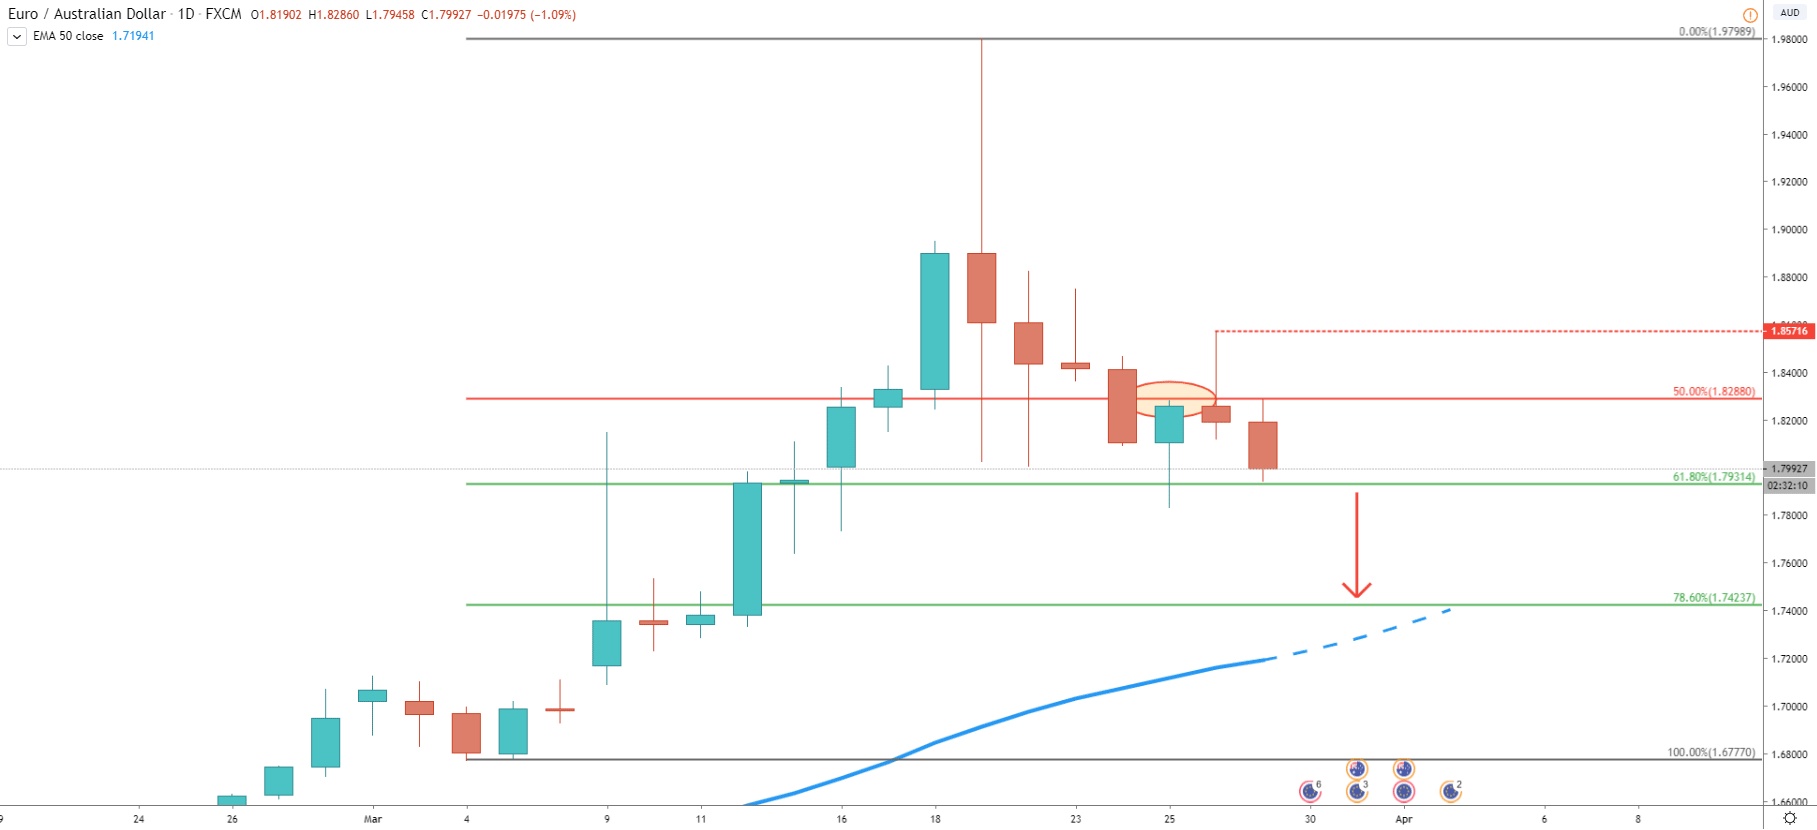
On the daily chart, we can see closer Fibonacci levels applied to the last wave up. It shows that the 50% retracement level at 1.8288 has been rejected cleanly on March 25. Price then attempted to move higher and in fact, it did, although it failed to close above that level. The fact is, the Fibonacci resistance has been respected by the market which might or even should result in more selling pressure. Our downside target corresponds to the 200 Exponential Moving Average, which makes this “demand magnet” even more powerful. But at the same time. It is also supported at the 61.8% Fibonacci level, which is 1.7931. A daily close above would add even more confidence to sellers and can result in a very fast downside move.
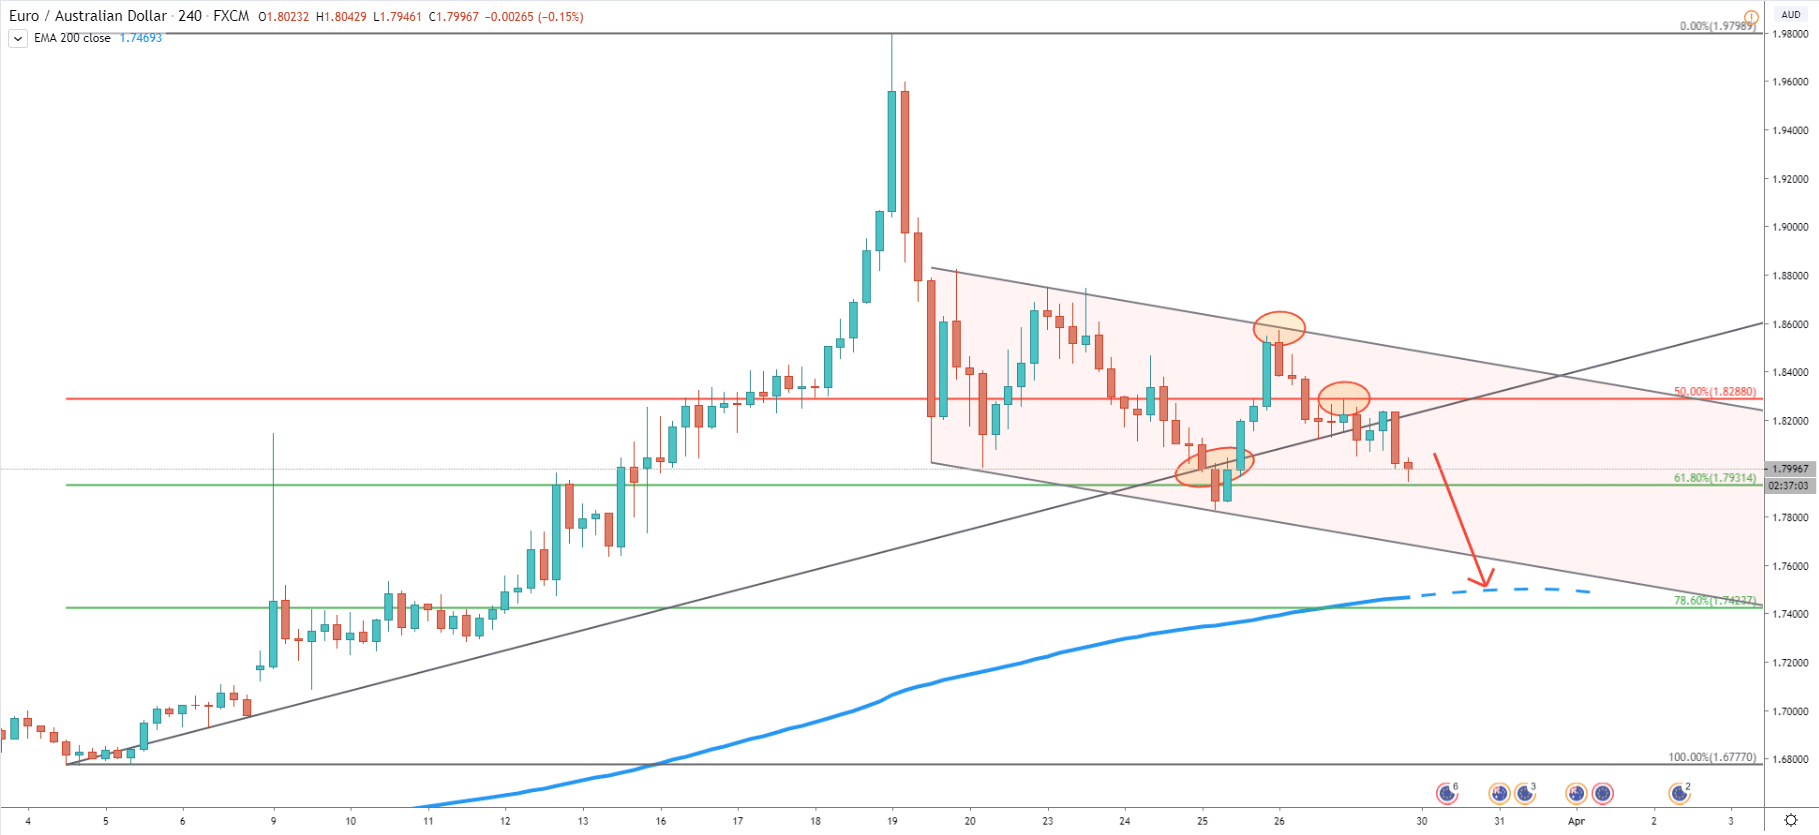
The 4-hour chart is getting more interesting. Here we can see that price has reached and rejected the upper trendline of the ascending channel on May 26. Prior to that price broke below the uptrend trendline, went up and today, yet again broke below it. At the same time, 50% Fibonacci retracement has been rejected cleanly and now it seems a decline towards 1.7420 area is inevitable. This support is also confirmed by the 200 EMA on the 4H chart. And just to remind you, that the downside target, now corresponds to 200 EMA on Daily and 4H charts, making it a perfect profit taking area.
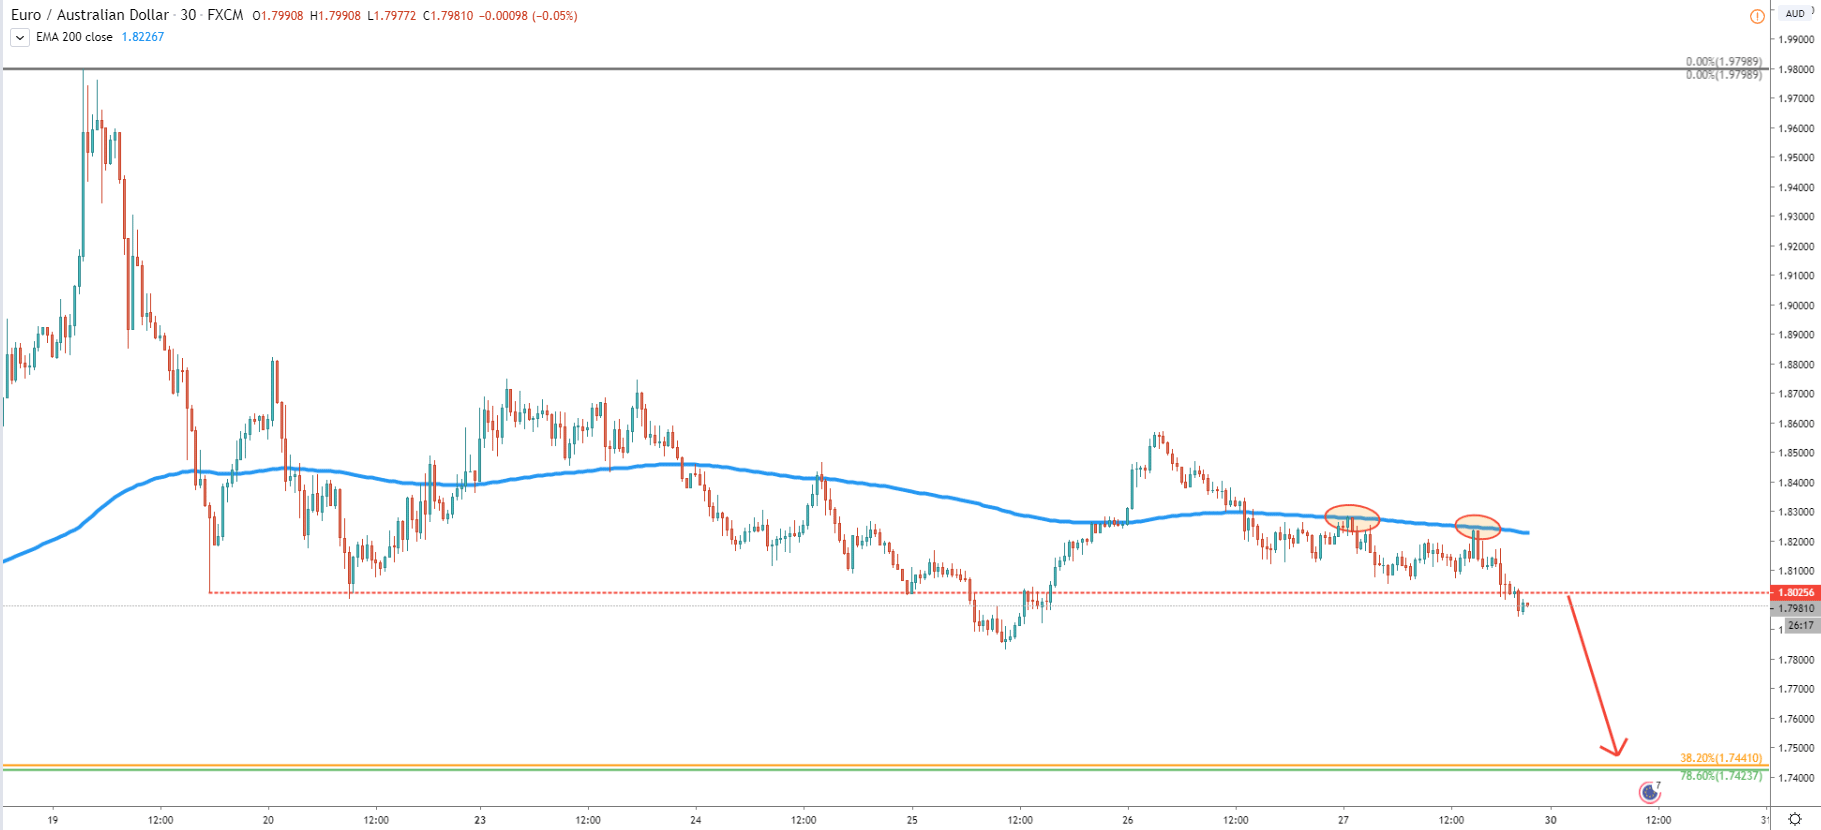
Finally, the 30m chart shows that EUR/AUD rejected the 200 EMA on two occasions while producing lower lows and lower highs. This is yet another strong selling point, where the downtrend can accelerate at any time. But, small upside corrective moves can also be expected, perhaps presenting good selling opportunities for the medium term.
EUR/AUD started to produce lower lows and lower highs while rejecting 200 EMA on the 30m chart. The 50% Fibonacci resistance has also been rejected, which goes to show that selling pressure might increase. As long as the price remains below 1.8300, EUR/AUD is likely to continue moving down.
There is only one downside target, which is not just strong but should play a key role in further price development in the long run. The support is between 1.7920 and 1.7940, which is confirmed by two Fibonacci levels and 200 EMA on two different timeframes.
The nearest resistance is located at 50% Fibs, which is 1.8288. It makes 1.8300 area a key price level, which if broken, will invalidate bearish scenario and price is likely to continue long term uptrend.
Support: 1.7930, 1.7440, 1.7420
Resistance: 1.8288, 1.8300