
Published: September 21st, 2020
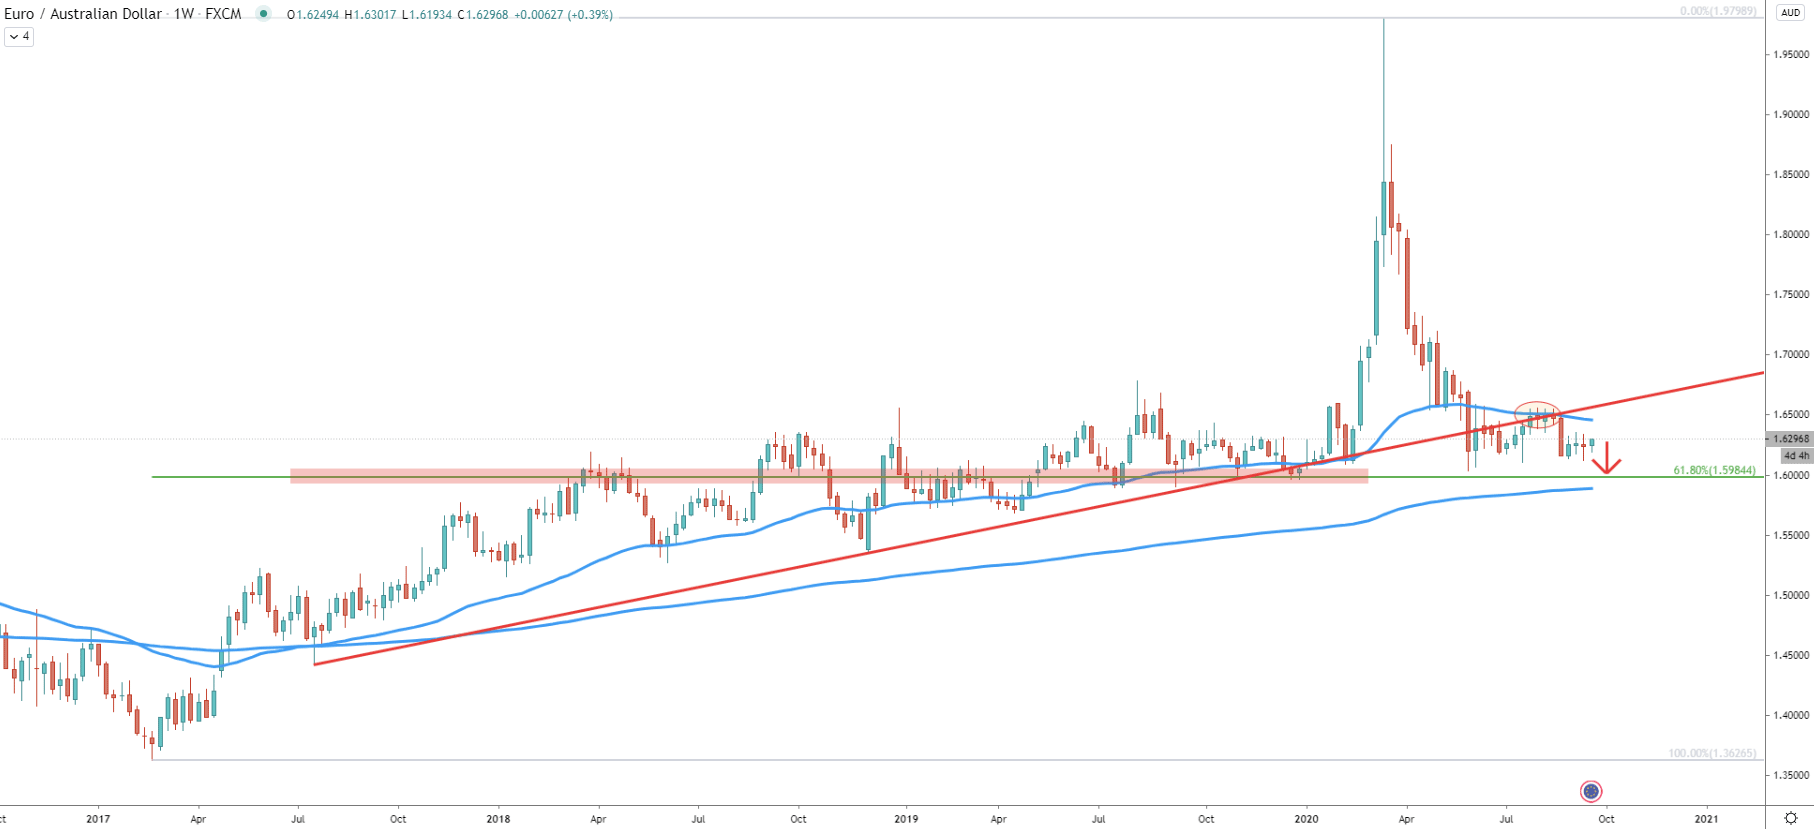
Looking at the weekly chart, it is clear that the uptrend trendline has been broken along with the 50 Exponential Moving Average. This goes to show that right now bears are dominating and most likely will try to push the price down, towards the 200 EMA. This should result in a price drop towards the 1.6000 key psychological level, which nearly corresponds to the 61.8% Fibonacci retracement level located at 1.5984. Besides, the 1.6000 is a strong supply/demand zone, which previously acted as the support as well as resistance.
Another important point is that after the breakout of the trendline and the 50 EMA, both of these support indicators became the resistance. EUR/AUD rejected the 50 EMA and the trendline simultaneously back in August as can be seen on the chart.
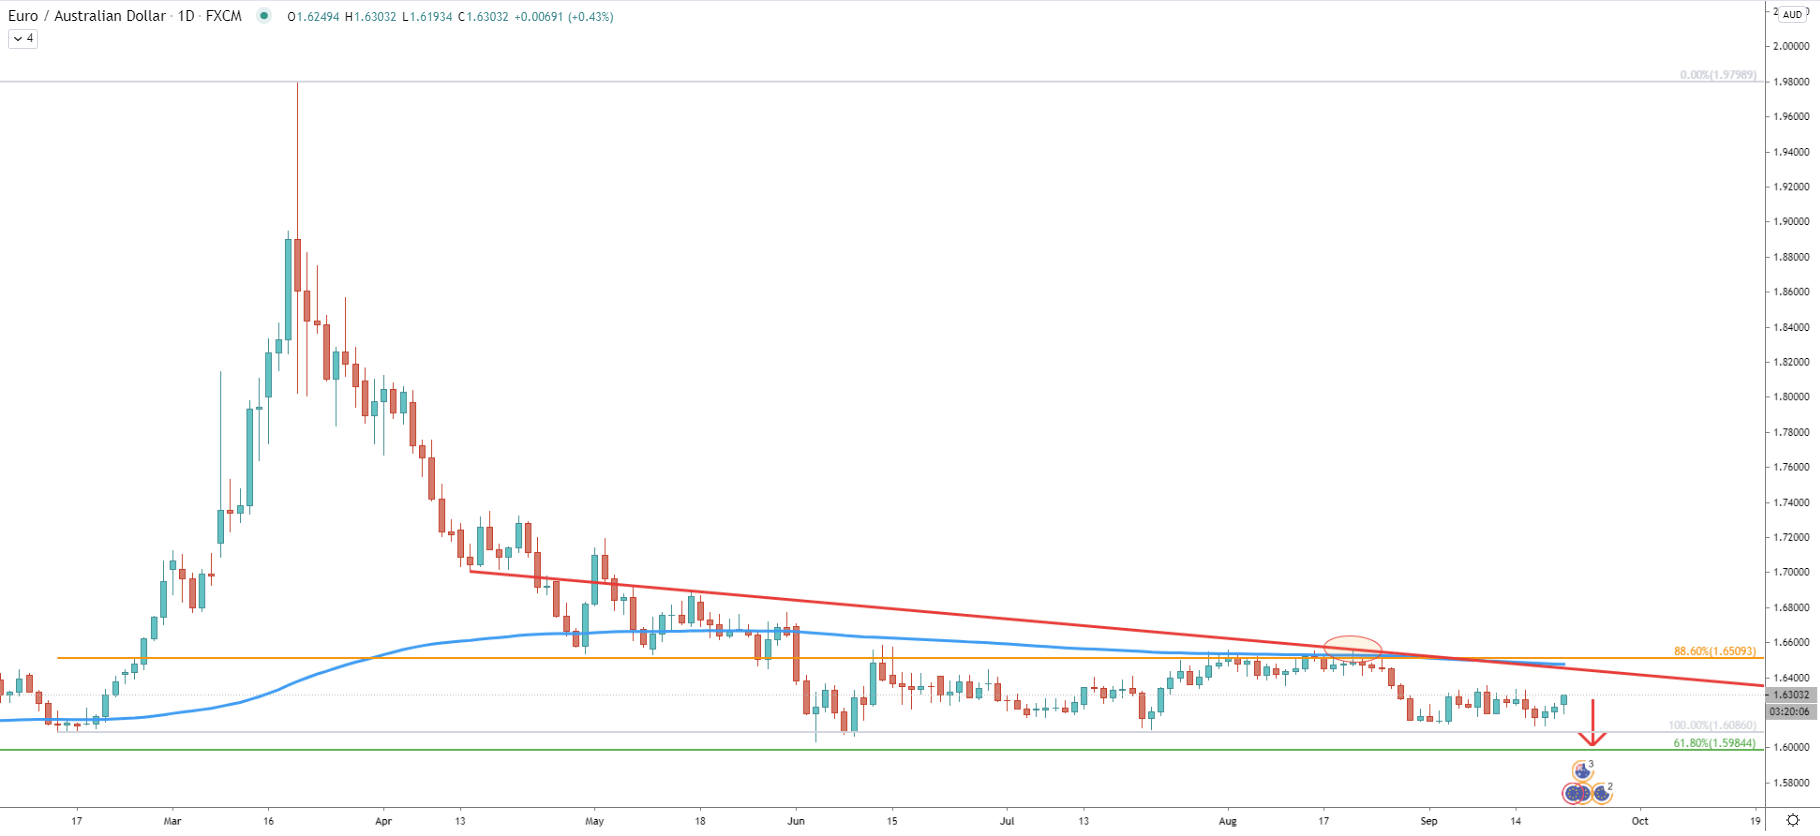
The daily chart gets even more interesting. There was an extremely presice rejection of the average-price downtrend trendline. Simultaneously, EUR/AUD rejected the 88.6% Fibonacci retracement level at 1.6509 and the 200 Exponential Moving Averages. Clearly there is a massive resistance near 1.6500 psychological level and as long as the price remains below, downtrend continuation is imminent.
Throughout this month, EUR/AUD has been consistently rejecting the 23.6% Fibonacci retracement level at 1.6307, which is yet again very close to the 1.6300 psychological resistance. Today price has approached this level for the forth time along with the 50 EMA. Considering this month’s price action, the probability is strongly in favor of this resistance being rejected. This could be a very attractive price for sellers, therefore, selling pressure should remain extremely high. Besides, the RSI has reached the downtrend trendline, which is acting as the resistance, adding extra confidence to the potential downtrend continuation.
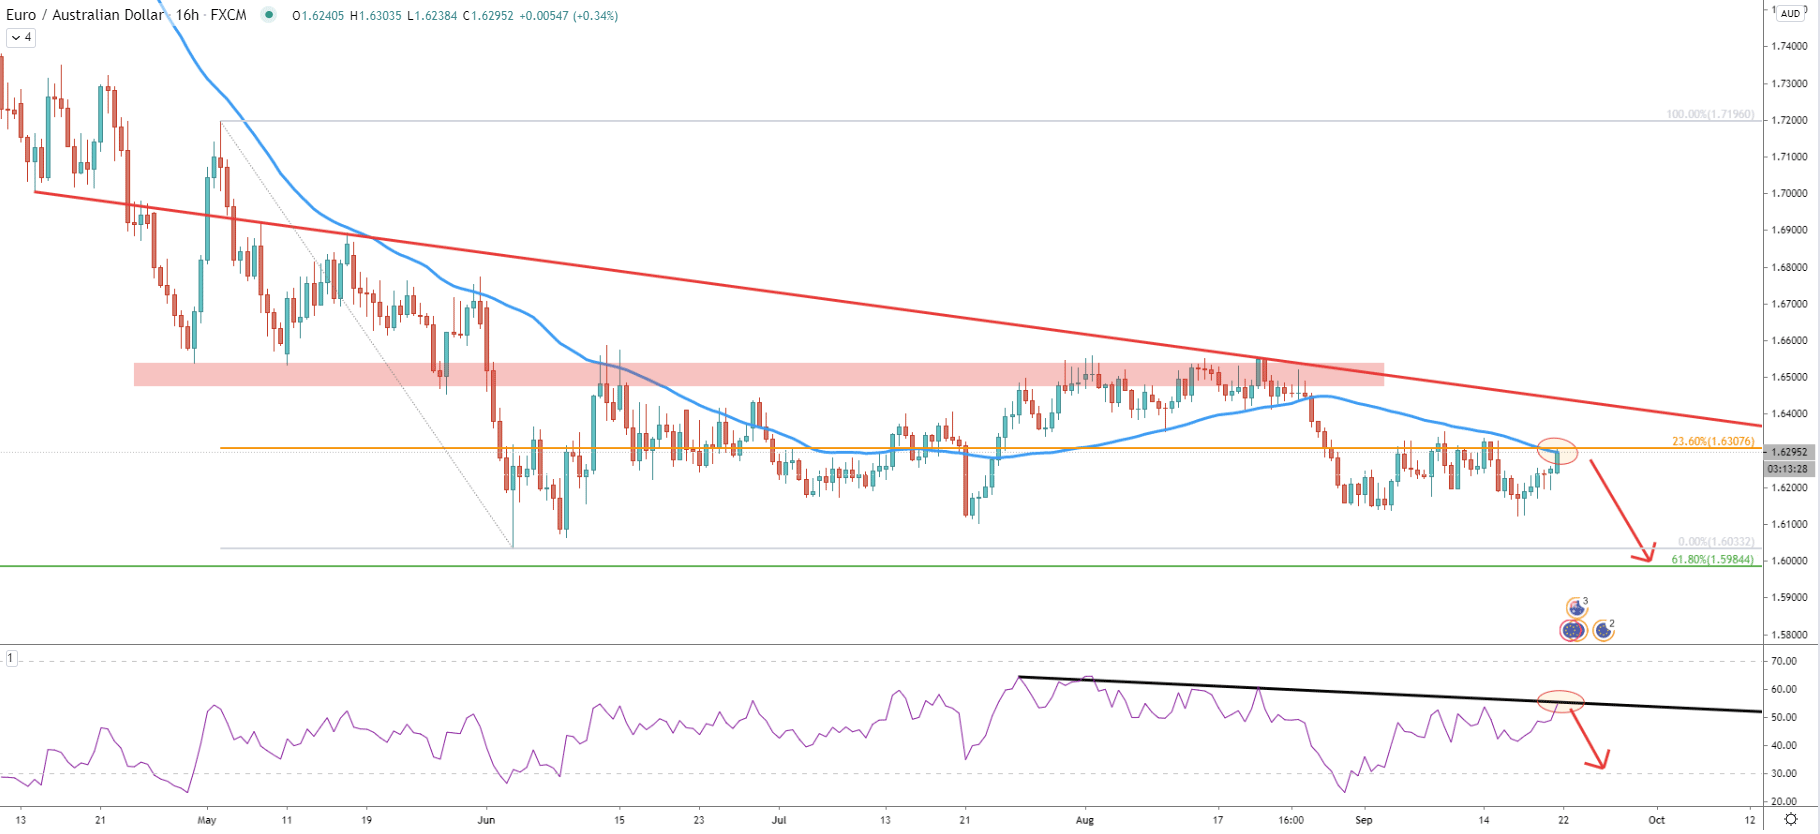
On the 4-hour chart, the price has approached the long and medium term downtrend trendlines. None of them were tested nor rejected, although it is highly likely that at least one of them will get tested today. But the 200 EMA already was tested and so far it has been rejected. Also, the uptrend trendline was already broken and currently is acting as the resistance along with the 200 EMA. Such price action might suggest that there will be spikes to the upside, prior to the downtrend continuation.
Fibonacci retracement indicator was applied to the corrective move up, which took place during this month. It shows that 23.6% at 1.6302 is the nearest resistance, which corresponds to the previously discussed Fibonacci resistance at 1.6307. This emphasizes the importance of the 1.6300 psychological resistance, which should be watched for the break to the upside. The 161.8% retracement level at 1.6004 is located very close to the 1.5984 support, as per the weekly chart. This means that the 1.6000 area could be a great demand zone in the future if/when reached.
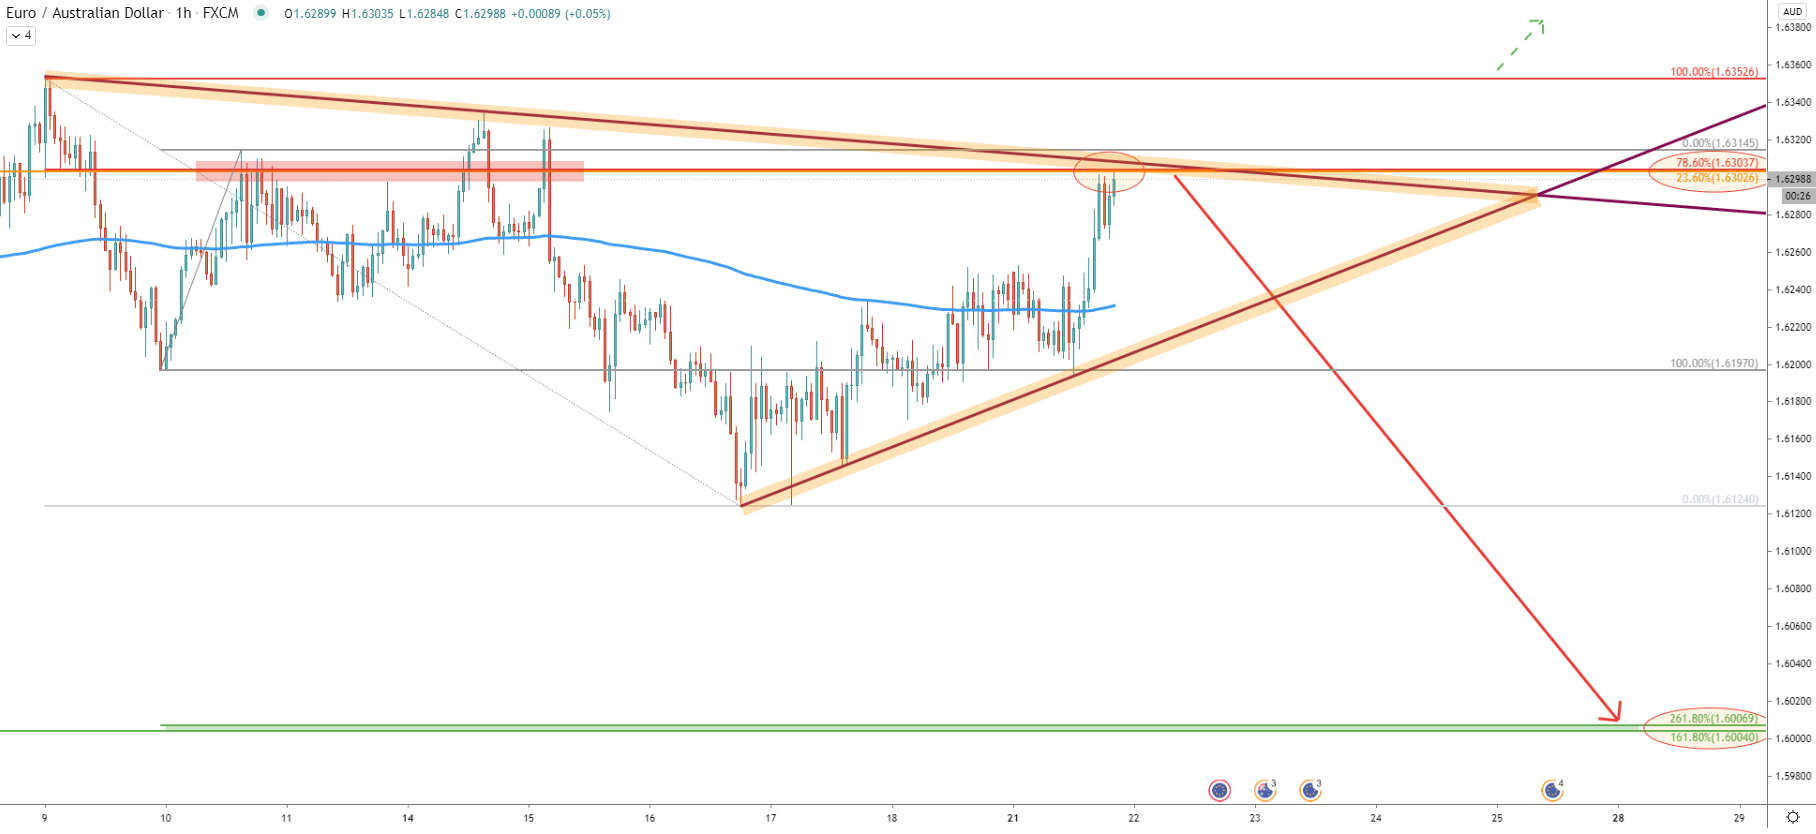
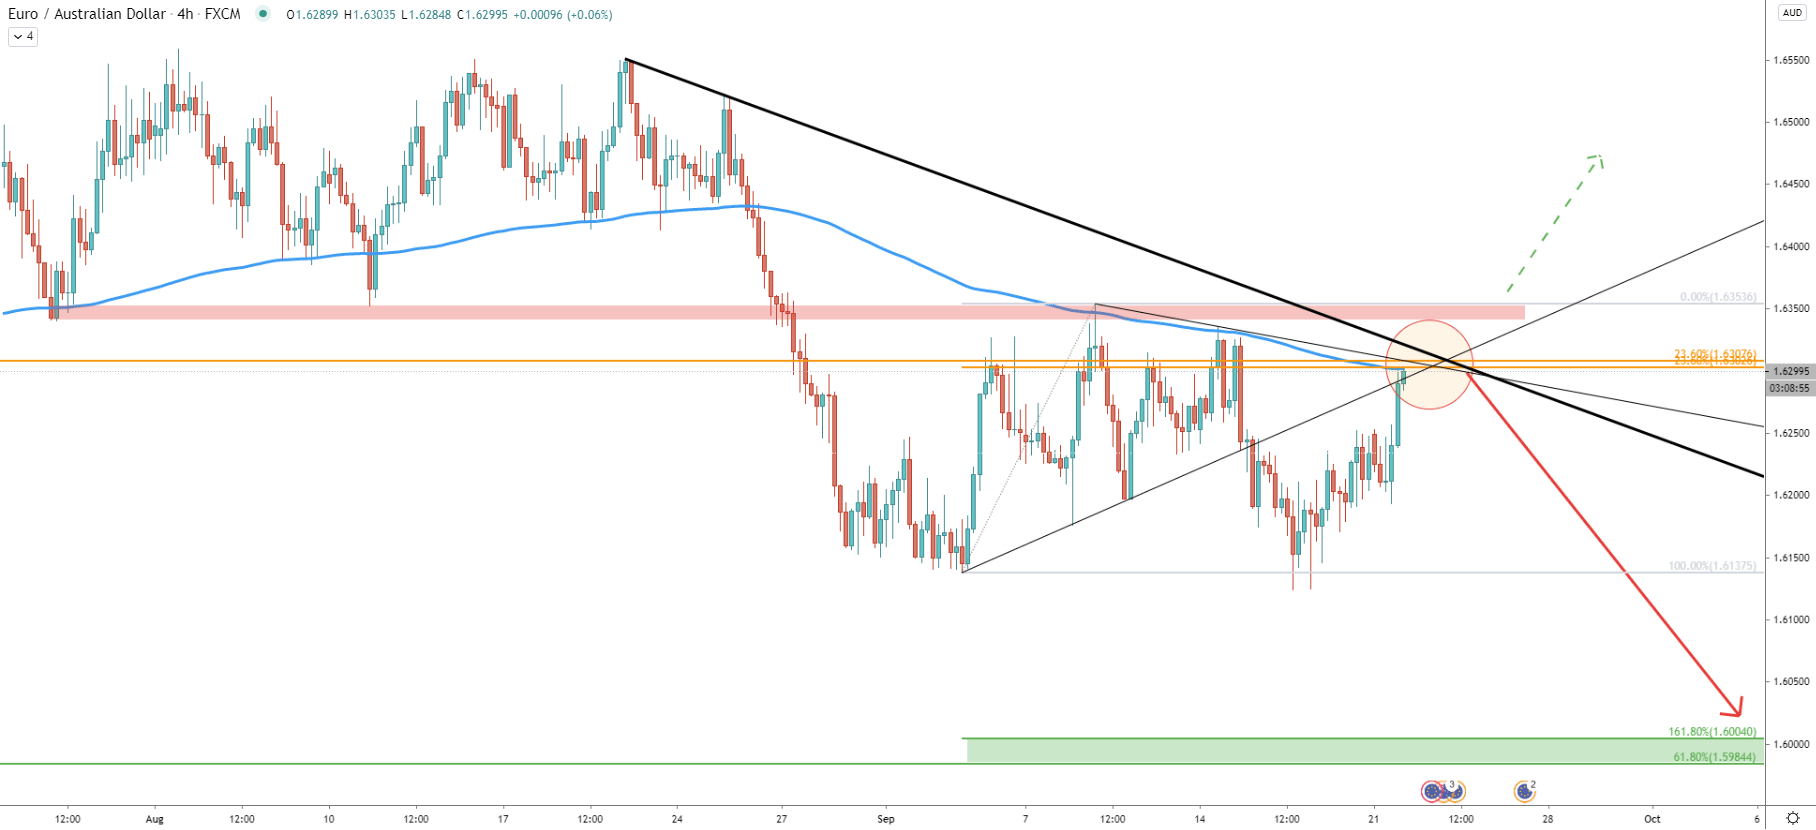
Another Fibonacci retracement indicator was applied to the corrective wave up occurred on September 10, where 1.6300 resistance was rejected. It shows that 78.6% Fibonacci retracement level corresponds exactly to the 23.6% Fibs as per the 4-hour chart. And the 261.8% retracement level corresponds to the 1.6000 support area.
To stay on the safe side, sellers might be waiting for the confirmed rejection of the downtrend trendline and the break below the uptrend trendline before taking action. Although upon such price action, the risk/reward ratio will not be that attractive as it is right now.
EUR/AUD long-term trend is clearly bearish and while the price has approached multiple resistance indicators it could be the starting point of yet another strong move to the downside.
The key support is located at 1.6000 psychological level, which is confirmed by two Fibonacci retracement levels as per the 4-hour and 1-hour charts. EUR/AUD should decline by 300 pips in the weeks to come as long as the resistance is being respected.
As per the 4-hour chart, 1.6300 is a very strong resistance. However, spikes above are possible on the daily and/or weekly chart. Therefore, only the daily break and close above 1.6353 resistance will completely invalidate the bearish scenario and the trend should be changing from bearish to bullish.
Support: 1.6137, 1.6000
Resistance: 1.6300, 1.6353


