
Published: May 12th, 2020
The Euro is losing investors’ attention as it continues to struggle against multiple major currencies in the long run. Perhaps the “coronavirus” effect will have a huge impact on the Eurozone economy in general and obviously on the Euro itself. The impact most obviously will be negative and EUR could be about to establish a strong downtrend. In today’s’ analysis we will analyze the EUR/AUD currency pair and what can be expected from the price in the weeks to come.
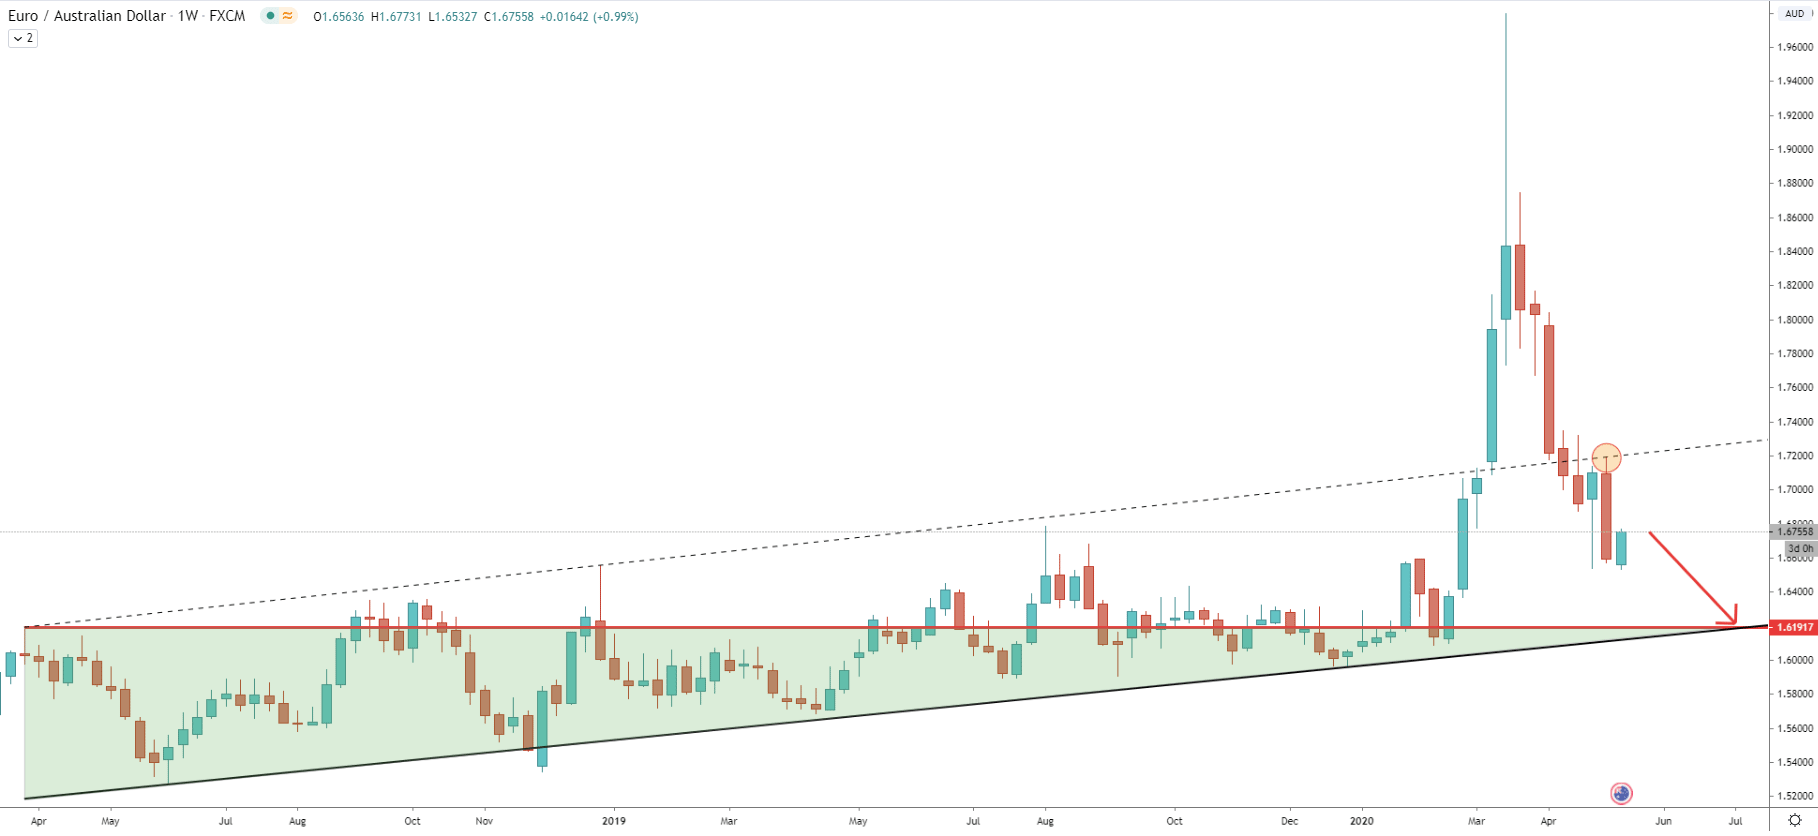
We could witness a very strong rally at first, where EUR managed to gain 23% over the Australian Dollar in just 5 short weeks. Truly enormous price rally resulted in an extremely sharp correction down. Since EUR/AUD has reached the top at 1.9800, it has already dropped by over 15% based on the current price. Pair broke below the average-price trendline, corrected up, and rejected the trendline cleanly as we can see on the chart. This could result in the continuation of this price drop, where the nearest support is the long term uptrend trendline. The uptrend trendline also corresponds to the previous level of resistance at 1.6192, and therefore, EUR/AUD could be heading towards 1.6200 psychological level in the coming weeks.
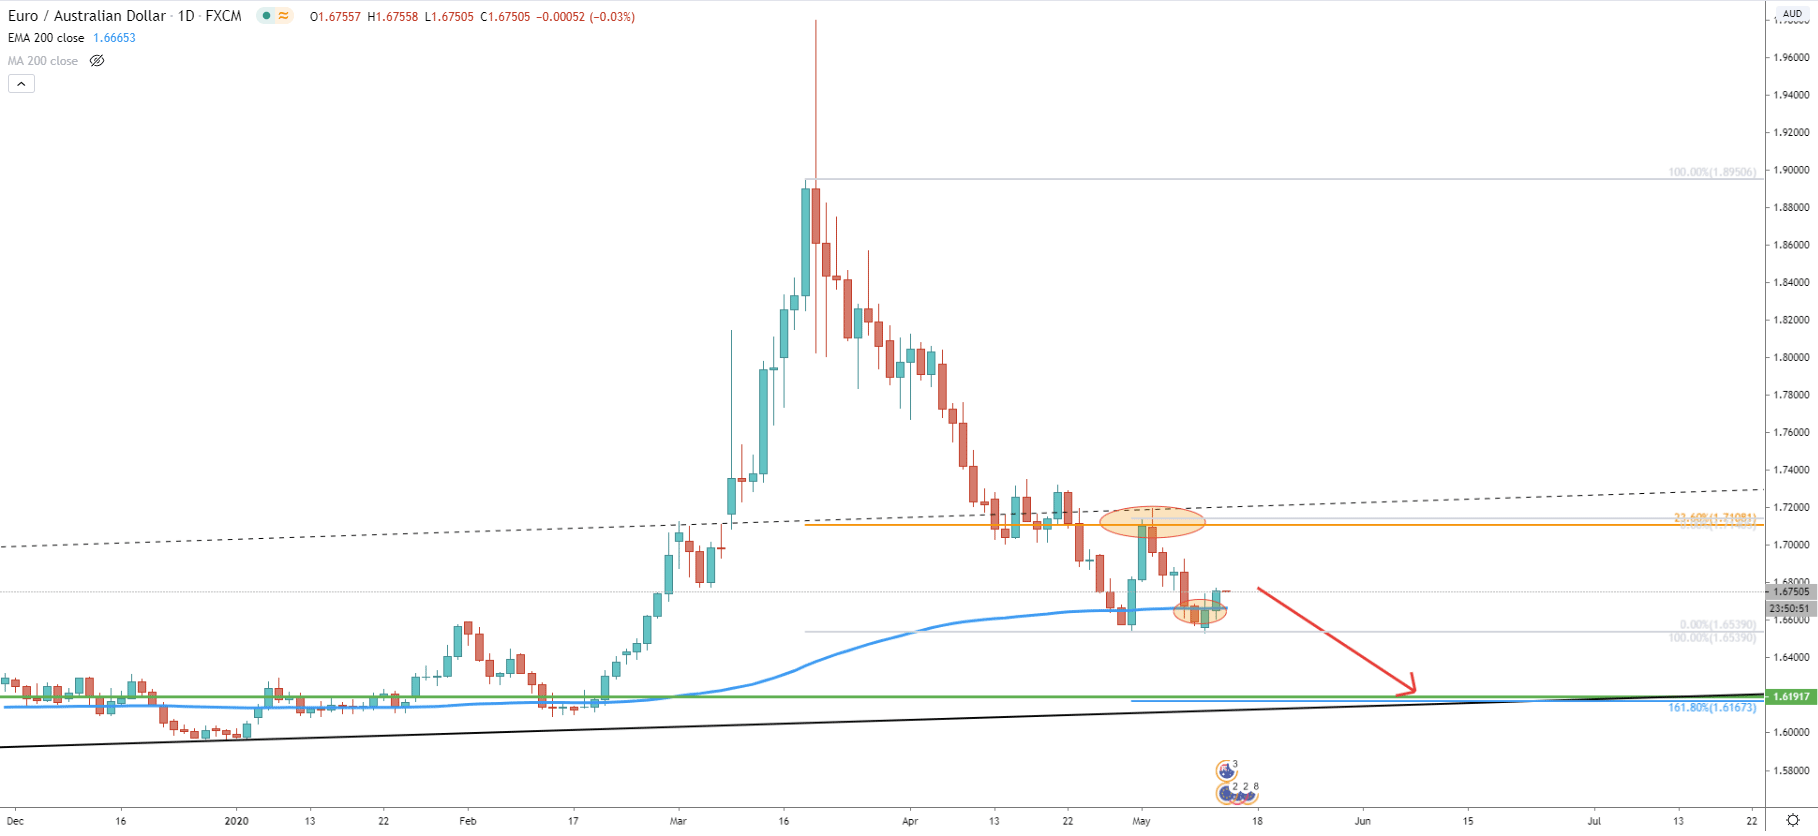
Fibonacci, applied to the March 19 - April 30 medium-term downtrend, shows that EUR/AUD rejected the 23.6% Fibonacci retracement level at 1.7108, after which price broke below the 200 Exponential Moving Average. This shows a very strong price weakness in the long term. We have applied another Fibonacci indicator to that upside correction. What is interesting is that 161.8% Fibs corresponds to the 1.6200 downside target area. But there is more to that on the following charts.
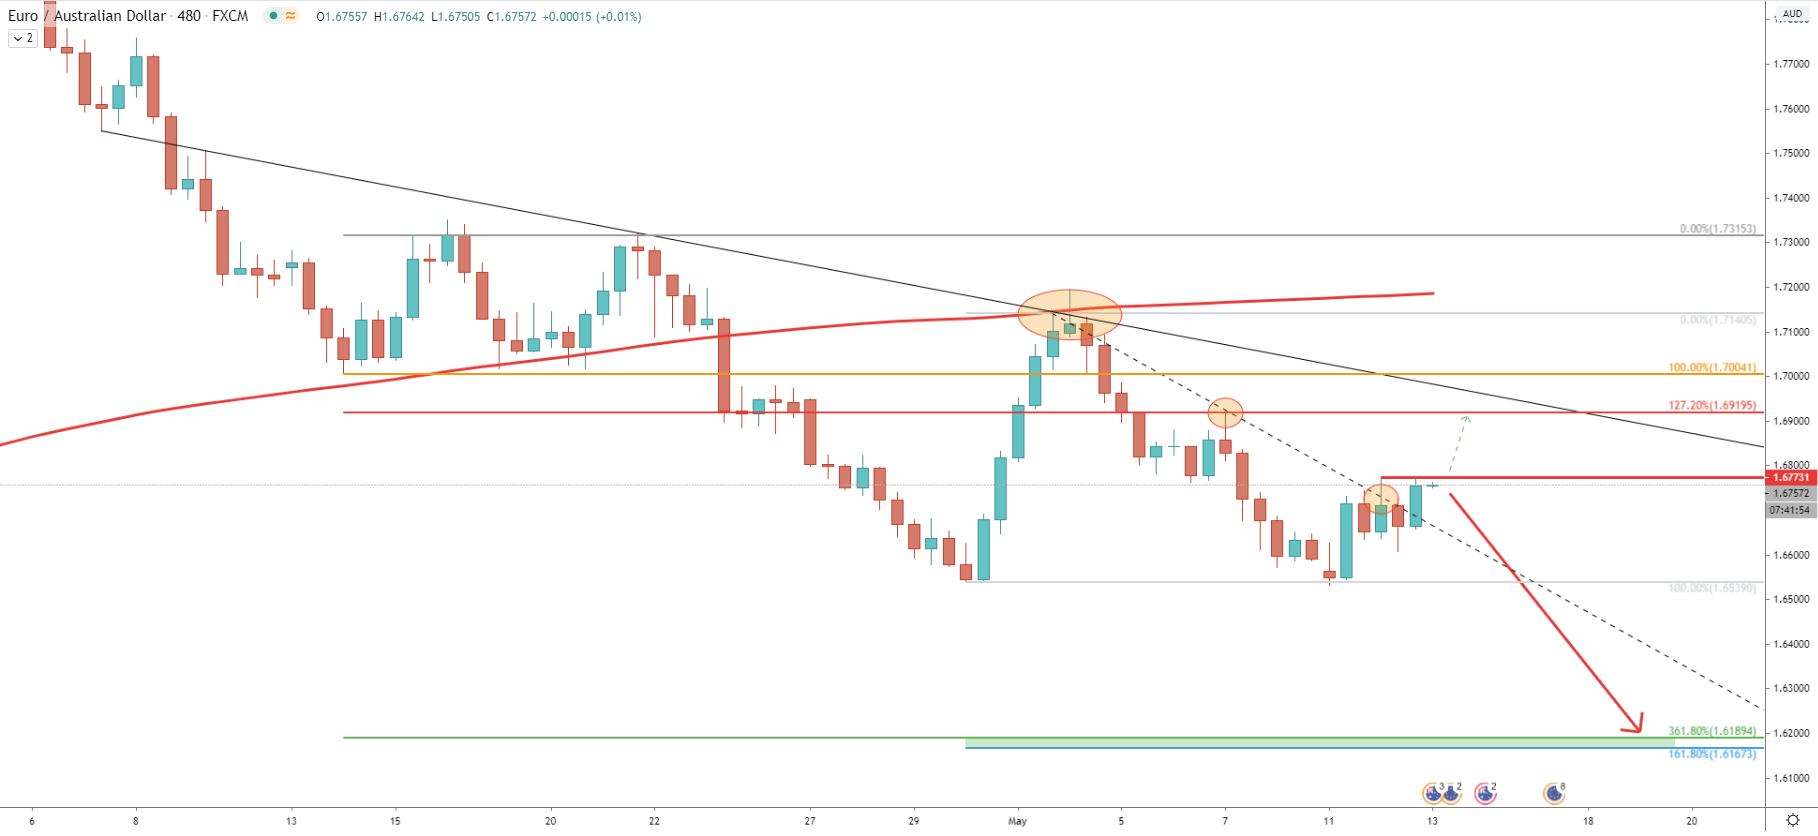
The 8H chart shows a rejection of the average-price downtrend trendline along with the 200 Simple Moving Average on May 4. Prior to that, there was another rejection of the trendline, back on April 21. Fibonacci applied to this correction shows that a 361.8% retracement level also corresponds to the 1.6200 downside target area. This could make it a key demand zone if it will be rejected and of course if EUR/AUD will be moving down as expected. Another point is the rejection of the smaller downtrend trendline on May 11. While there was a spike produced higher, the price failed to close above the spike, which means that the trendline is still being rejected and the short term downtrend is still valid.
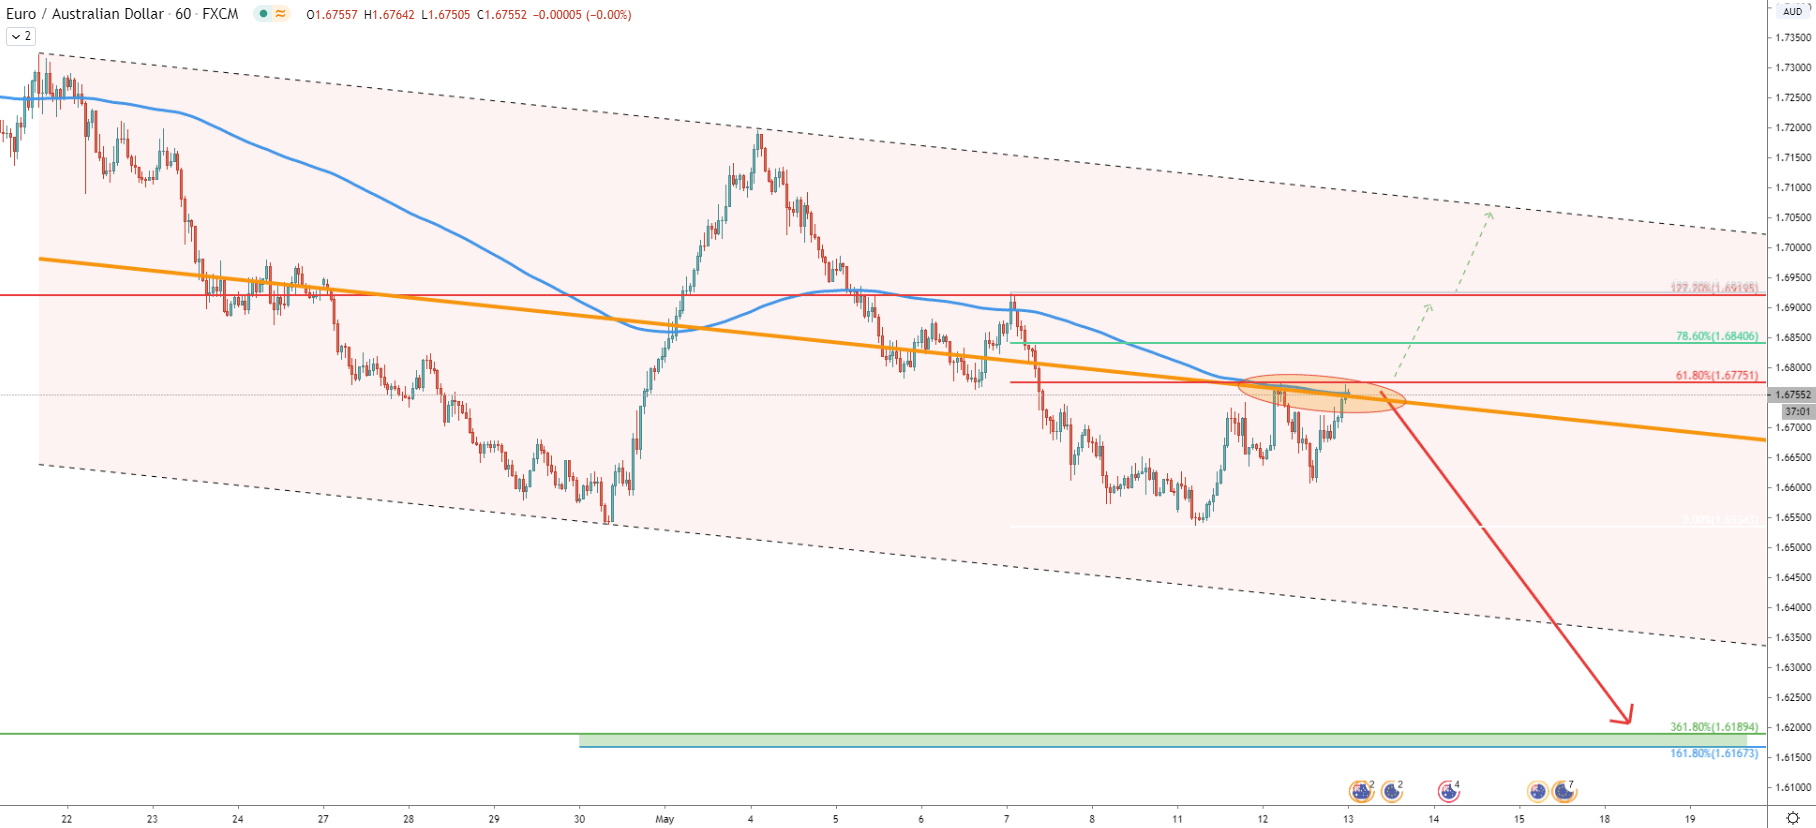
Moving on to the 1H chart, we can see that EUR/AUD is trading within a wide descending channel and currently price has reached and rejected the middle trendline of the channel for the second time. Simultaneously, the 200 EMA was rejected along with the 61.8% Fibonacci retracement level. This means, that 1.6775 is the key resistance to watch right now. Because if there will be no daily close above 1.6775, EUR/AUD will move down substantially.
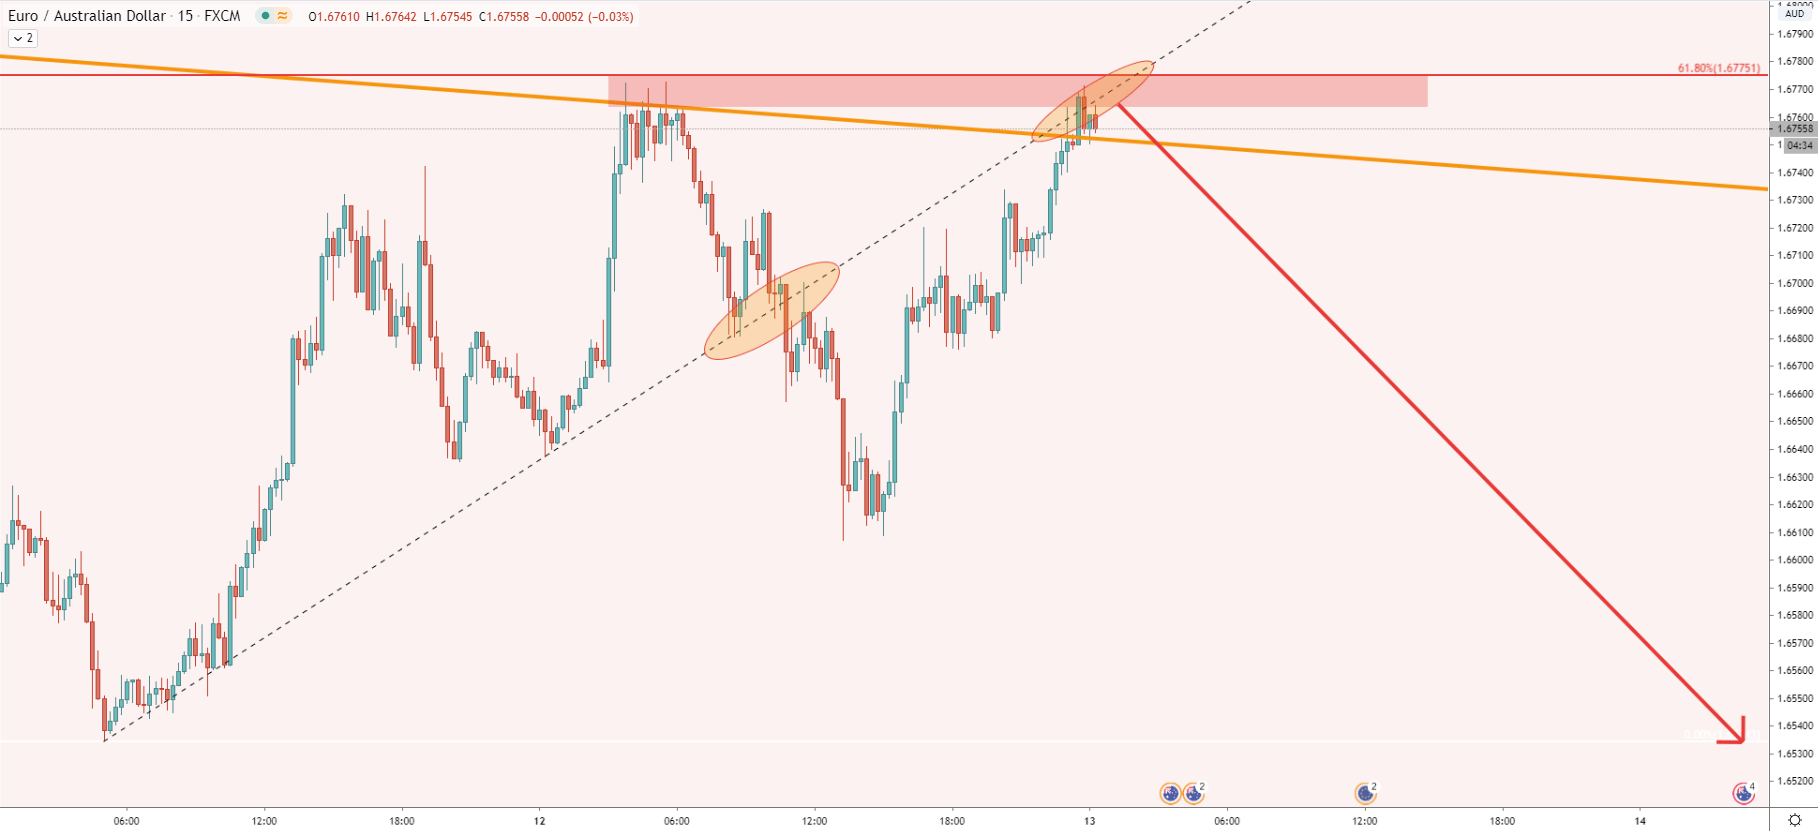
The 15M chart goes to show, that price has broken below the uptrend trendline after which it corrected up strongly. Nevertheless, this correction has ended when the pair approached the trendline, which is now acting as the resistance. What we might be witnessing, is a formation of the double top, which seems to be an ideal entry point for long term sellers. It is a very attractive price indeed, considering the potential for the price decline.
The EUR is struggling across the board, and EUR/AUD might reflect this weakness just perfectly. Price is currently at the resistance and if it holds, the potential decline could be as much as 500 pips.
We could spot only one key support are between 1.6200 and 1.6170. This area is confirmed by multiple Fibonacci retracement levels as well as the long term uptrend trendline.
As per the 1H chart, the key resistance is located at 1.6775, if this resistance will be broken, with a daily close above, more upside potential will be open. In this case, EUR/AUD should move towards 1.6840 or 1.6920. But an only daily break and close above the 1.6920 would completely invalidate bearish outlook and should result in a long term uptrend continuation.
Support: 1.6540, 1.6200, 1.6170
Resistance: 1.6775, 1.6840, 1.6920


