
Published: March 23rd, 2020
During the past 6 weeks, EUR/AUD has been in a steady uptrend. Perhaps to say just “steady” is to say nothing. It has been moving up like a tornado. In 1.5 months, pair has gained 23.08%, while moving from 1.6086 up to 11-year high at 1.9803. It was a massive 3712 pips growth within an extremely short period of time. But perhaps the price has topped out? Let’s have a look at a weekly chart.
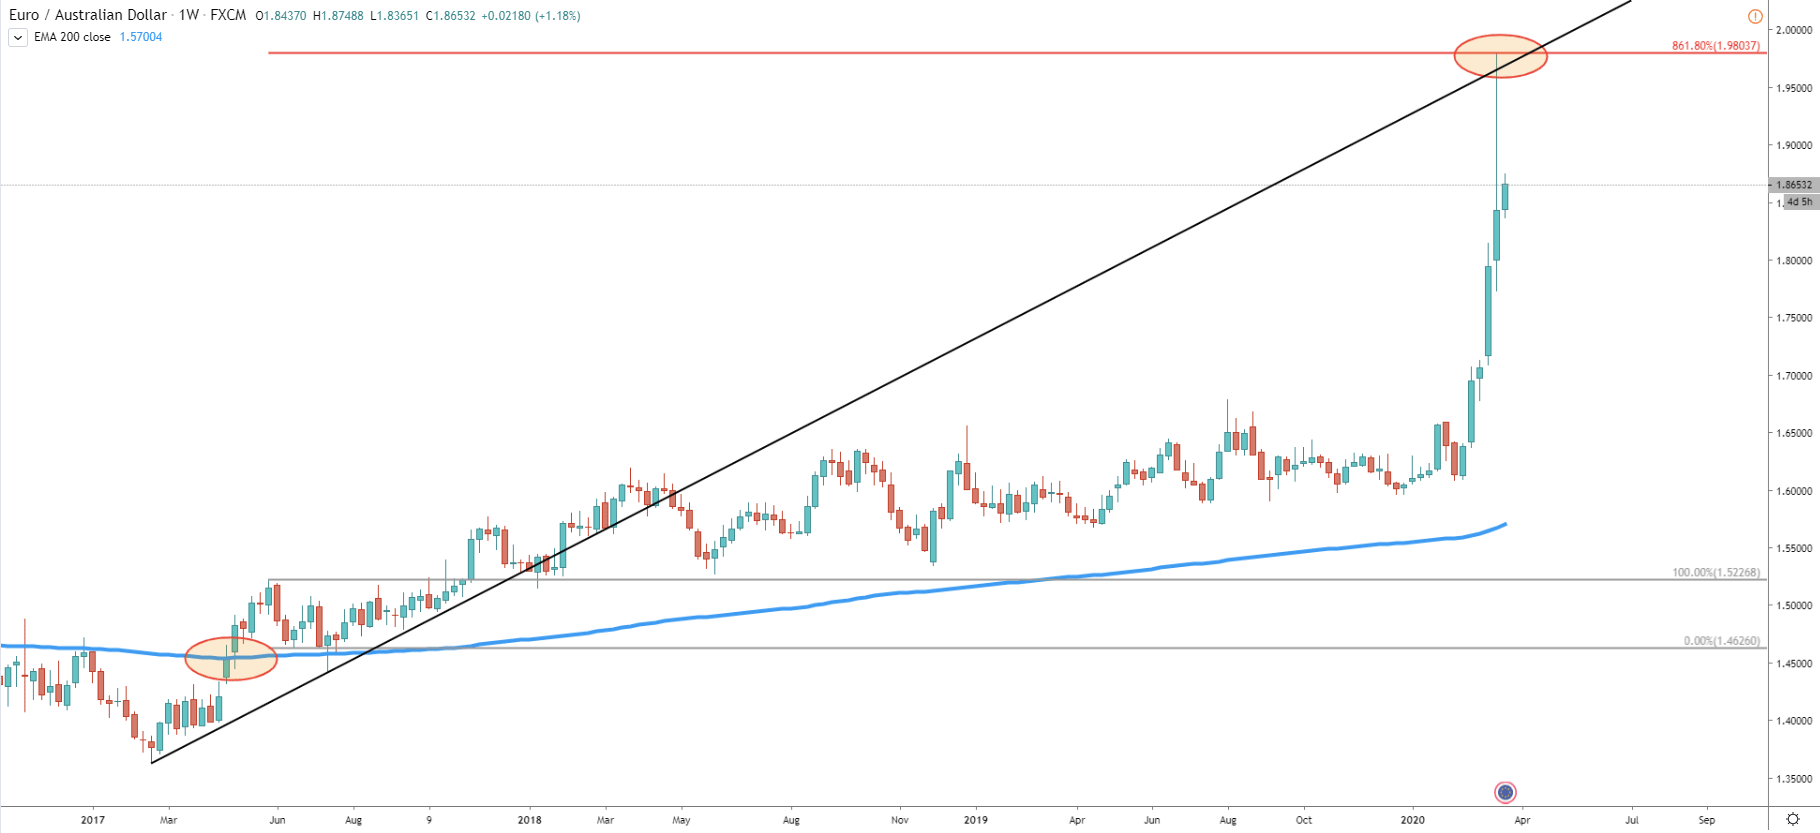
Fibonacci applied to the first corrective wave down after the breakout of 200 Exponential Moving Averages shows, that price has reached an 861.8% retracement level. This is 1.9803, which corresponds exactly with the high printed on March 19. This was a very precise bounce, which could either lead to a strong correction to the downside or even a trend reversal. At the same time, it is worth noting that EUR/AUD has reached and rejected the uptrend trendline, which is now acting as the resistance.
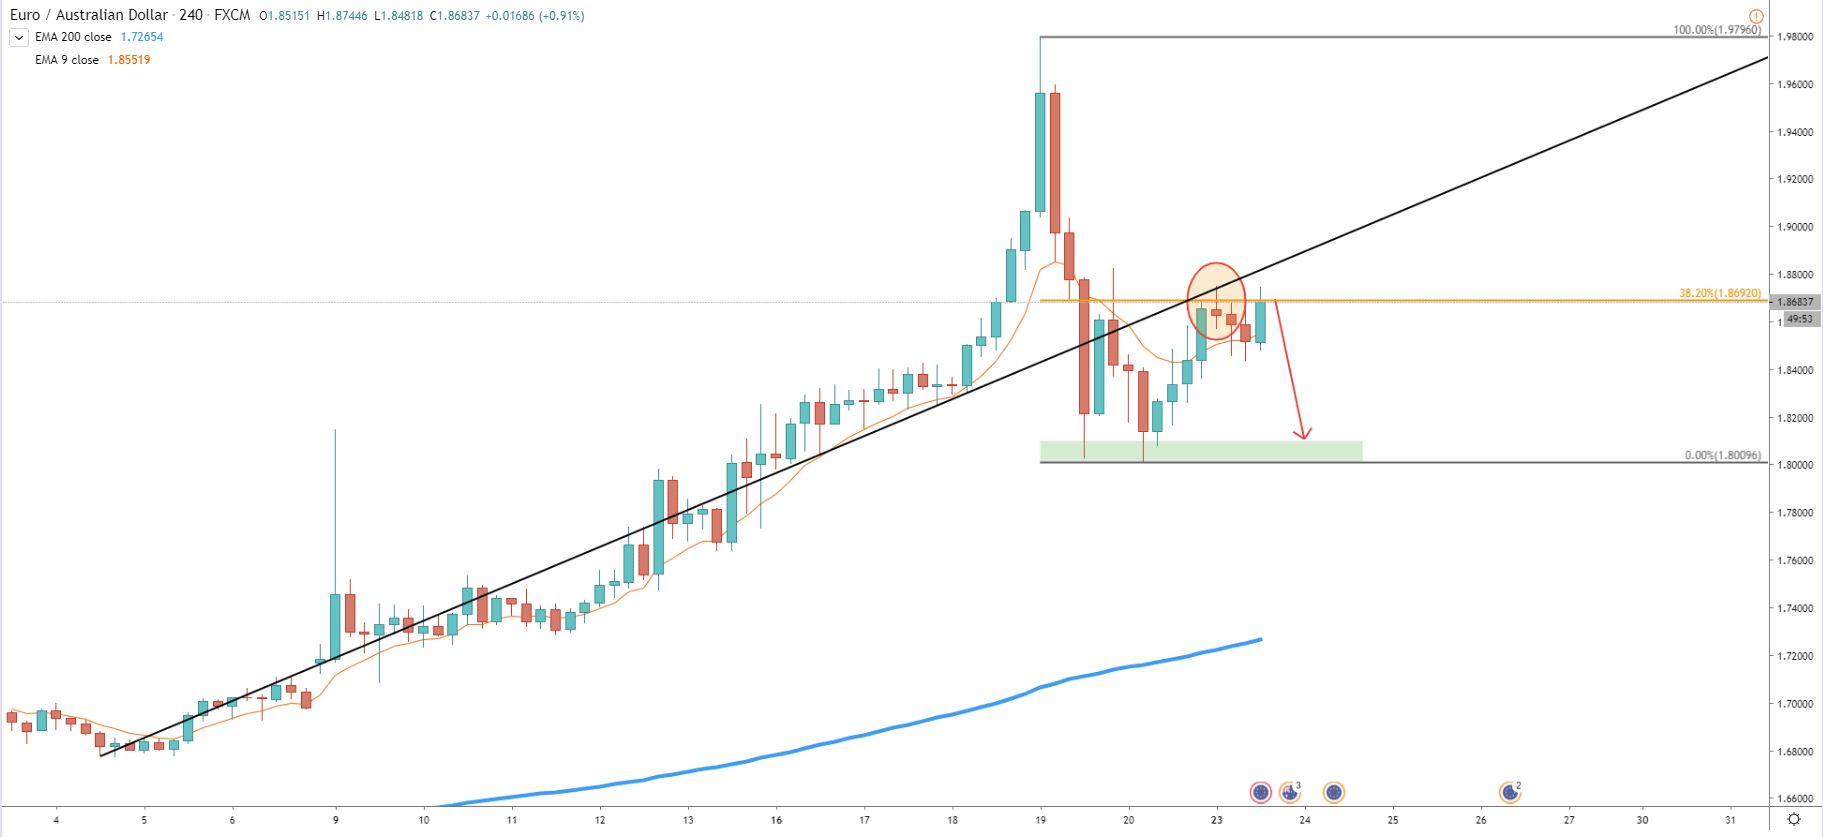
The uptrend trendline on the 4-hour timeframe has been broken on March 19, which is actually the same day when it produced a 11-year high. This shows how fast the price managed to bounce off the resistance and break the uptrend trendline at the same time. On March 23, the price has reached 38.2% Fibonacci retracement level at 1.8692. At first, it was rejected cleanly, but then price attempted to break higher. Nevertheless, it failed to close above the key resistance level and bounced off the uptrend trendline at the same time. This goes to show, that EUR/AUD might be getting weaker, where more and more sellers are joining the ride. This should result in a move down, perhaps to re-test the 1.8000 psychological support.
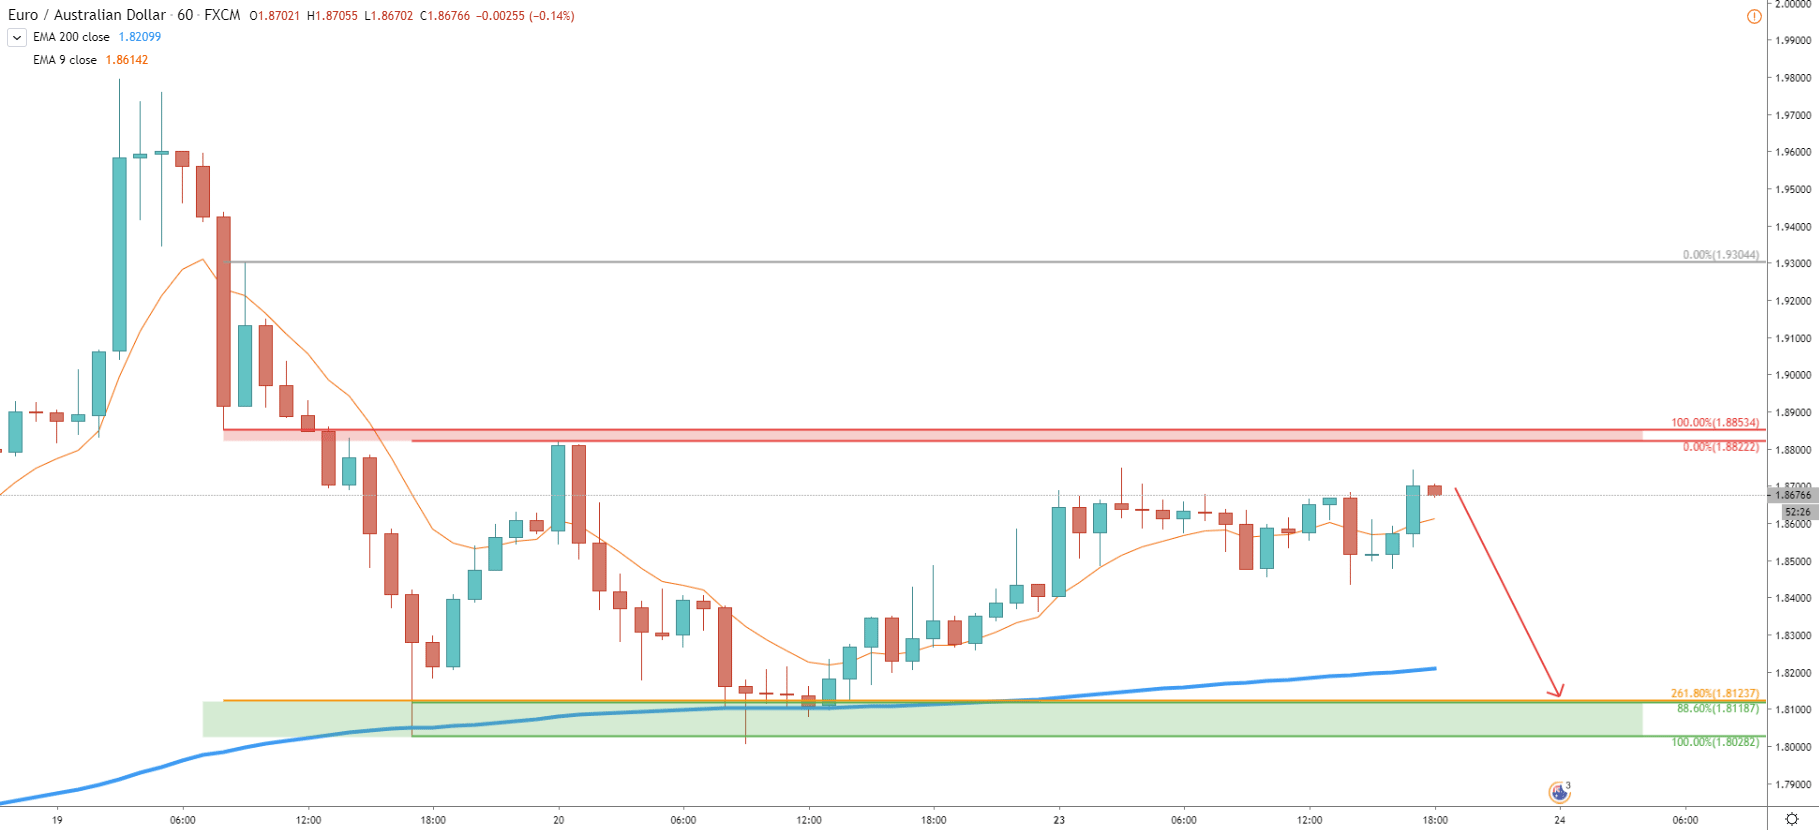
On the 1h chart, we can elaborate on the potential downside targets. Pair has rejected the 1.8000 area twice, along with the 200 EMA. Clearly, the resistance has been formed near 1.8850, where previously there was a support. Fibonacci applied to the corrective wave up after 9 EMA breakout shows, that there is a 261.8% Fibonacci retracement at 1.8120 area. It corresponds almost precisely to the 88.6% Fibs applied to the corrective wave up that occurred on March 19. It makes the area between 1.8028 and 1.8123 a strong demand zone, where the price is potentially aiming for.
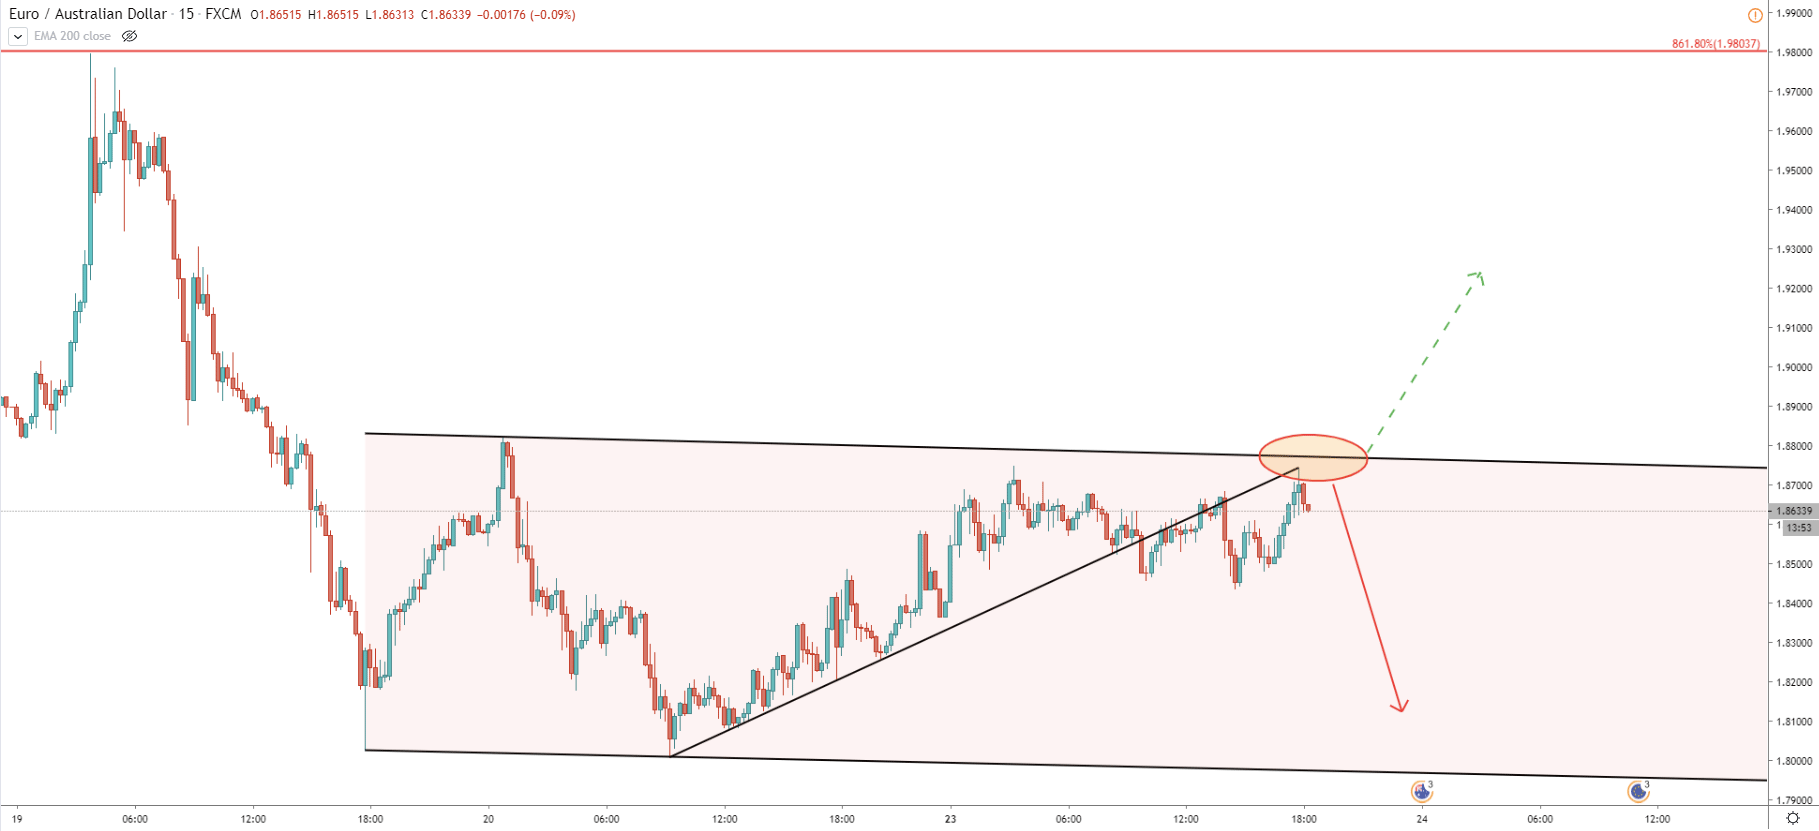
And just to see the lowest timeframe presented today, on the 15m chart, the price almost reached the upper trendline of the descending channel. EUR/AUD broke the uptrend trendline, then came back up and rejected this trendline, while producing a double top near 1.8745. So far, all facts are in favor of a corrective move down, unless price breaks and closes above the descending channel on the 4h timeframe.
After reaching an 11-year high at 1.9803, EUR/AUD could have topped out as the Fibonacci resistance has been rejected precisely. After that price has shown only signs of weakness, which should result in yet another wave down. It seems that there is a strong supply area near 1.8850, and if this price will be respected by the market, bears will take over.
There is only one key support level, which can be used as a downside target. As per the 1H chart, it is located at 1.8123 and confirmed by two Fibonacci retracement levels. Not to mention that it is a previous area of support, where pair produced a double bottom.
Obviously, the uptrend extremely strong and we must take into consideration, that going against the major trend is highly risky. But at the same time, the correction down would be quite healthy at this time. All-in-all, if price breaks above the 1.8850 resistance area, bearish outlook would be immediately invalidated and strong uptrend might continue.
Support: 1.8123, 1.8028, 1.8000
Resistance: 1.8750, 1.8822, 1.8853


