
Published: September 14th, 2020
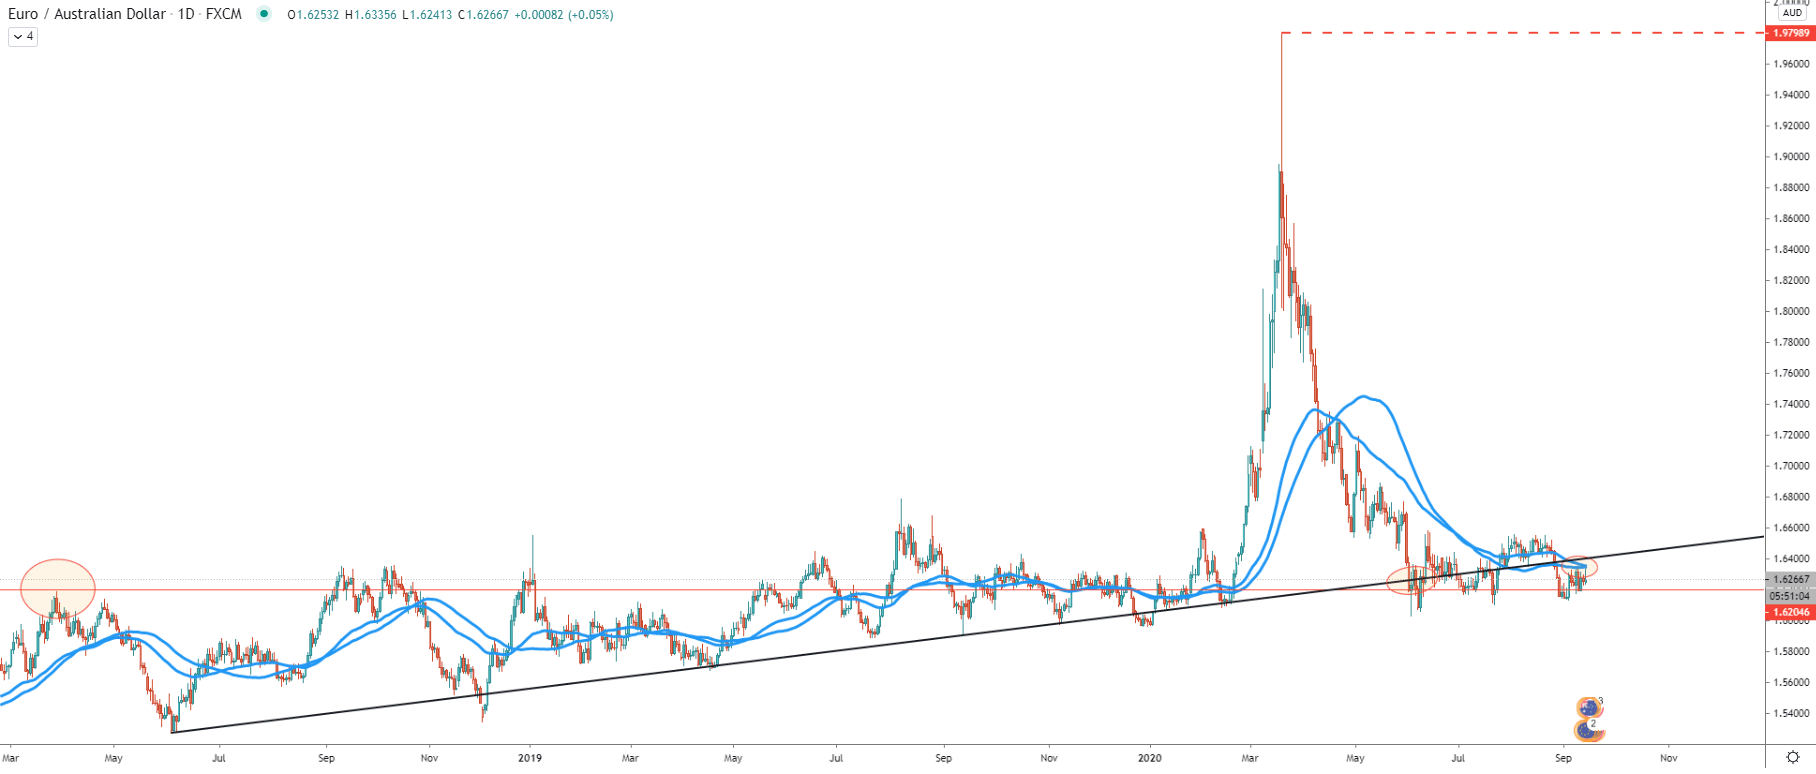
Starting with a daily chart it can be seen that trend remains bearish as the price continues to produce lower lows and lower highs. Besides price has broken below the downtrend trendline, signalling on the bearish domination.
After the breakout, there was a corrective move to the upside after which price has been consolidation for some time. But looking at the previous week price action, EUR/AUD has rejected both, 200 Simple and 200 Exponential Moving Average, which yet again validates the downtrend. The key support is seen near the 1.6200 psychological level, which previously acted as the resistance. Perhaps in the future, this level could play a very important role to show the probability of further price development.
If/when the price will reach and break below 1.6200 level on the daily timeframe, a massive downtrend can take place in the long run. But if it will get rejected, EUR/AUD might start to reverse to the upside.
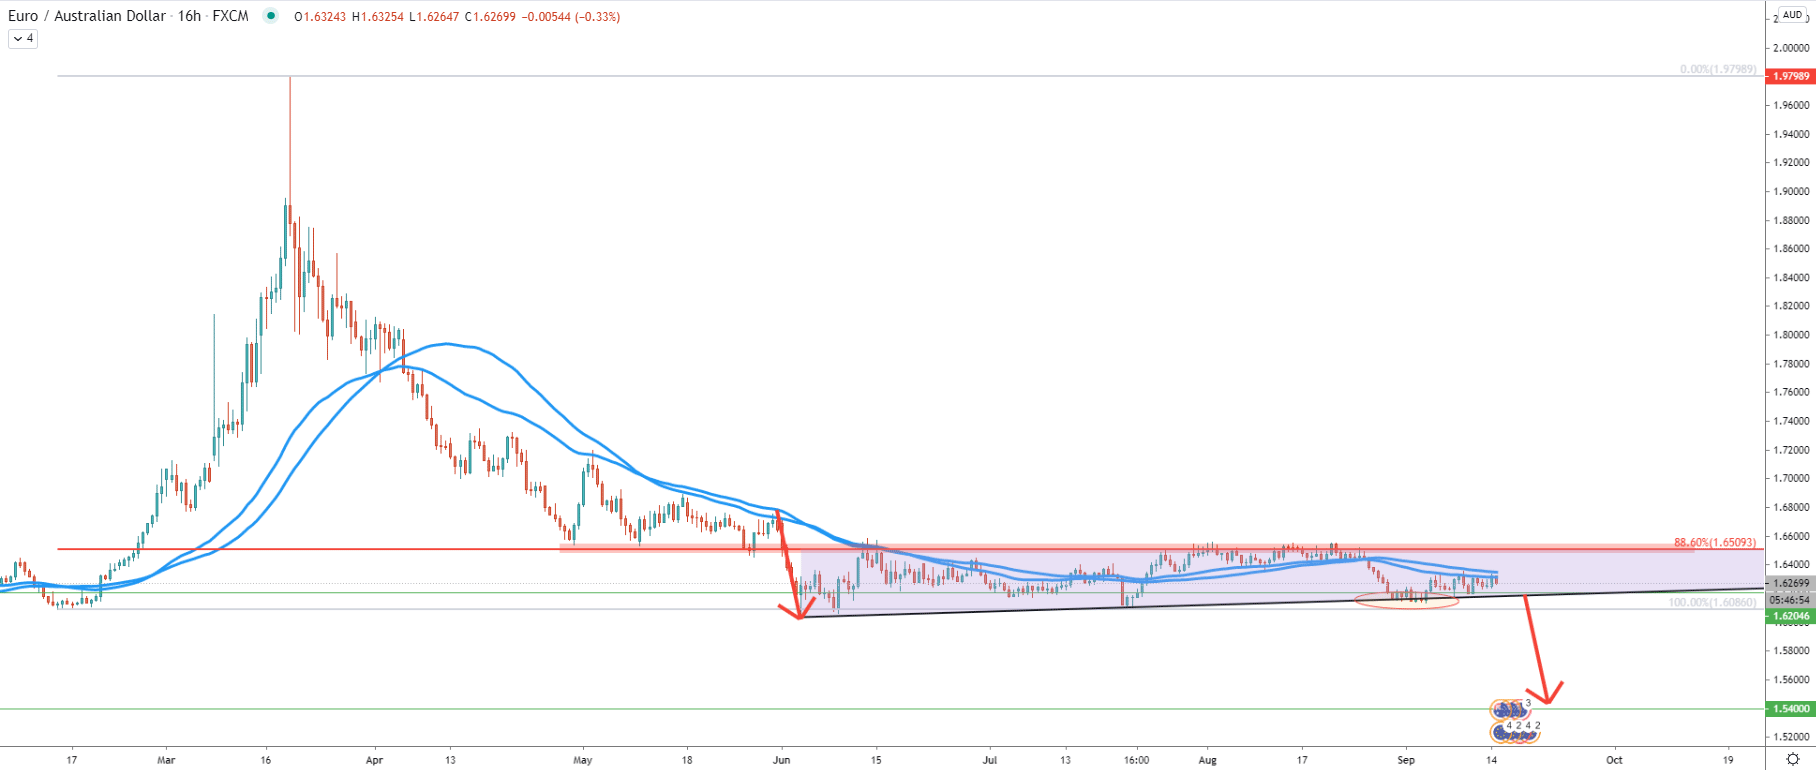
On this chart, we can see the formation of the triangle pattern. This formation must be watched very closely for the breakout in either direction. For now, the probability remains in favour of the downtrend, because the price has rejected 88.6% Fibs at 1.6509 on multiple occasions. Besides 50 SMA and EMA were also rejected just recently and the price remains below both of them.
Break and close below 1.6200 will confirm the triangle breakout which might result in a strong downtrend, with the final target being at 1.5400, which is 800 pips below the nearest support at 1.6200. Nonetheless, at this stage, there are still no confirmations that price will be diving that deep. 16200 remains the most important level to watch and can be tested within the next two weeks.
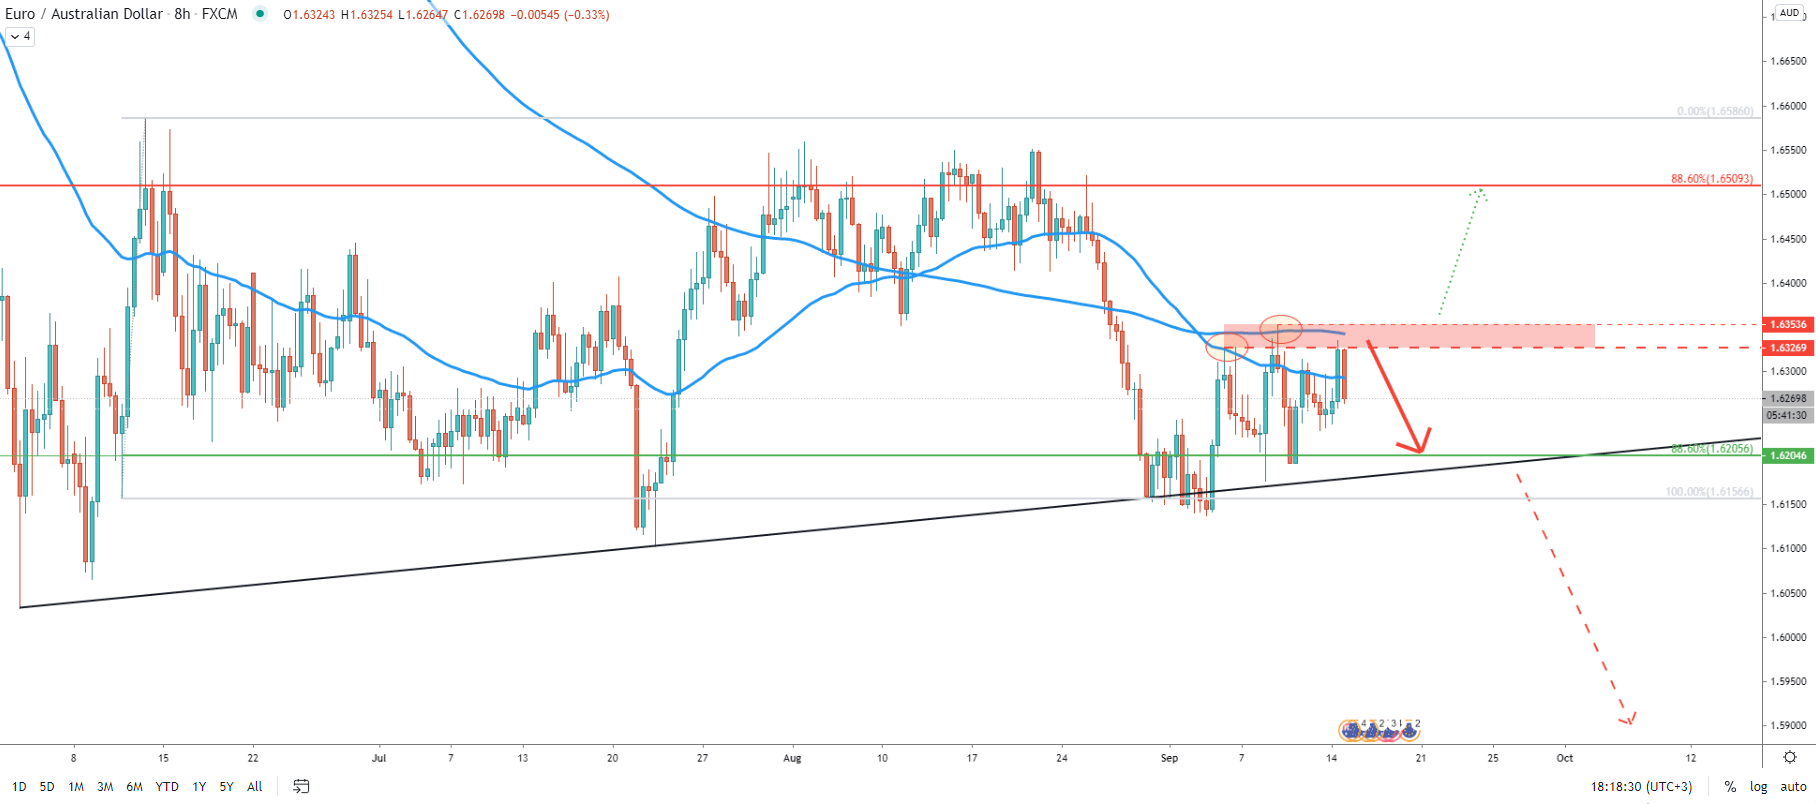
Clearly the resistance area is formed between the 1.6326 and 1.6353 levels. These are the levels where 200 and 50 EMAs were rejected though the last week. As long as daily closing price remains below 1.6353, the downtrend is imminent and another 150 pips decline can be expected at the very least. The 1.6200 psychological support is now confirmed technically, since 88.6% Fibonacci retracement level is right at 1.6205, and this is the closest downside target.
But if daily close will be above 1.6353, the bullish forecast will become much less probable and the downtrend could start turning into an uptrend. In this scenario, EUR/AUD is likely to move up, in order to test 1.6500 psychological resistance and the top of the triangle pattern once again.
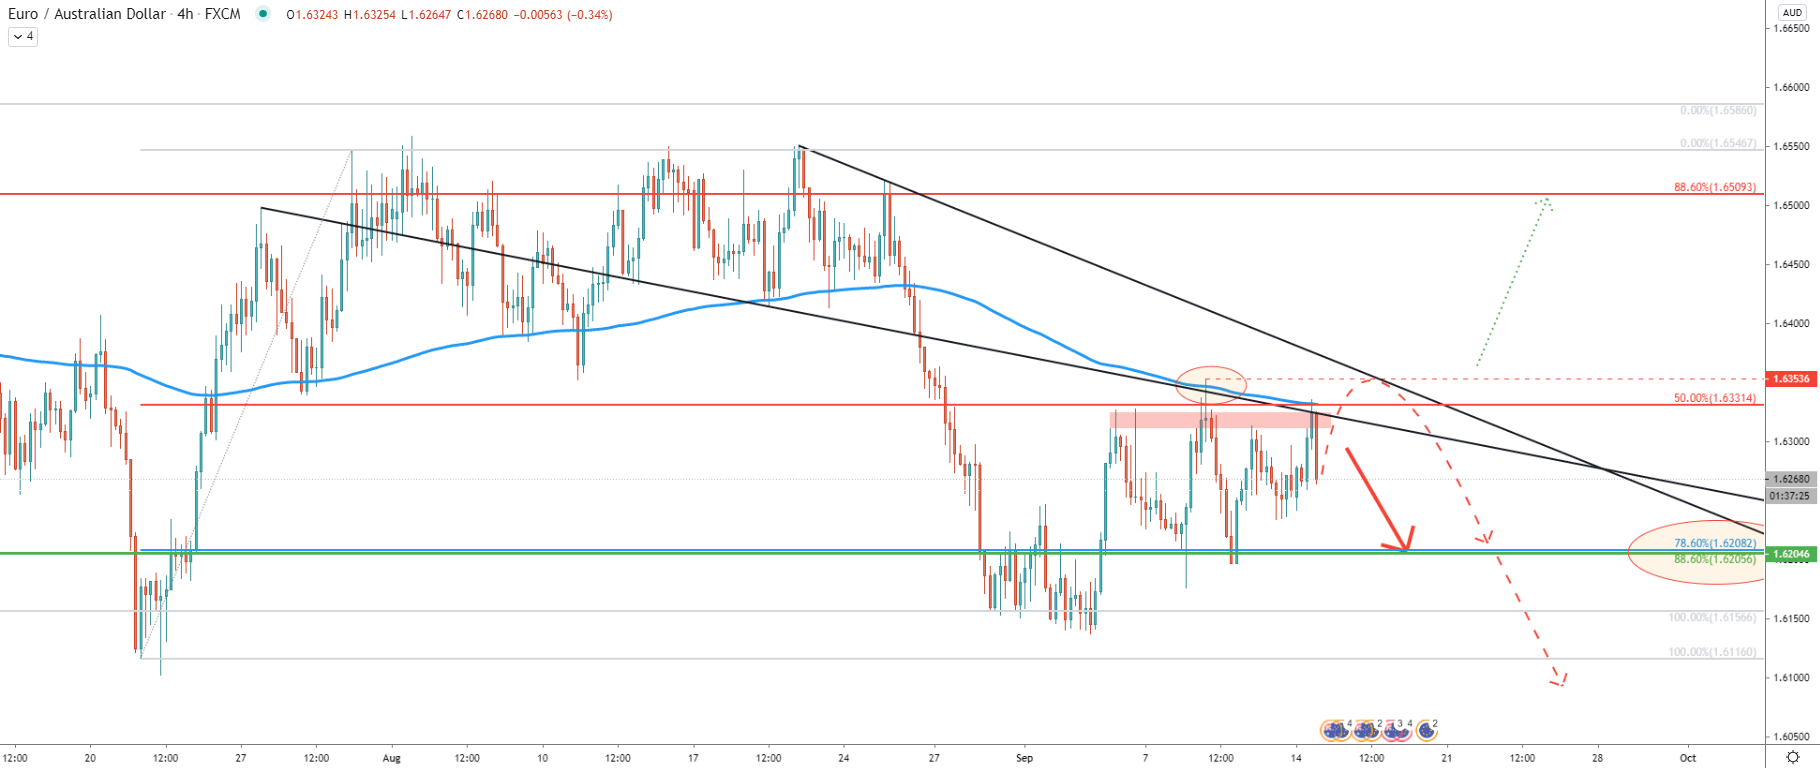
On the 4-hour timeframe price rejected 200 EMA and formed a strong resistance near 1.6330 level. EUR/AUD also rejected the average-price downtrend trendline, suggesting a continuation of the price decline. Although there could be an attempt to break to the upside, and this should result in price testing the downtrend trendline, before/if the price will continue to move lower.
Yet, the trend is bearish and on the 4h chart, we have the second technical confirmation of the downside support near 1.6200. It is now confirmed by 88.6% Fibs as per the 8-hour chart and 78.6% Fibs as can be seen on this chart.
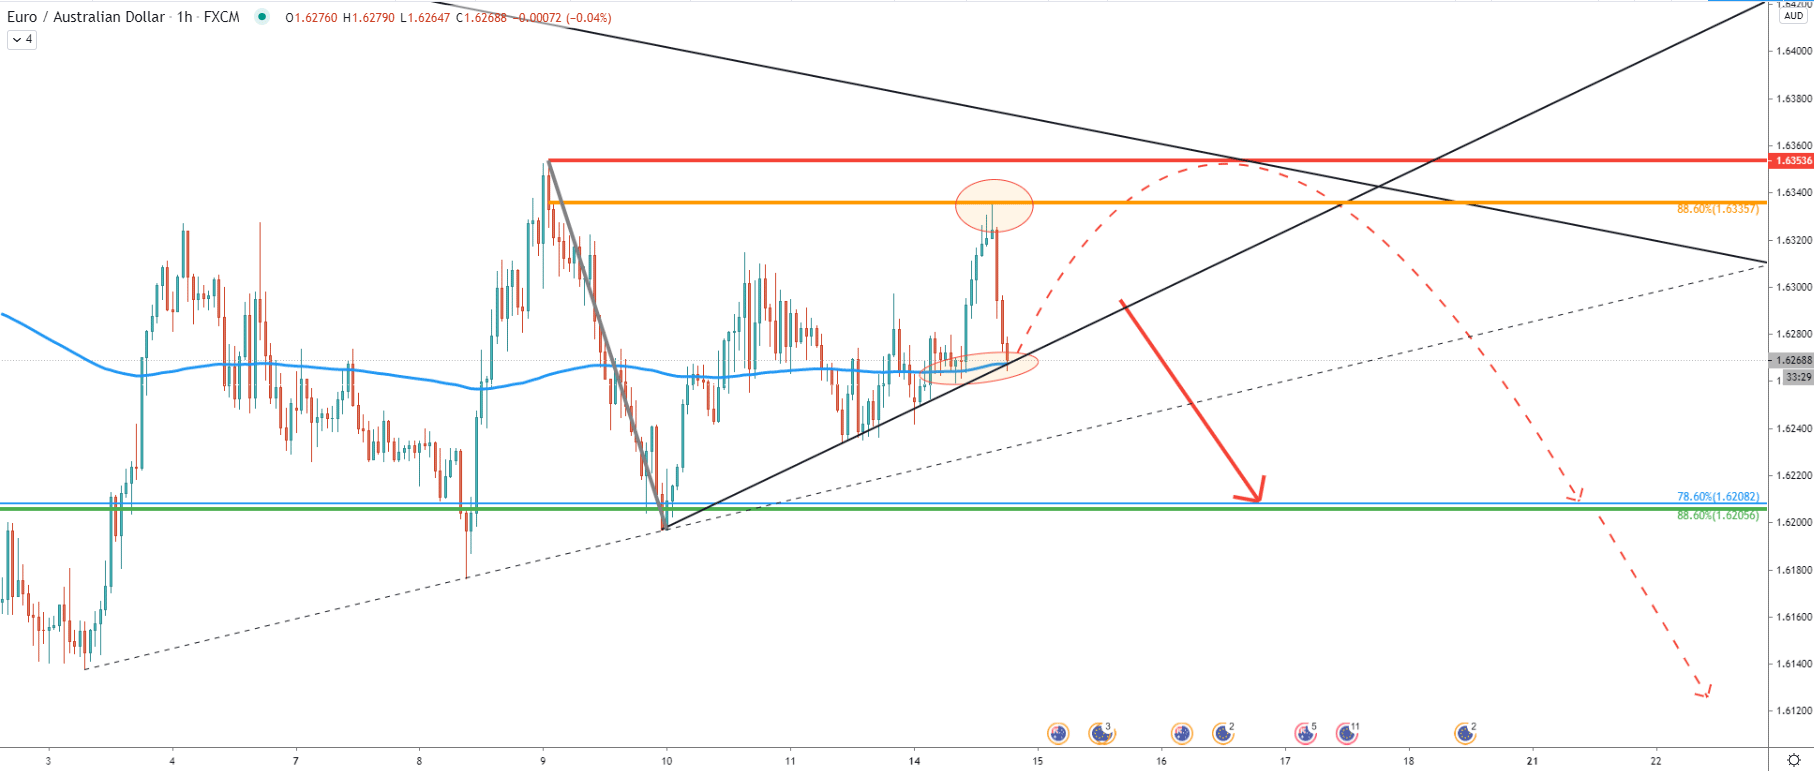
On the 1-hour chart, the alternative price decline is emphasised. This is because the 200 EMA is being rejected along with the uptrend trendline. It might suggest that price is not ready yet to move lower and the pullback up might take place. However, if the downtrend trendline will be broken, the decline should continue. Especially considering the fact that 88.6% Fibonacci resistance at 1.6335 was rejected very cleanly.
EUR/AUD long term trend remains extremely bearish, but there is one more key resistance level to be broken before the downtrend can be confirmed with greater confidence. All-in-all, another 150 pips drop in price is highly probable, but only as long as daily closing price remains below 1.6353.
While the downtrend can get massive, the nearest downside target is located at 1.6200 psychological support area, which is confirmed by two Fibonacci retracement levels as per the 8-hour and 4-hour charts.
The only way price should be expected to reverse to the upside, is upon daily break and close above 1.6353 level. In this scenario, bearish forecast will get completely invalidated and EUR/AUD trend reversal can take place.
Support: 1.6205, 1.5400
Resistance: 1.6331, 1.6353, 1.6509


