
Published: August 11th, 2021
The broader cryptocurrency market crashed as soon as China initiated new restrictions on crypto payment providers. As a result, Bitcoin dropped to $30,000 level while Ethereum dropped by half throughout summer to $1730 low.
After that, the price rebounds with positive sentiment from the crypto profitability regarding mining. Moreover, the boom in the price is influenced by the US playmakers to consider a tight policy regarding digital assets. Moreover, the GPU shortage with the London fork may keep the market volatile for Ethereum.
Overall, the rising price in the cryptocurrency market and declining profitability in the mining sector would be a good opportunity for enthusiasts. In that case, Ethereum has more room for upside to show bullish momentum.
Let’s see the upcoming price direction from the Ethereum technical analysis:
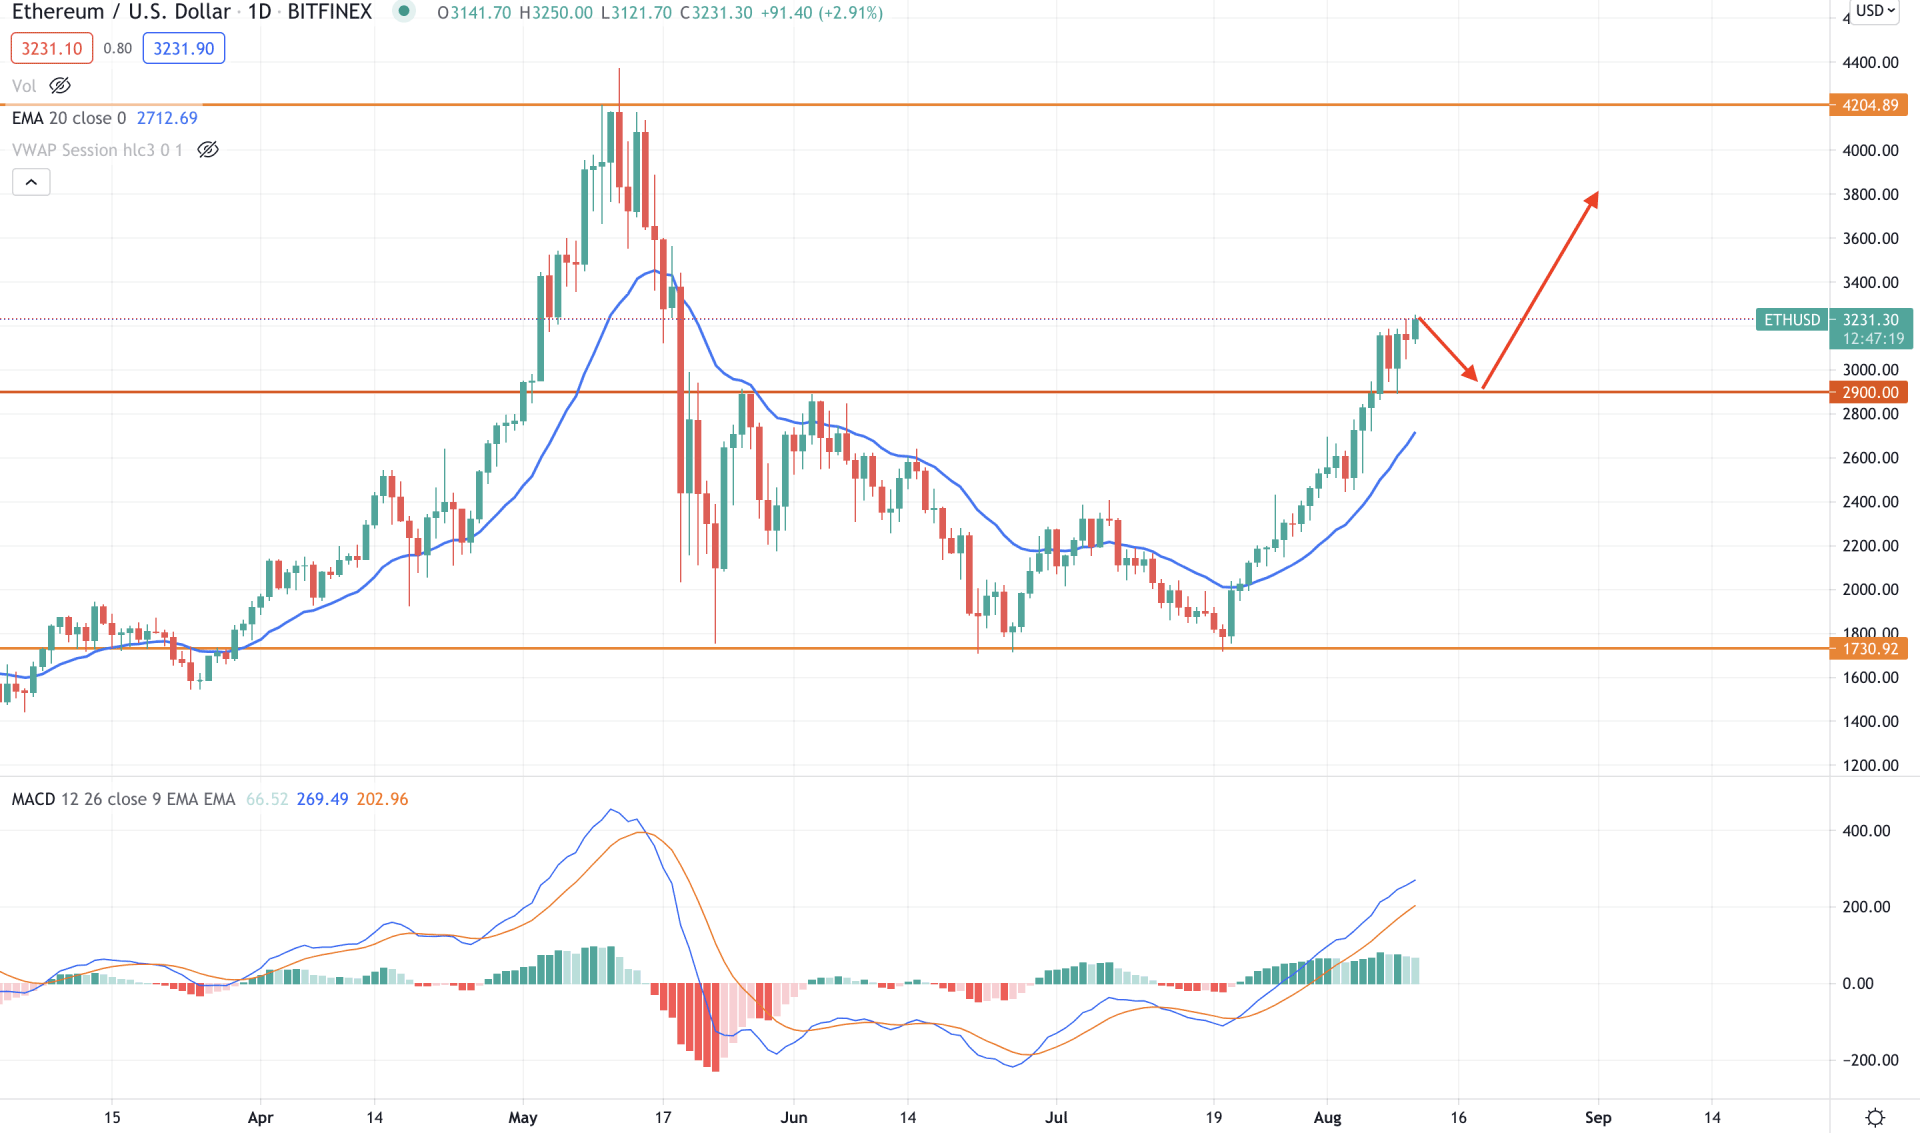
Ethereum spiked higher above 4000 US Dollars per Ether in May 2021 as a part of the post-pandemic recovery. However, later on, the price crashed with the negative sentiment from China regarding the crypto payment and environmental concerns. Therefore, Ethereum moved down to the 1730 level but failed to break below it. As a result, this month, the price moved above the 2900 event level with a bullish daily close, creating a further bullish possibility for the coming days.
The above image shows that Ethereum moved above the dynamic 20 EMA that supported the price while breaking above the 2900 level. Moreover, in the indicator window, MACD Histogram remained bullish for a considerable time, an indicator of active buyers’ presence in the price.
In this context, the price may come lower as a correction, but the bullish possibility is valid as buyers hold the price above dynamic 20 EMA.
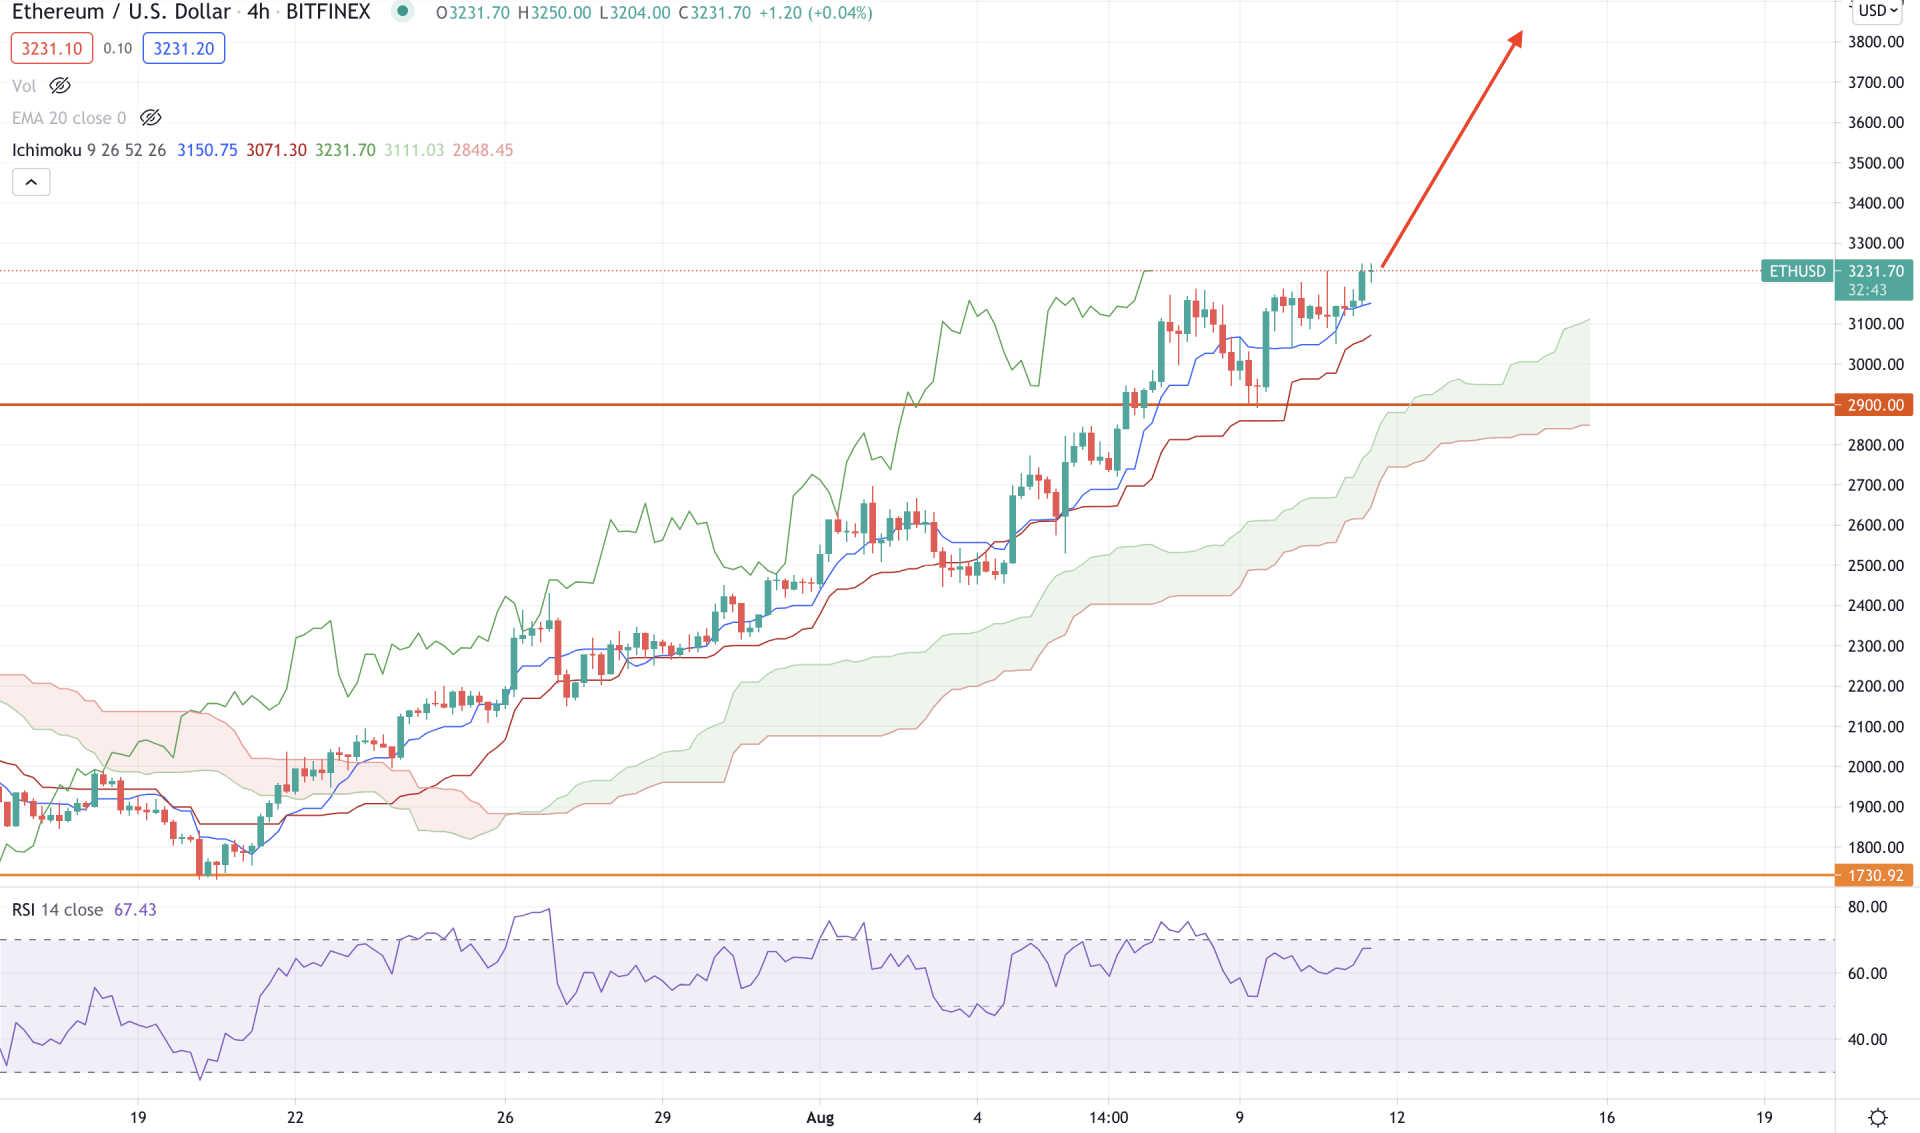
According to the Ichimoku Kinko Hyo, Ethereum is moving within an intense buying pressure initiated with a bullish breakout above the Kumo Cloud. The future cloud remained wide where Senkou Span A remained above Senkou Span B. Moreover, the Chikou Span is above the price and aiming higher.
In the above image, we can see that the price is getting support from the dynamic Tenkan Sen and Kijun Sen. Moreover, Tenkan Sen is above Kijun Sen, indicating that short-term buyers are active in the price.
RSI is near 80 levels in the indicator window, pointing out that the price faces extreme bullish pressure. Therefore, any minor correction towards dynamic Kijun Sen may boost the buying pressure towards the 4000 level. However, a bearish H4 close below the 2900 event-level may alter the current price direction and lower the price towards the 2400 area.
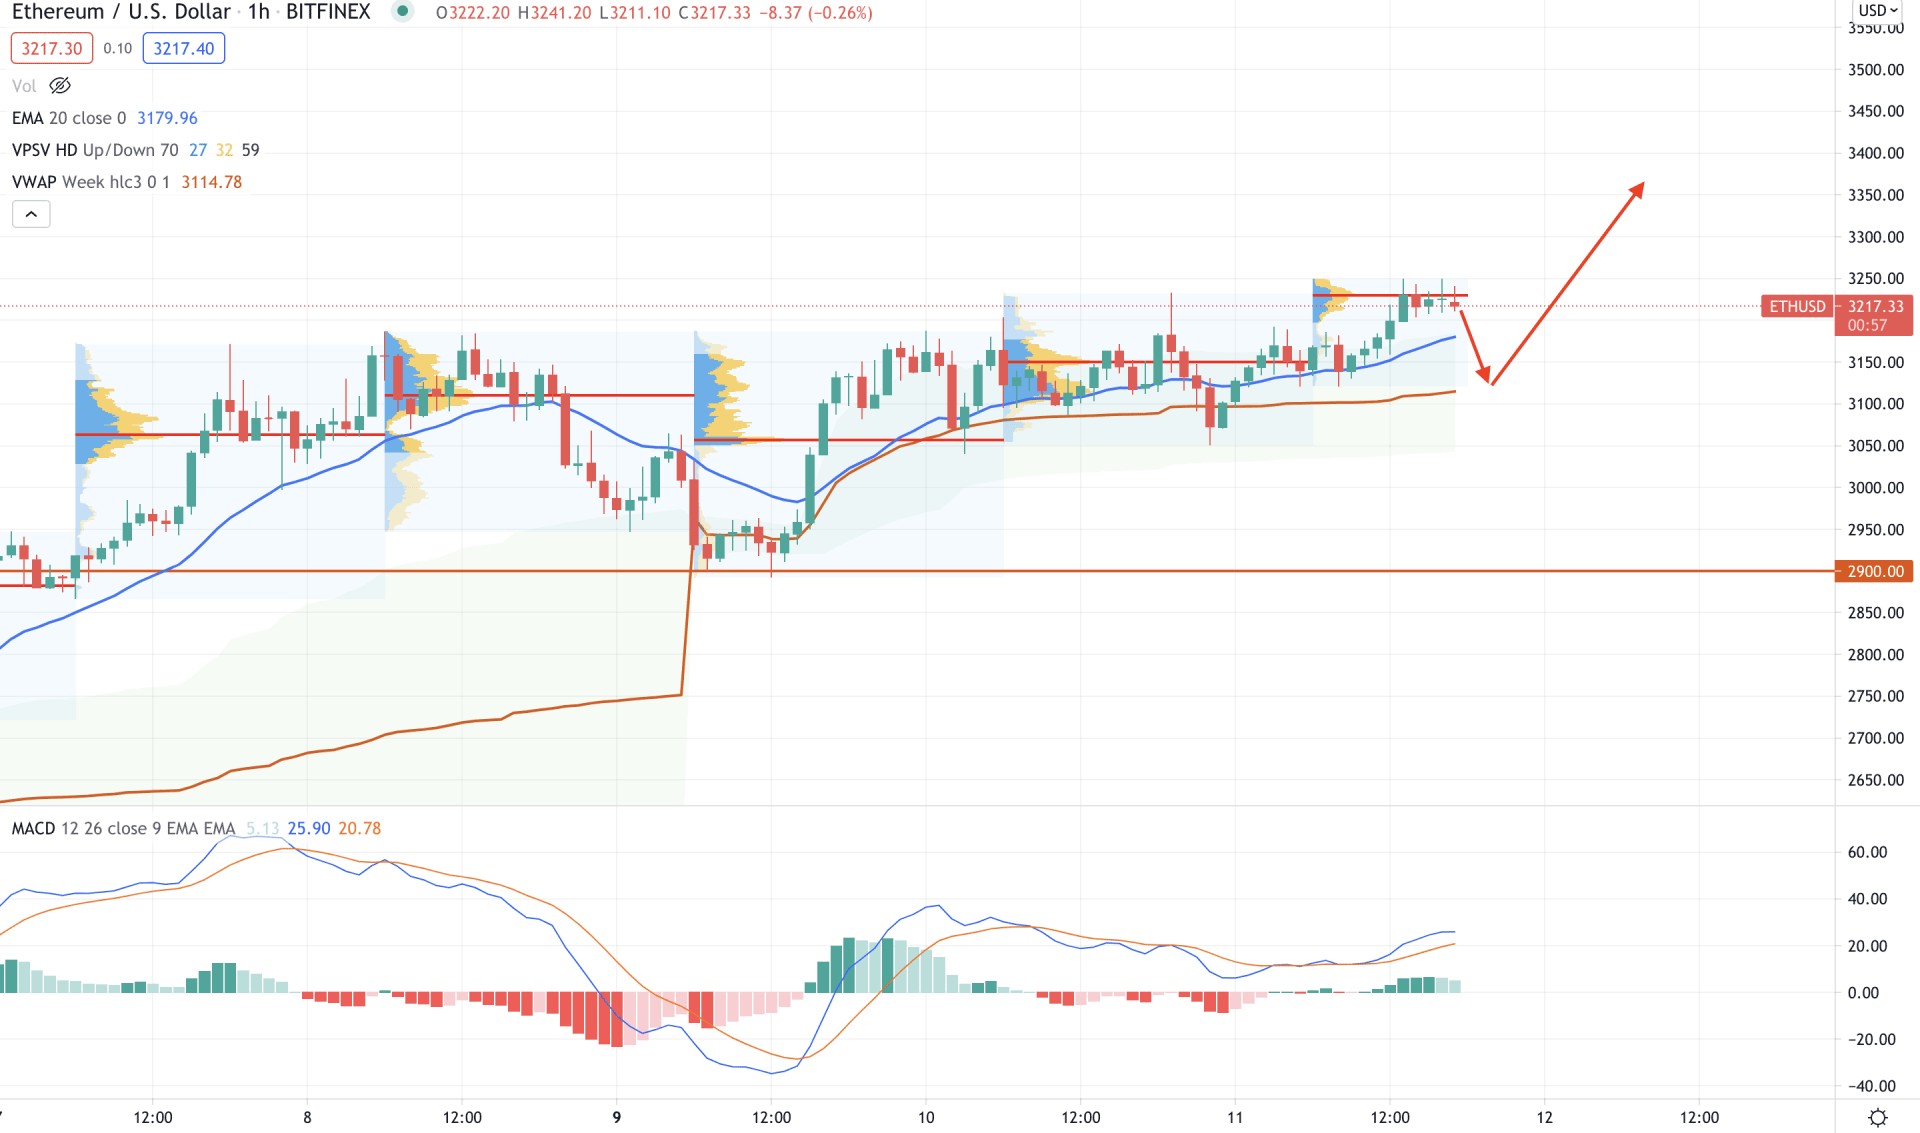
In the intraday chart, Ethereum is moving up with a corrective speed. However, the price remained stable above the 2900 event level and dynamic 20 EMA. Therefore, as long as the price is trading above the 2900 level, it is more likely to continue the bullish pressure in the coming session.
In the indicator window, MACD Histogram remained bullish as it is above the zero lines. Therefore, the buying possibility may become stronger until the MACD Histogram moves below zero levels.
In the most recent chart, the price tried to break above the intraday high volume level of 3232.01 but failed. Therefore, it may correct lower towards dynamic vwap level before moving higher. In that case, any rejection from the 3100 level may resume the current buying pressure towards the 4000 level. On the other hand, a break below the 2900 level may invalidate the current sentiment and lower the price towards the 2400 area.
As per the current market scenario, Ethereum is more likely to continue the bullish pressure towards the 4000 level. In that case, any rejection from the intraday dynamic level may increase the buying possibility.
On the other hand, the alternative approach is to wait for a break below the 2900 support level with a bearish H4 close, which may lower the price towards the 2400 level.


