Published: May 4th, 2021
Cryptocurrency investment has surged over the past years that pushed Bitcoin to test the record high. Moreover, Bitcoin is famous among investors due to its store in value that is effective against the inflation hedge.
However, the scenario is different for Ethereum. Despite the store in value, Ethereum is used by developers to build apps. Ethereum is a network under the blockchain technology where Ether is the cryptocurrency that provides power to the platform. Therefore, with the increase in Decentralized finance, Ethereum is becoming a compulsory way for developers and investors. Ethereum gained more than 300% in 2021 compared to Bitcoin’s 100% gain.
The significant bullish pressure in Ethereum came as soon as the European Investment Bank issued digital bond sales through the Ethereum blockchain network. Therefore, as long as positive investment news is coming, Ethereum is becoming an attractive investment opportunity among investors. But can Ethereum price move higher towards the $4,000 level? Let’s find the upcoming price direction from the Ethereum Stock technical analysis!

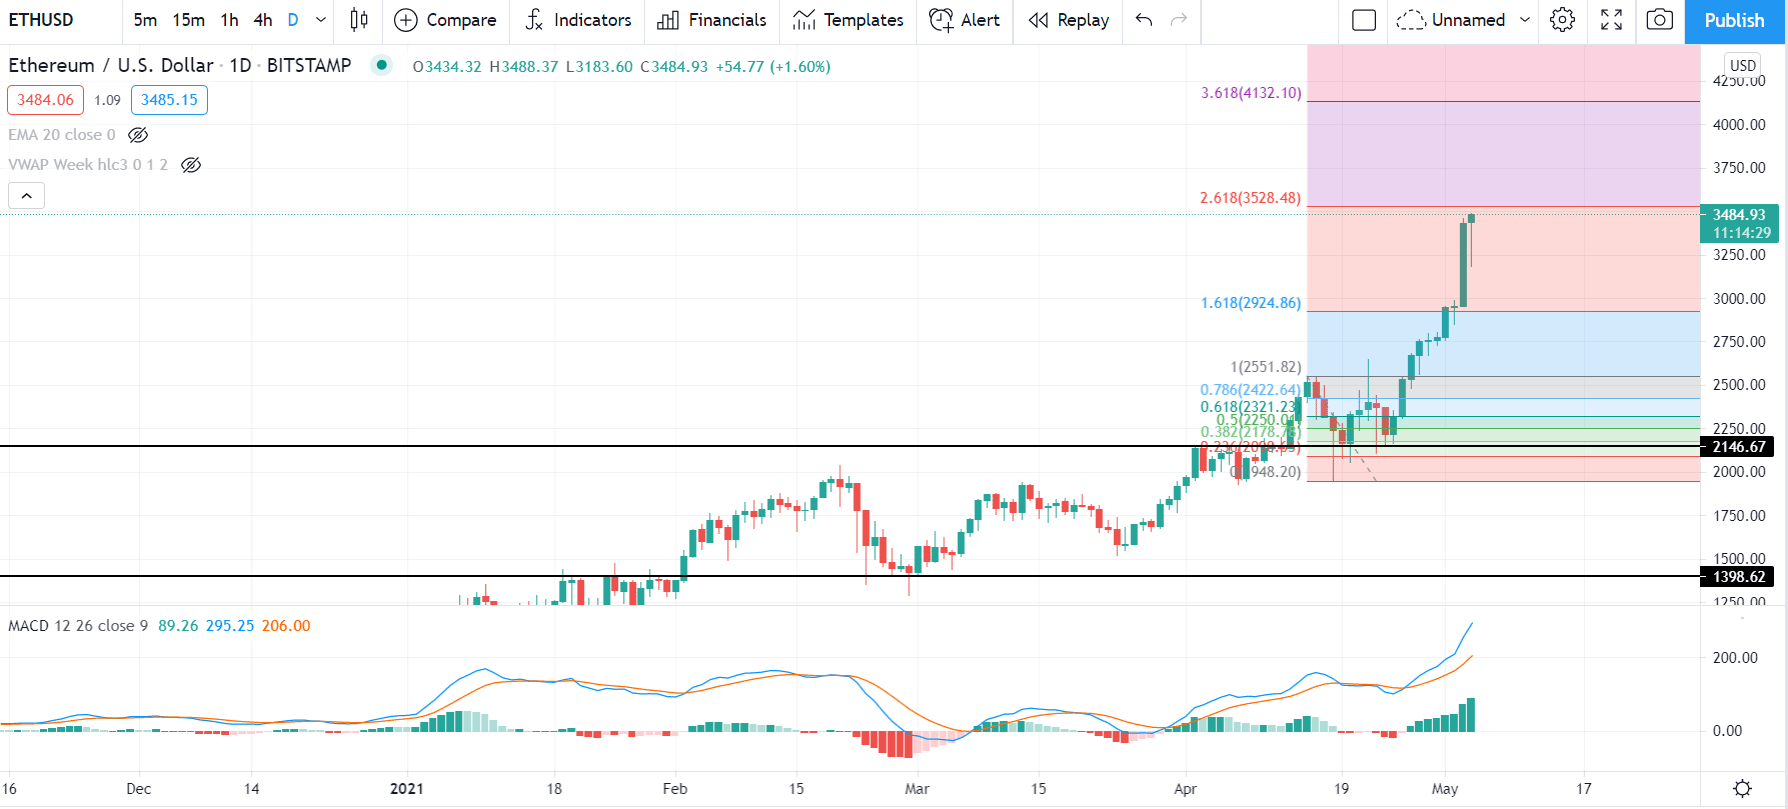
Ethereum is pushing higher as soon as the price rejected the $2,146 event level. After that, the price corrected lower but failed to sustain below the $2,146 level. As a result, the price moved higher with an impulsive bullish pressure towards the all-time high near the $3,500 area.
If we consider the recent bearish movement from 16 April to 21 April, we would see that the price already moved above the 161.8% Fibonacci Extension level and heading towards the 261.8% Fibonacci level at the $3511.46 area.
As the price is very impulsive, investors should wait for a correction to join the bullish rally. In that case, the primary reversal point would be the $3511.46 level and $4091.36 level. If the daily candle closes above the $3500 level, it may move higher towards the next psychological level of $4000.
Conversely, if the price failed to break above the $3500 level with a daily close, investors should wait for a strong bearish daily candle with a considerable correction. In that case, the primary target would be the $2550 level, from the bullish rally may continue.

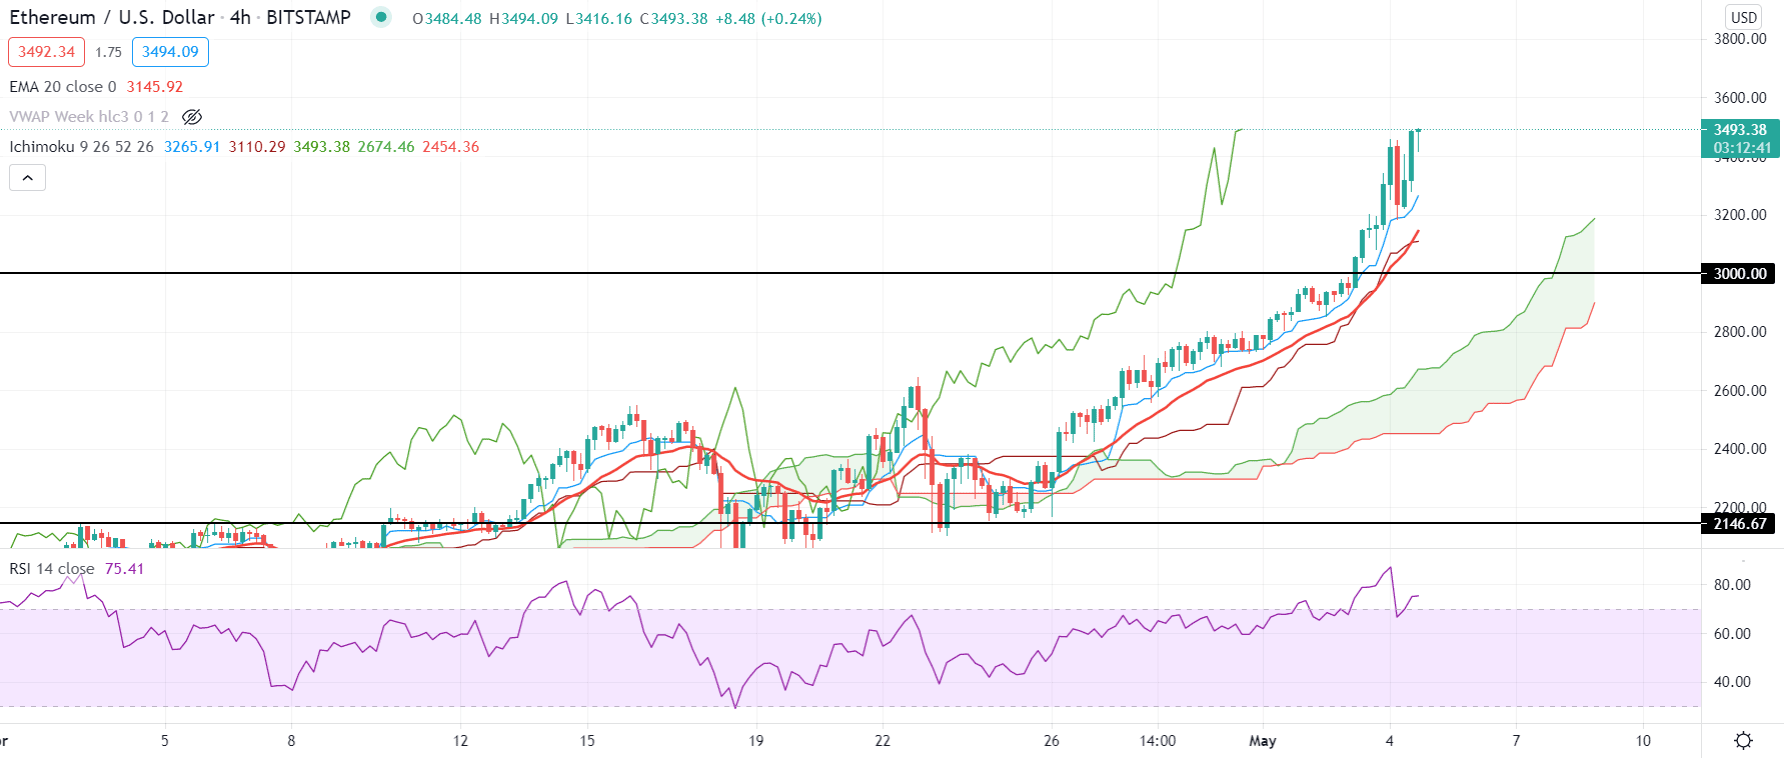
In the H4 timeframe, the Ichimoku Cloud is pointing up to where the Seknou Span A is above the Senkou Span B. it is an indication that the price is moving with a strong bullish trend. However, there is a gap between the current price and dynamic levels that has expanded. Therefore, a correction is pending towards the Dynamic Tenkan Sen and 20 EMA as mean reversion.
We can see that the price moved higher above the psychological $3000 level with an impulsive bullish pressure in the above image. Later on, the price came lower and tested the Tenkan Sen before making another swing high. As the current trend runs with impulsive pressure, investors should wait for a reliable price direction to enter the trade.
The Dynamic 20 EMA and Kijun Sen are below the price, and there is a possibility of gravitational force towards the downside. In that case, if the price reached $3511.45, which is the 161.8% Fibonacci Extension of the recent correction. In that case, investors should find a strong bearish h4 close below the Tenkan Sen with the target at Kijun Sen Support.
On the other hand, as the current market structure is bullish, any daily cable above the $3500 level may increase the bullishness of the price. Besides, RSI has already tested the 80 levels and heading downwards, indicating that the price already tested the overbought level.

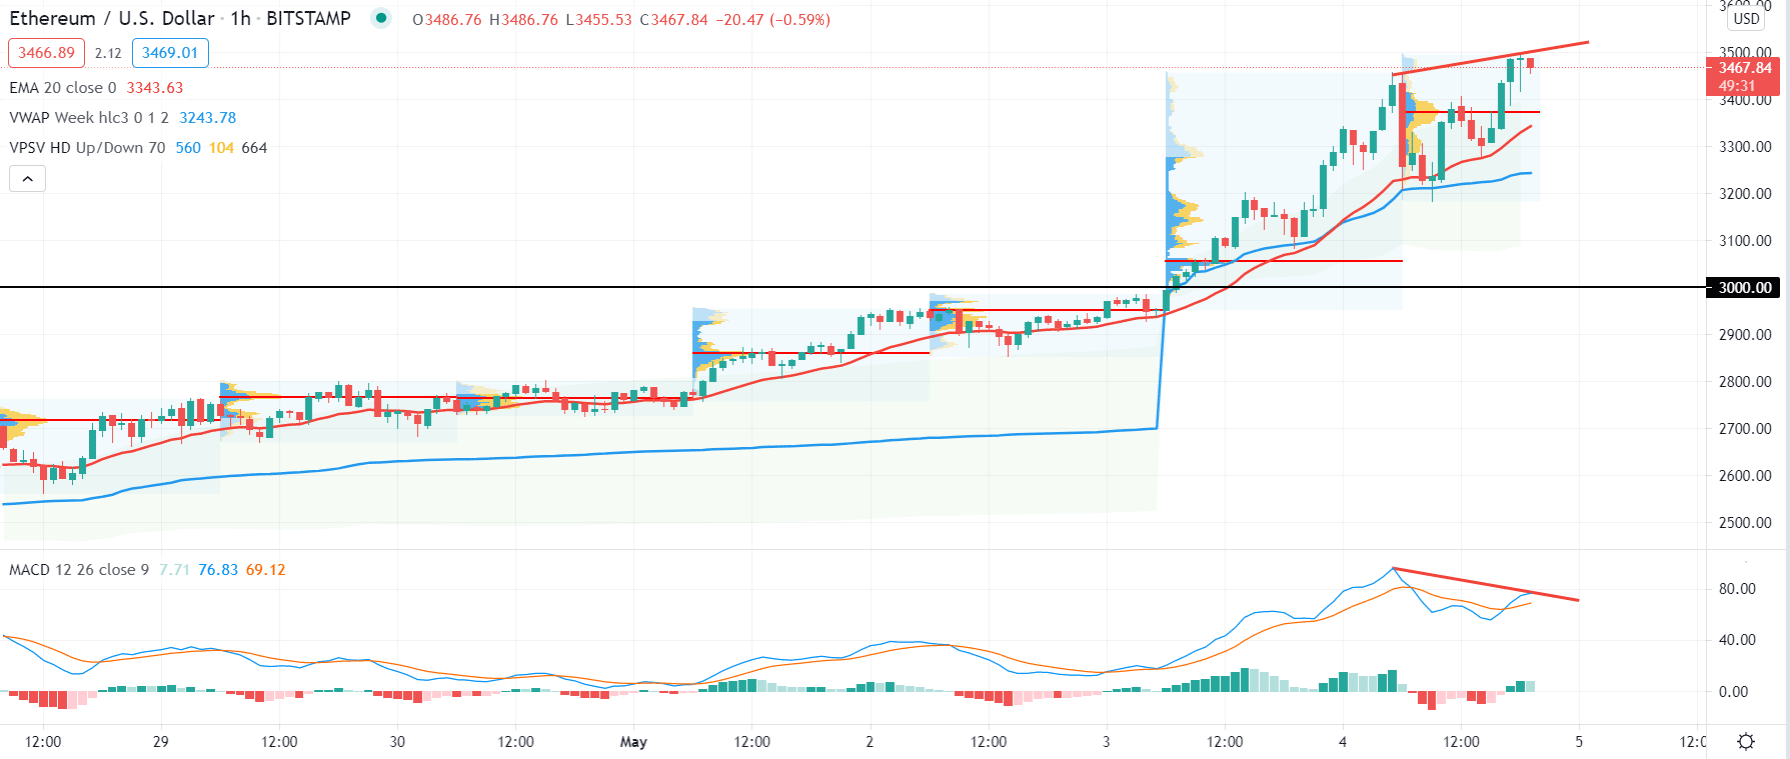
Based on the H1 chart, the price is trading above the current high volume level at $3373.00 level along with vwap. Therefore, as long as the price is trading above these levels, we may consider the trend as a strong bullish trend.
In the above image, we can see that the price reached the $3500 psychological level with a potential regular divergence with MACD. Therefore, the price has a higher possibility to correct lower in the coming hours. However, investors should wait for the price to come below the intraday high volume level with a strong bearish H1 close. In that case, the primary target would be $3000 level. Conversely, a strong H1 close above the $3511.46 level may extend the bullish trend towards the $4000 level.
As of the above discussion, we can say that Ethereum is moving higher with an impulsive bullish pressure where an intraday correction is pending.
As long as the regular divergence is active in the H1 chart, the price may come lower towards $3180 Kijun Sen support from where the bullish continuation may occur. However, a strong bullish daily close above the $3511.46 level may alter the current market structure and take the price towards the $4000 level.