
Published: April 21st, 2021
Investors who sold Etheruem at the $2,000 level thought it was the right decision as this level worked as significant resistance. However, in April, the price broke above this level with an impulsive bullish pressure that brought investors a taste of an all-time high.
As a result, many investors now think it was not the right decision to sell ETH at the $2000 level, while some investors bought back the instrument from above the level. In financial market trading, once the resistance is broken with a tremendous speed and the price comes down to that level again, we may consider this level as an event level.
In every event level, buyers and sellers remain active so that the price may show a significant movement once it starts to move from that level.
Based on this concept, Ethereum has a higher possibility of showing sn impulsive movement as it currently faces support from an event level on multiple timeframes. Let’s have a look at how the price may react from the Ethereum technical analysis:
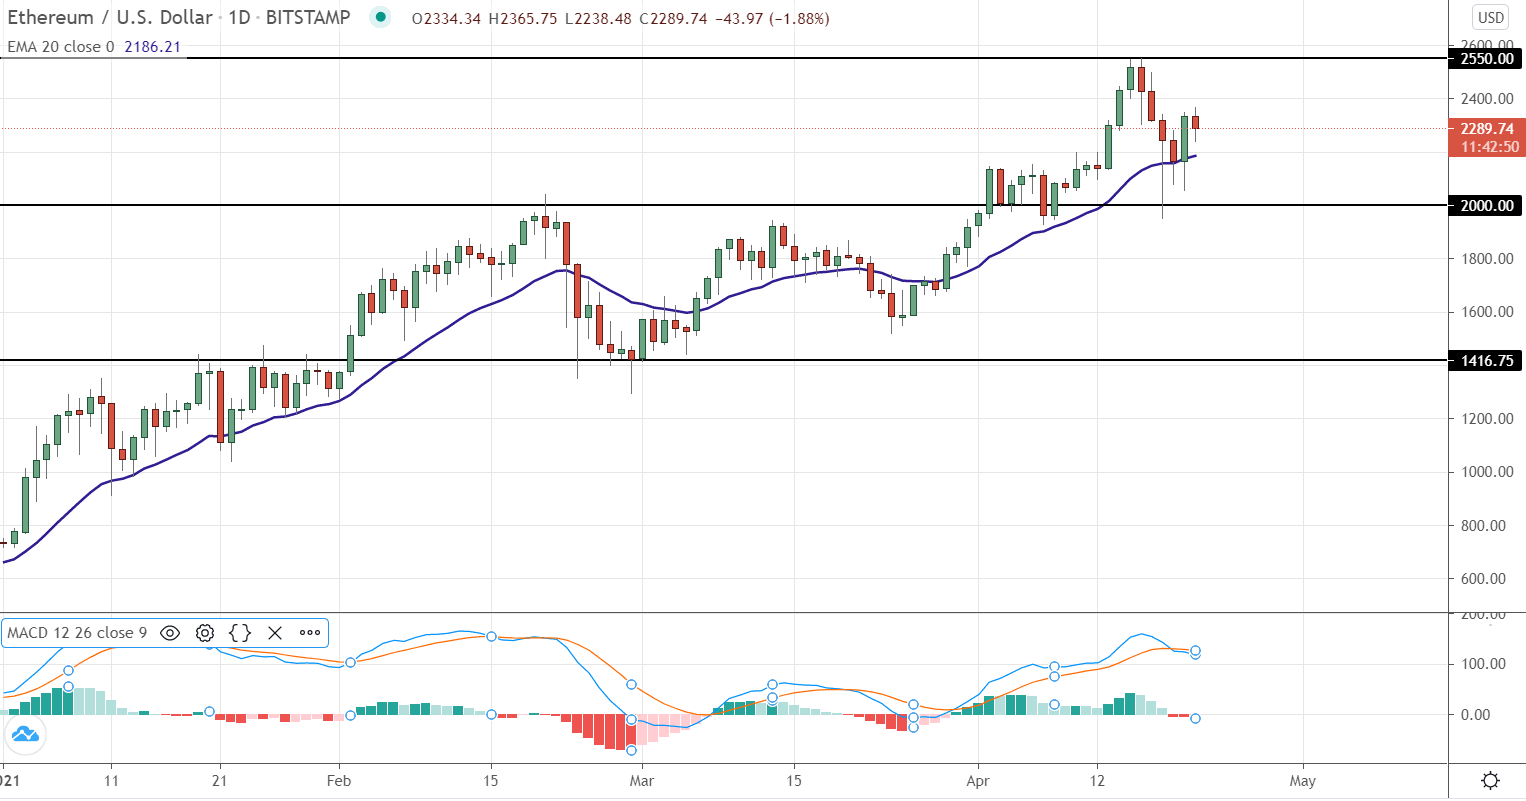
Based on the daily chart, the overall market trend for the ETH/ USD is bullish. Moreover, the price moved above the important $2,000 event-level with a bullish daily close, indicating further bullishness.
Here we can see that the price made an all-time high at $2,550 level before cracking down to the $2,000 level. The bearish pressure from the all-time high came from the Turkish Central Banks statement regarding the crypto ban that shook the crypto market. Moreover, the bearish pressure was influenced by Ethereum’s major counterpart, Bitcoin that moved sharply below the $56,000 level.
However, the bearish pressure was not enough to say that it would continue below the $2,000 level due to the massive exhaustion candle at that area. Therefore, as long as the price trading above the $2,000 level, we may consider the trend a solid bullish trend.
On the other hand, the price had a daily close above the dynamic level of 20 EMA, indicating that short-term buyers are active in the market. Meanwhile, in MACD, there is no sign of divergence. The current MACD Histogram is bearish, but its size thick compared to the previous bullish Histogram.
In this market condition, the price may come lower to the dynamic 20 EMA, and any bearish rejection from that level with a smaller bearish Histogram may make another high above the $2,550 level.
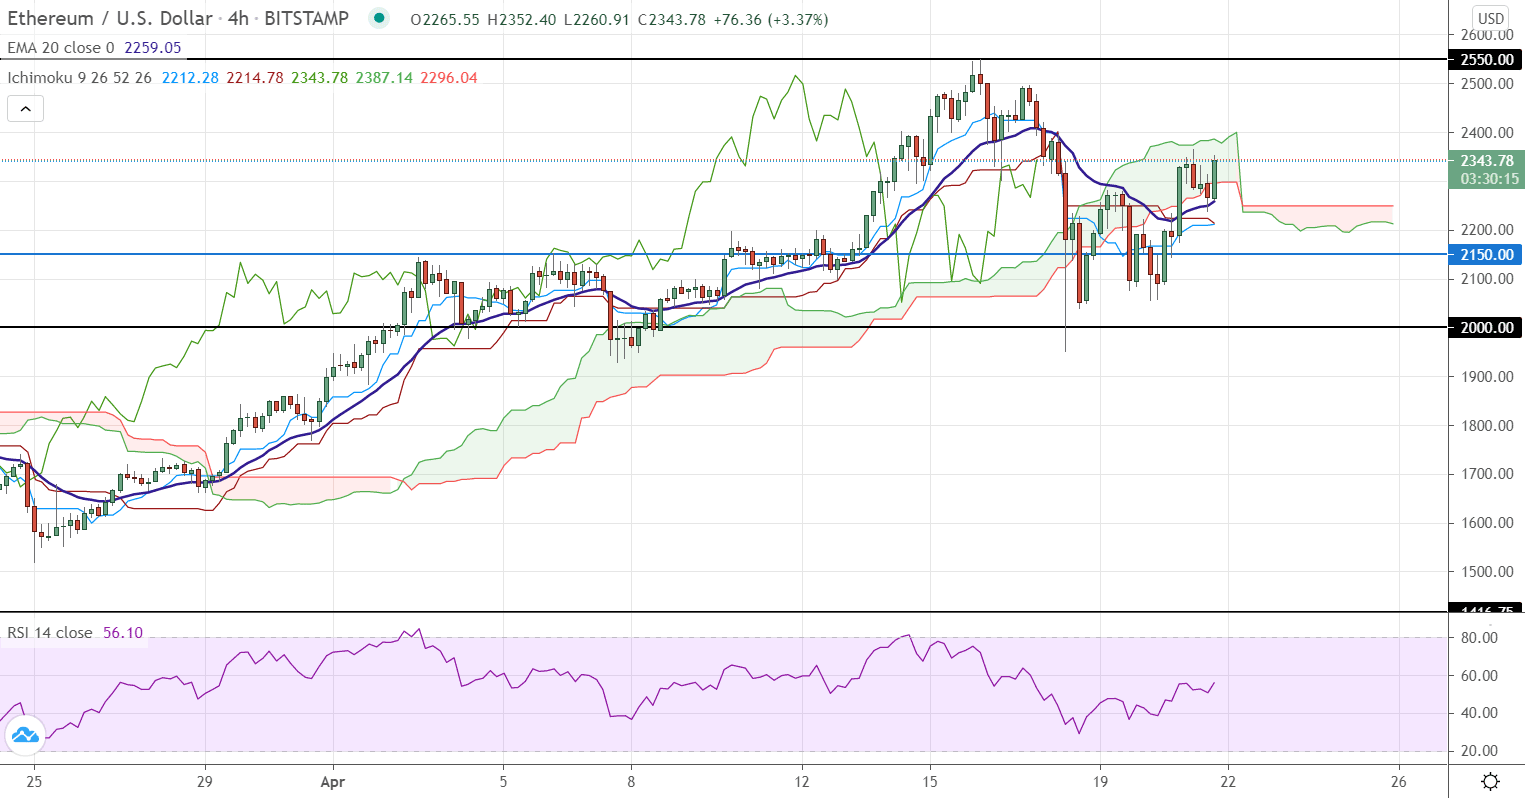
Based on the H4 chart, the price trading above the intraday event-level $2150, followed by dynamic support from 20 EMA.
We can see that the Tenkan Sen and Kijun Sen are below the price in the above image, but Kijun Sen is moving up. Therefore, any bullish crossover would create a bullish intervention in the price.
On the other hand, the price tried to come below the Kumo Cloud on 18th April but failed to create a strong ground. Therefore, the price became volatile within the Kumo Cloud, where any bullish H4 close above the cloud would increase the bullish possibility.
Besides, RSI is currently below the 60 levels and pointing up. Therefore, it may move higher towards the 80 levels, indicating buyers’ presence in the price.
Overall, based on the H4 chart, the price needs to have a bullish close above the $2,390.87 level to increase the bullish possibility. Conversely, a solid bearish H4 close below the $2,150.00 event-level would initiate bearish pressure.
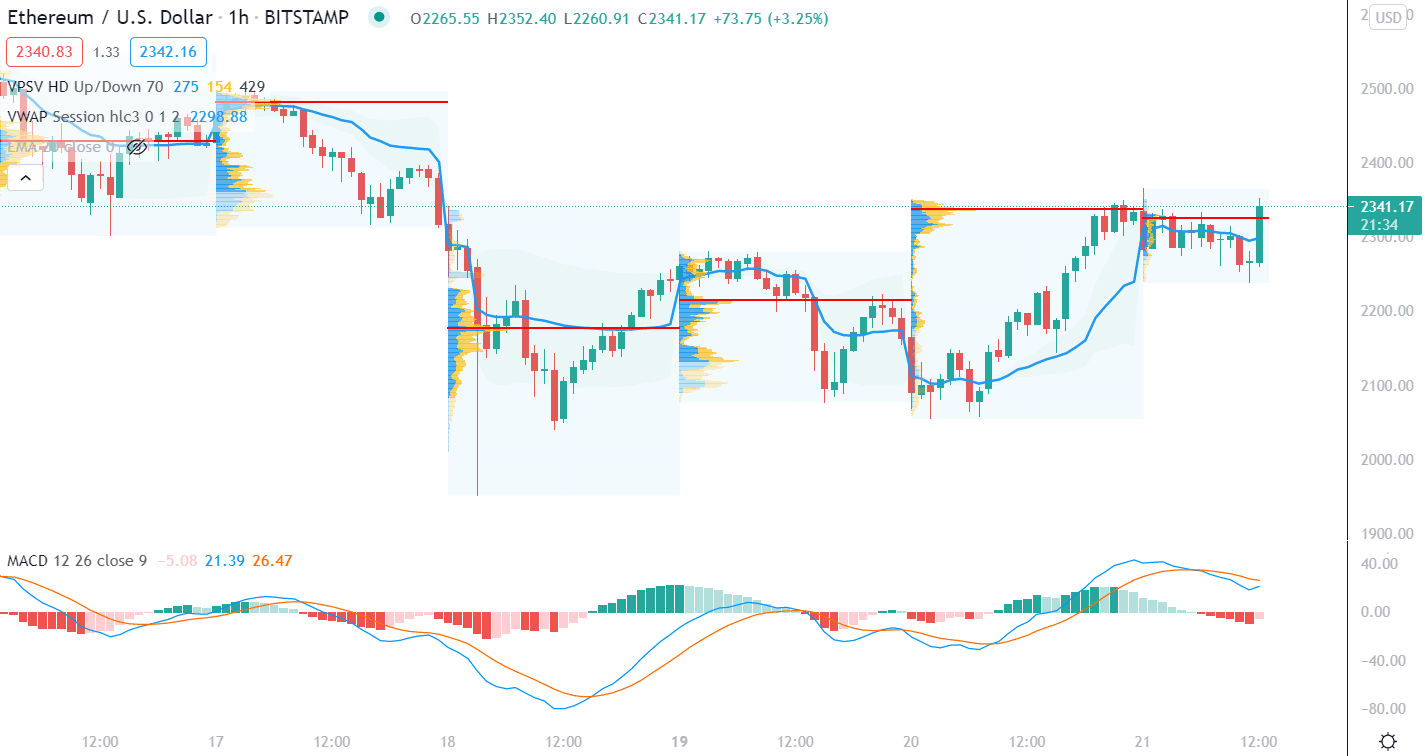
A significant activity level was found at the $2,328 area based on the intraday market volume profile. Therefore, any bullish H1 close above this level would increase the bullishness in the price.
We can see that the price tried to come below the vwap session-level in the above image but failed. Therefore, the price moved sharply above the vwap level and waits for an H1 close.
On the other hand, the MACD Histogram is still bearish, but it is squeezing to the zero levels. Therefore any positive histogram with an hourly close above the $2,328 level may create another bullish leg upside. Conversely, a solid bearish hourly close below the recent low of $2230 may initiate a bearish pressure in the price.
As of the above discussion, we can say that Ethereum has a higher possibility to continue the bullish pressure as long as the price is trading above the $2150 intraday event level.
The primary target for the bullish trend would be the all-time high of $2,550, where any bullish Daily close above it may take the price at $3,000 level.
Based on this price action, any strong bearish daily close below the $2,000 level may alter the current market structure. In that case, the price may find support at the $1581.82 level.