
Published: June 17th, 2026
As per recent on-chain activity, Ethereum (ETH) whales have increased their holdings by taking advantage of the price decline during the last two weeks.
Since June 5, after the leading altcoin got close to $1,500, wallets holding 10K–100K ETH have gained about 510K Ethereum to their total amount. ETH has moved toward $1,800 in part due to this dip-buying impulse.
Conversely, wallets or retail investors with balances of 100–1K and 1K–10K ETH showed little change in their assets during the same time period, suggesting a sidelined approach during the sell-off.
According to the on-chain data, the US market Ethereum exchange-traded funds (ETFs) saw net inflows of $22.5 million following four days of net withdrawals. Since March 8, the items have only had three days of input. Until corporate buying from the US increases, the fundamental market structure may continue to be vulnerable.
Despite the market's weakness, the total quantity of ETH staked is rising, hitting an all-time high of 39.83 million ETH.
Let's see the upcoming price outlook from the ETH/USDT technical analysis:
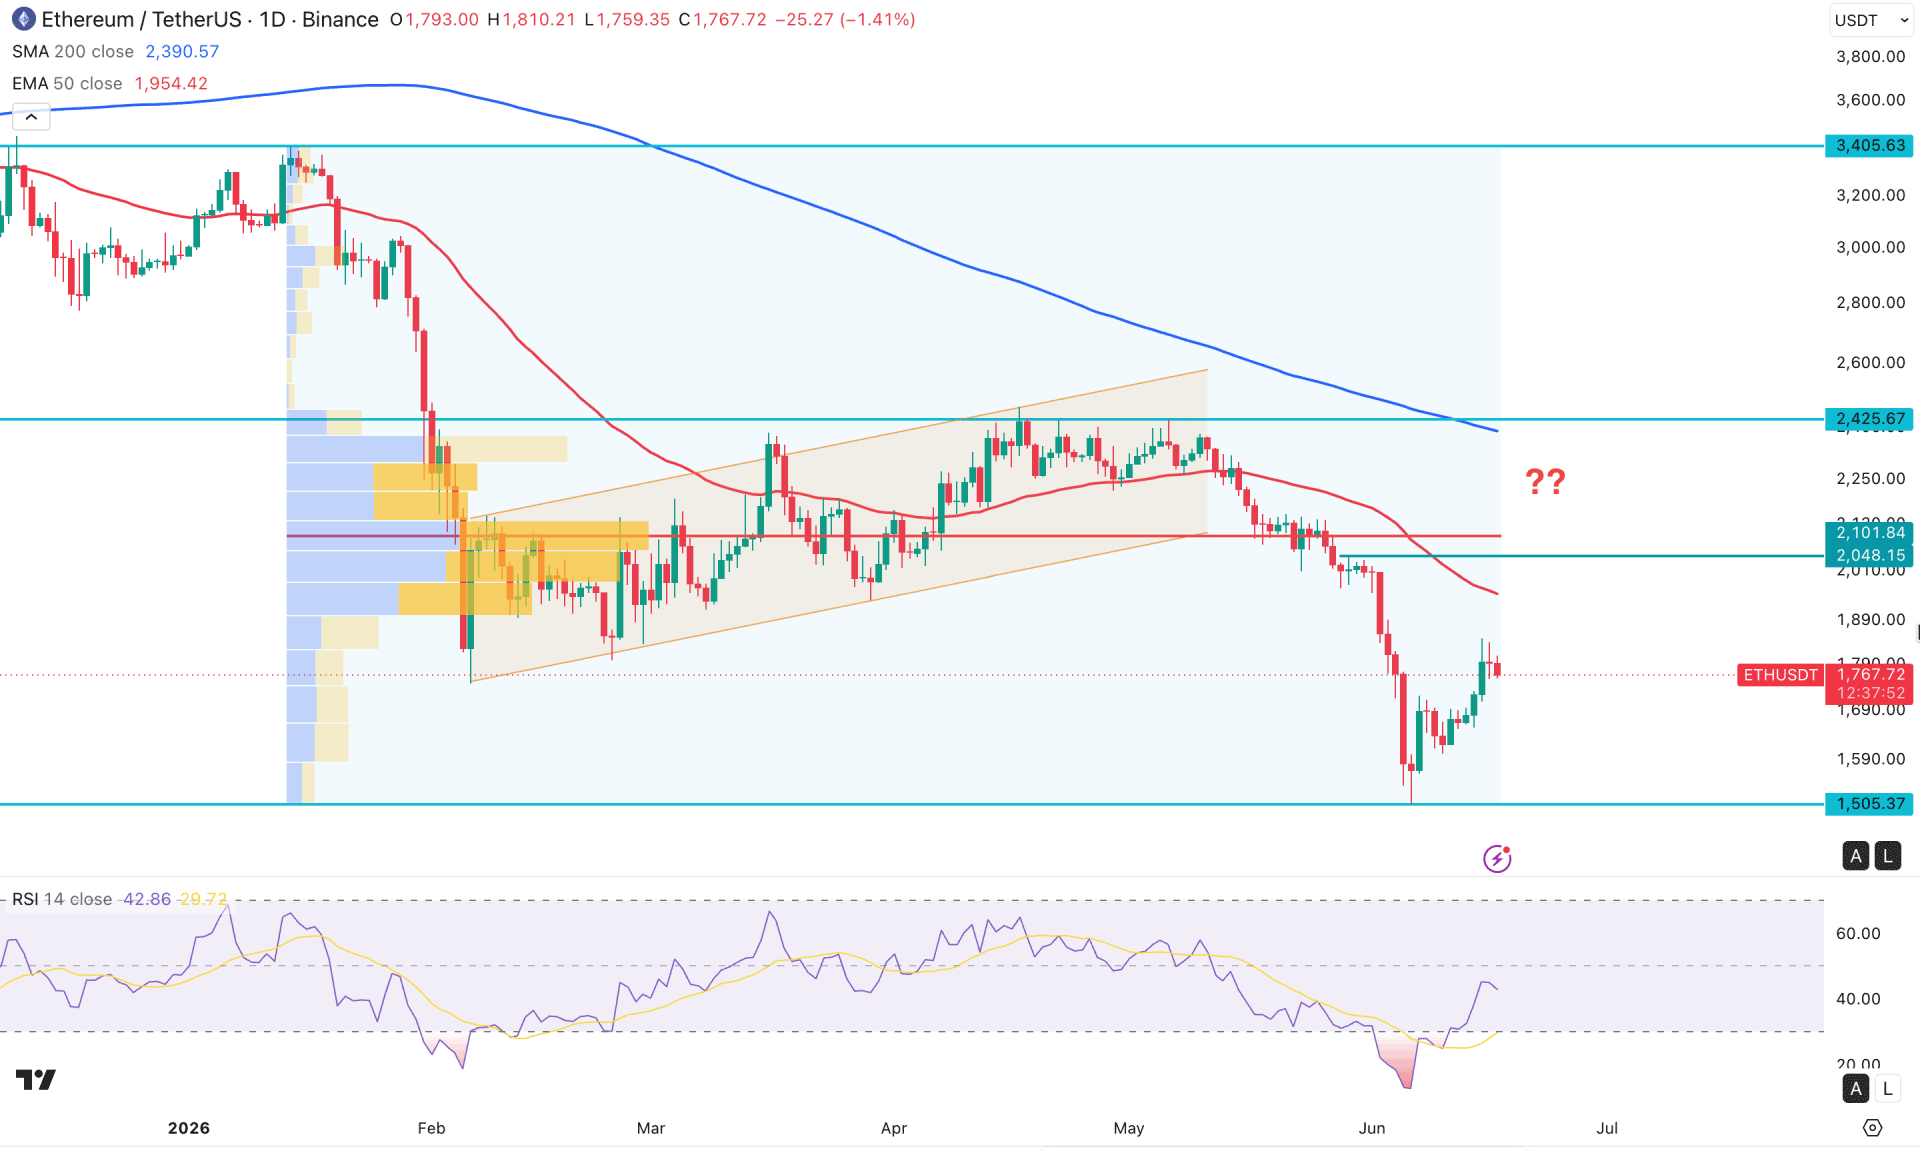
In the daily time frame, ETH/USDT is trading within an ongoing bearish pressure, where the recent price formed a minor bounce from the yearly low. The larger investors are interested in this instrument from the discounted price area, but some more confirmations are needed before considering a trend change.
In the higher timeframe, the price action is sideways as the monthly timeframe suggests several violations of the swing, suggesting volatility. Despite the recent downside pressure from the 5000.00 psychological line, the price is still holding the bottom formed in 2025. Although no significant bullish rebound is seen from the recent low, closer attention should be given to the lower timeframe. In the weekly chart, the ongoing market pressure is still bearish, and more confirmation is needed before validating the bottom.
In terms of volume, the most active level since January 2026 is at the 2101.84 level, which is above the current price.
In the daily time frame, the 200-day SMA and 50-day EMA are above the current price and have a bearish slope. Moreover, a high-volume resistance level is marked at 2101.84, which is just above the static 2048.15 swing high. Primarily, these dynamic and static lines are above the current price and signal valid bearish pressure.
The RSI index shows a different story, with a rebound visible from the 30.00 oversold area. However, the current RSI line is still below the 50.00 neutral level, suggesting active bearish momentum.
Based on the overall market structure, the price is trading below crucial resistance levels and is likely to form a bearish trend continuation. The immediate support level to target is the 1551.3 level.
On the bullish side, overcoming the 50 EMA could test the 2101.84 resistance level before moving beyond the 2425.57 key resistance line.
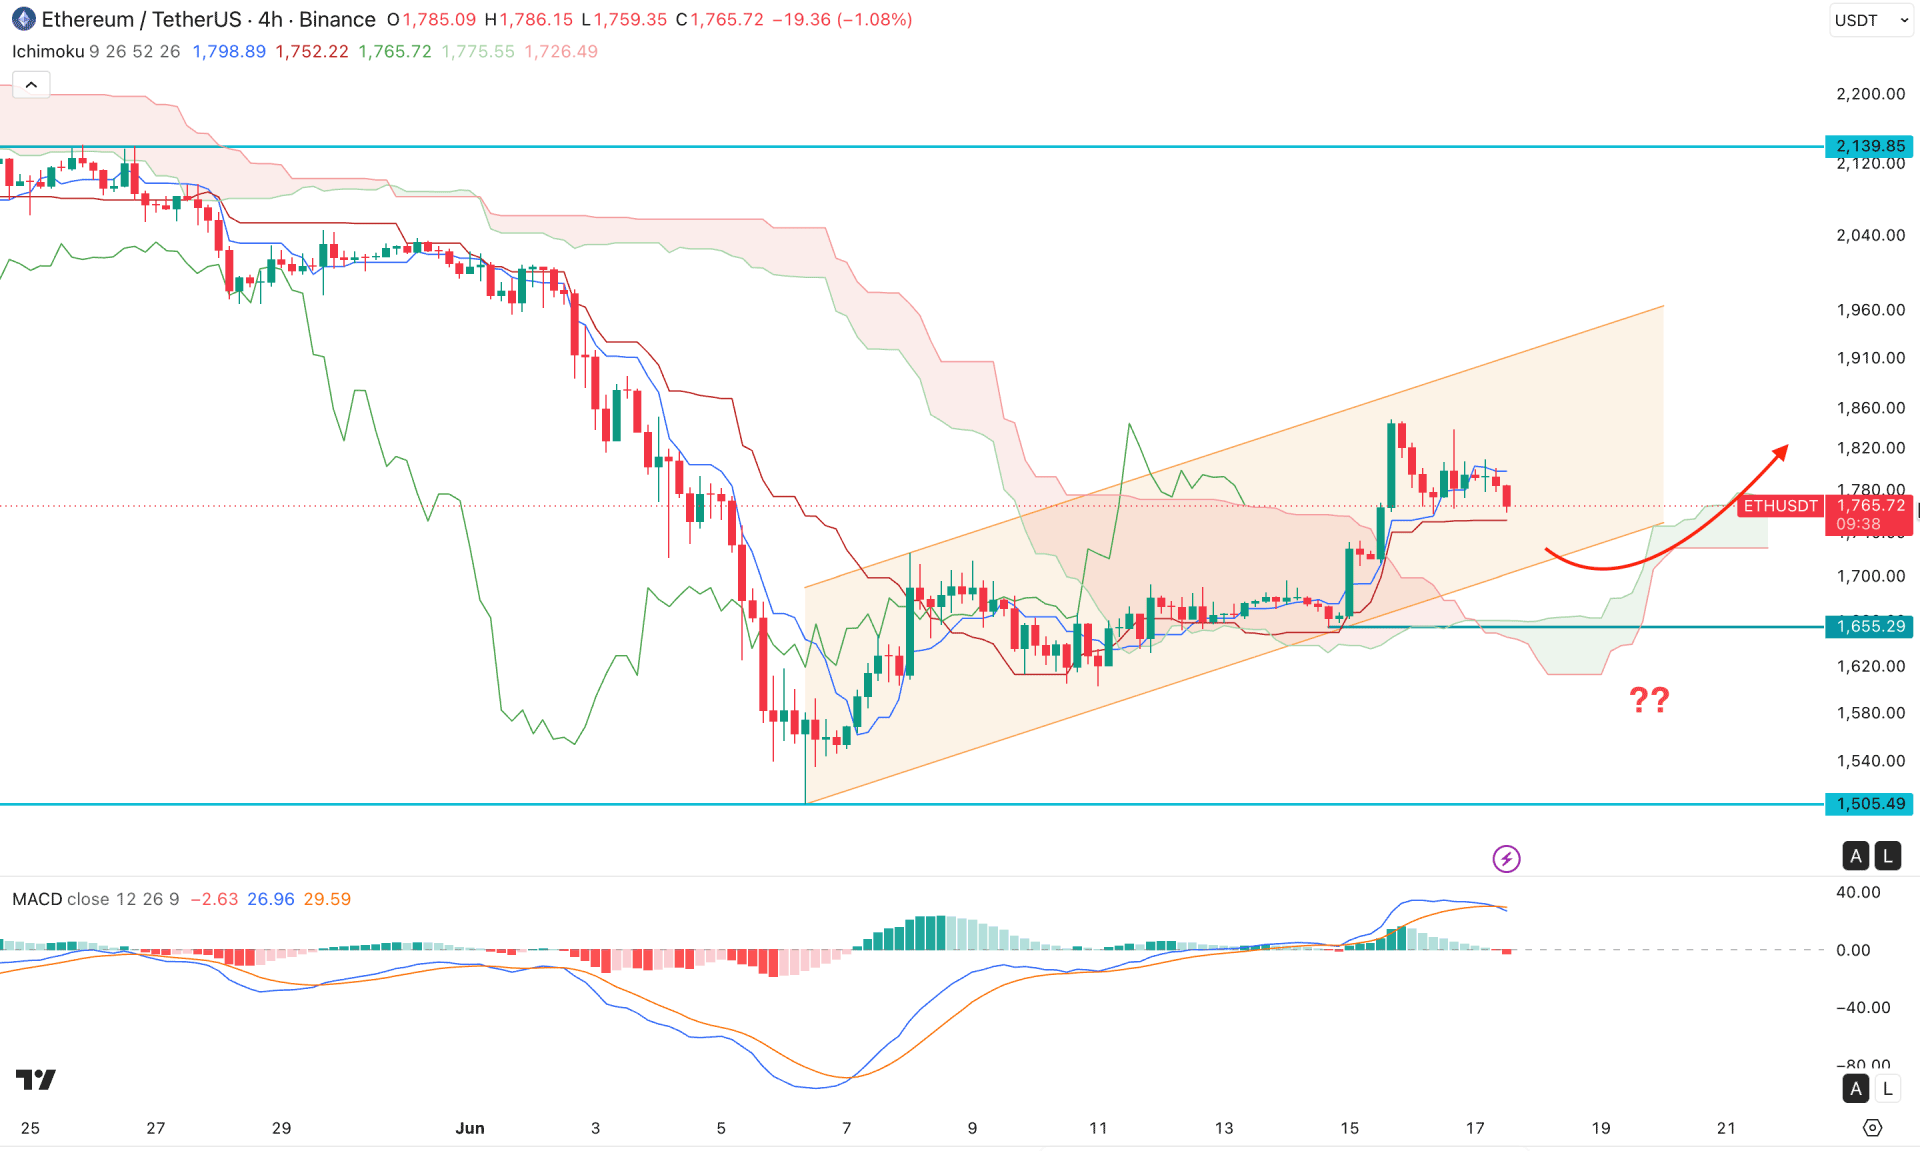
In the H4 timeframe, ETH/USDT is trading within a corrective bearish pressure, where a strong bullish rebound is seen from the cloud area. After forming a valid breakout, the price remains sideways above the cloud support, creating an opportunity for another bullish push.
In the future cloud, both lines are solid, anticipating a trend continuation, but some minor correction is present from the dynamic line. As a bearish candle is present below the Tenkan support line, proper validation is needed before forming a continuation.
In the secondary indicator window, the MACD signal line has formed a top and created a bearish crossover. It is a sign of minor selling pressure in the main price chart. Moreover, the histogram flipped below the neutral level, signaling confluence bearish pressure.
Based on this outlook, investors should closely monitor how the price behaves within the ascending channel. As the price rebounds from the lower area and approaches the channel support, a valid rebound with recovery above the Kijun level could be a long opportunity targeting the 2020.00 area.
On the other hand, a failure to hold the price above the 1655.29 support level could be an alarming sign for buyers, as it could extend the downside pressure towards the 1500.00 area.
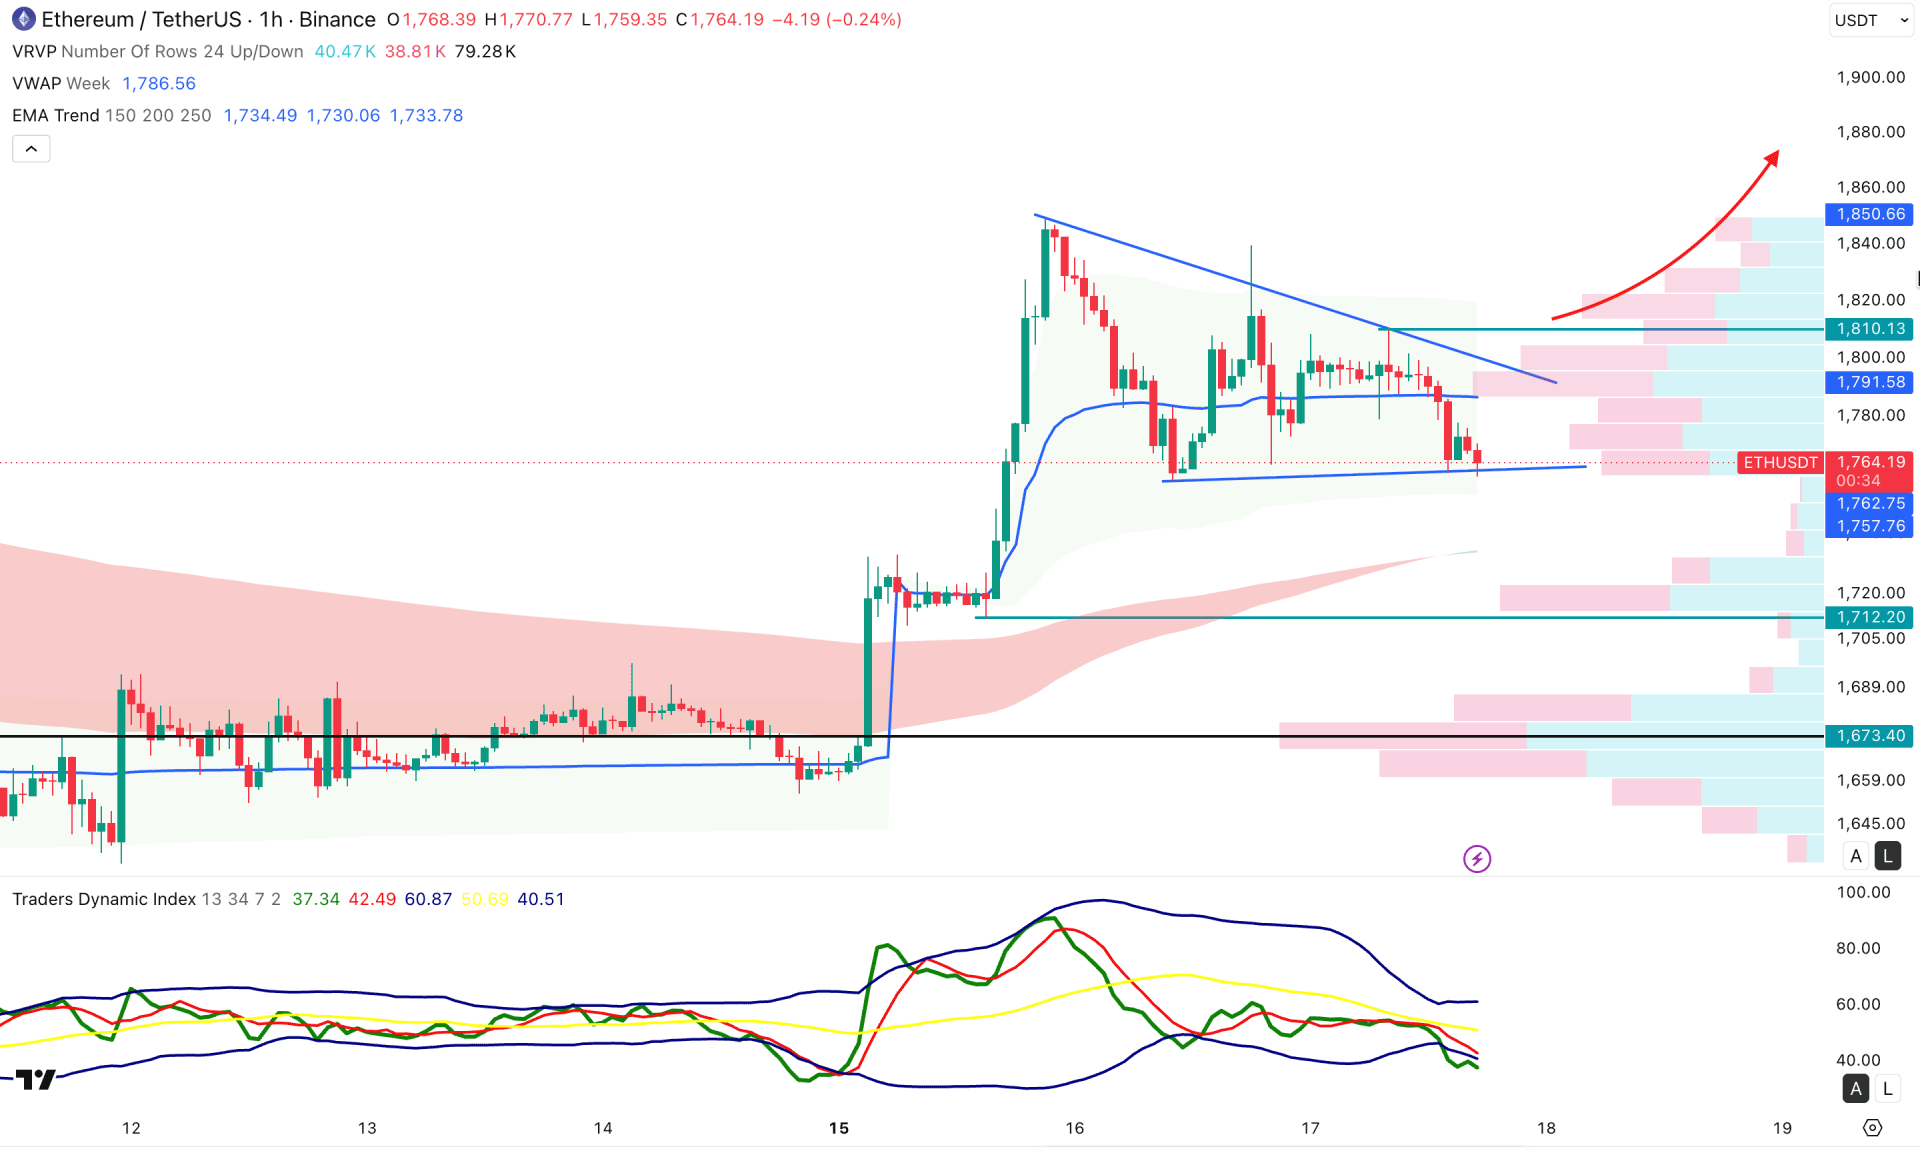
In the hourly timeframe, ETH/USDT is trading within bullish momentum, where the current price is trading sideways after forming a top above the 1800.00 area. A mixed market sentiment is present as the weekly VWAP is above the current price, but trend lines are still holding buyers' interest.
In the indicator window, the Traders Dynamic Index has rebounded and moved to the bearish area, signaling active selling pressure in the market.
Based on this outlook, the price is testing the nearby support, where a failure could extend the downside momentum. However, a rebound with a stable price above the 1810.13 level could validate a long opportunity at any time.
On the other hand, an extended correction is possible towards the 1712.20 support level, from where another long opportunity could come. Below these levels, extended selling pressure is possible, targeting the 1600.00 area.
Based on the entire market structure, ETH/USDT is trading within corrective strength, where the existing market momentum remains bearish. The price is trading at the peak, from where a downward correction is highly possible. However, a bullish reversal might come from a potential breakout in the intraday chart after grabbing liquidity from any near-term swing low.


