
Published: February 15th, 2022
Ethereum investment products have experienced massive institutional inflows to accumulate ETH. The digital asset investment products have recorded a $75.3 million investment that broke the 9 weeks of inflows in the last week.
Fund inflows in the Ethereum investment have seen a massive uptick last week, including the $20.9 million capital. As a result, ETH funds broke the nine weeks outflow spell, indicating that institutional investors accumulate tokens before taking the price up.
According to the data from COinShare, the cryptocurrency investment product has faced $75.3 million worth of inflows, from where most of the inflows came from European investment products. However, the recent inflow is still below the fourth quarter of 2021 level, where any sign of overcoming it would raise the ETH price.
Currently, there are 119,589,015.25 ETH in supply where the last 24 hours surge in trading volume by 40% to $14,607,403,968 provided a sign of an increased investors’ activity.
Let’s see the upcoming price direction from the ETH/USDT technical analysis:
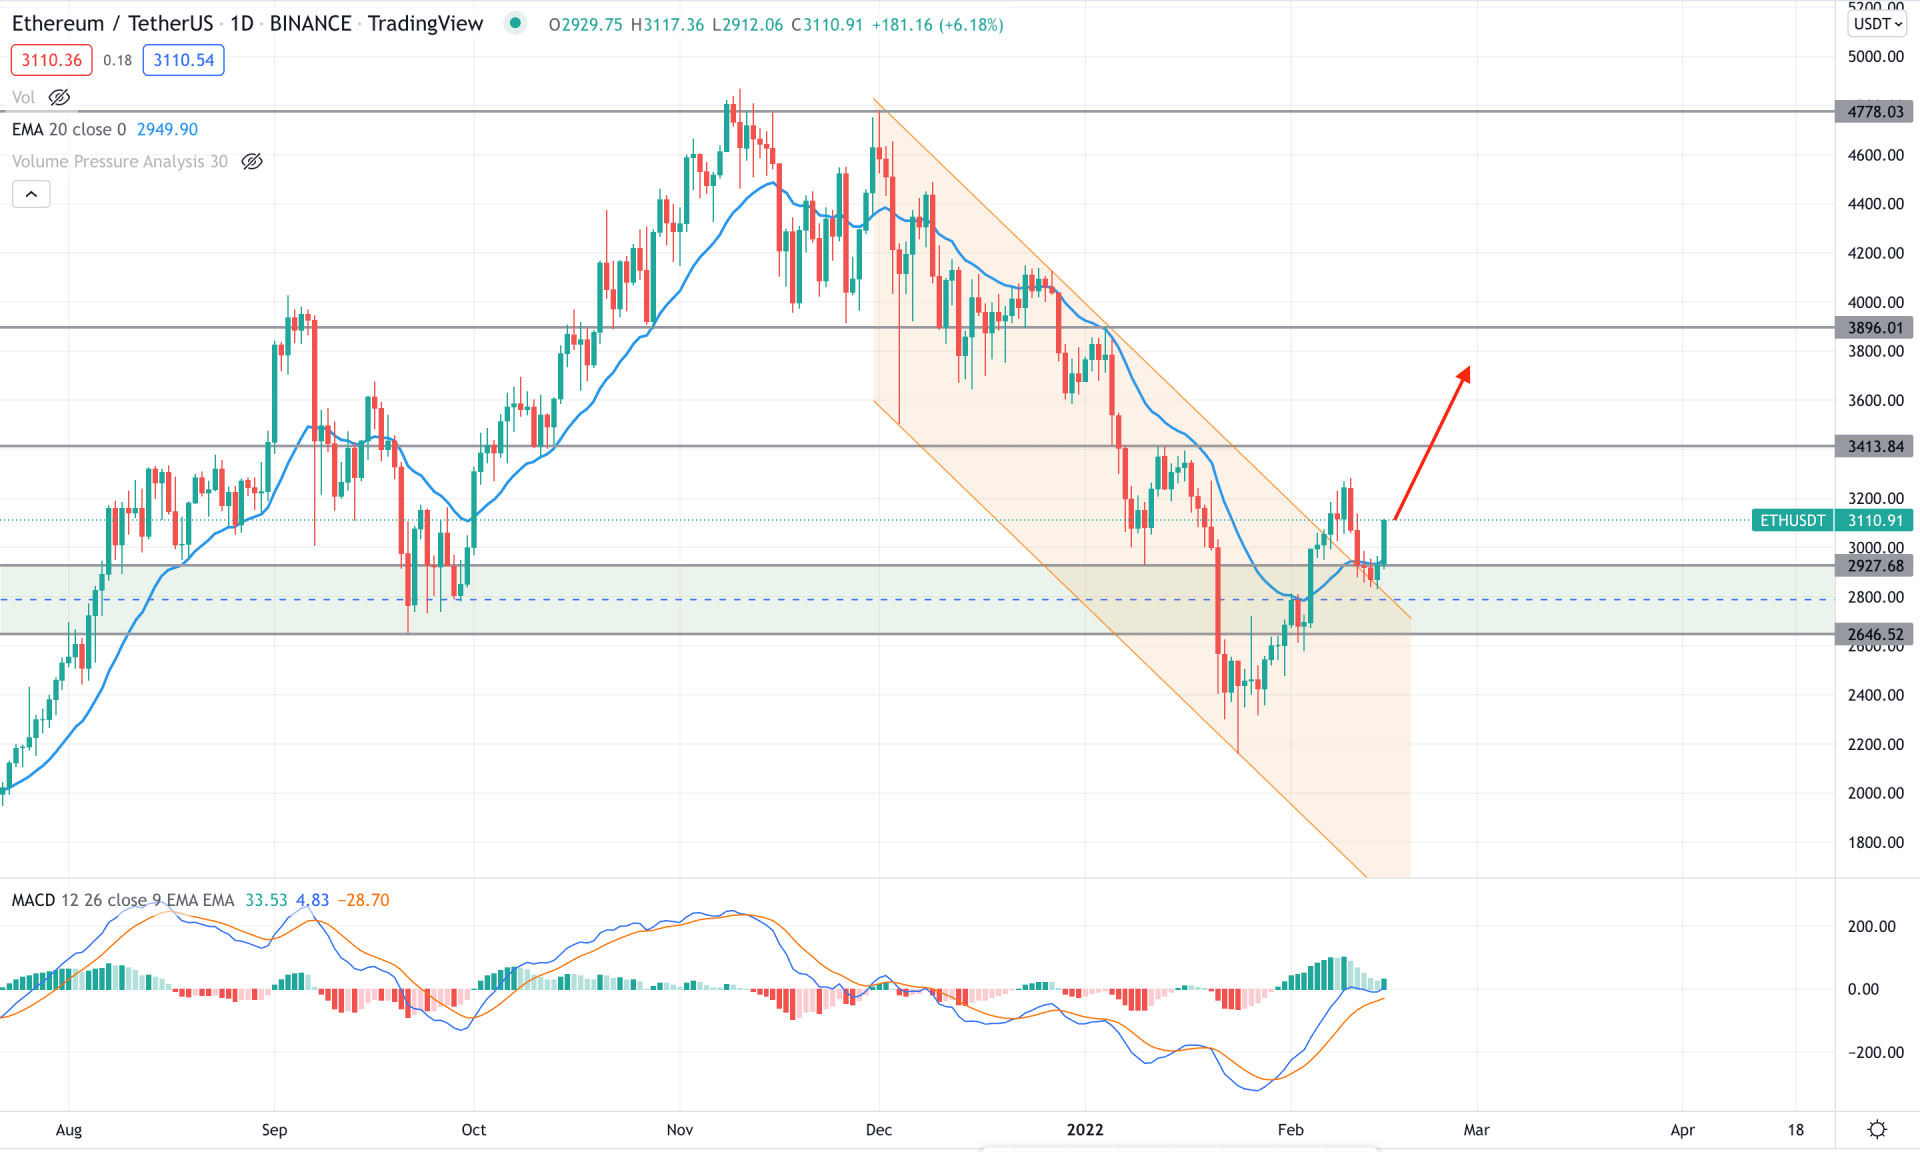
ETH/USDT made a new yearly swing low at 2159.00 level but rebounded immediately from the channel support in the daily chart. The break below the 2646.52 to 2927.68 area opened a question regarding the buying pressure towards the current all-time high, but the current situation is different. The buying pressure became potent as soon as bulls took the price above the bearish channel and corrected towards the dynamic 20 EMA and static 2927.68 level. Therefore if a bullish daily candle is formed above the dynamic 20 EMA, it may extend the buying pressure towards the 3413.84 area.
The above image shows how the price formed a bullish two-bar rejection from the dynamic 20 EMA after the breakout. Meanwhile, the MACD Histogram corrected and made a new high above the neutral level.
In that case, buyers are more likely to take the price up towards the 3896.00 level in the coming days. On the other hand, a break below the 2646.52 static level would alter the current market structure and lower the price towards the 2200.00 area.
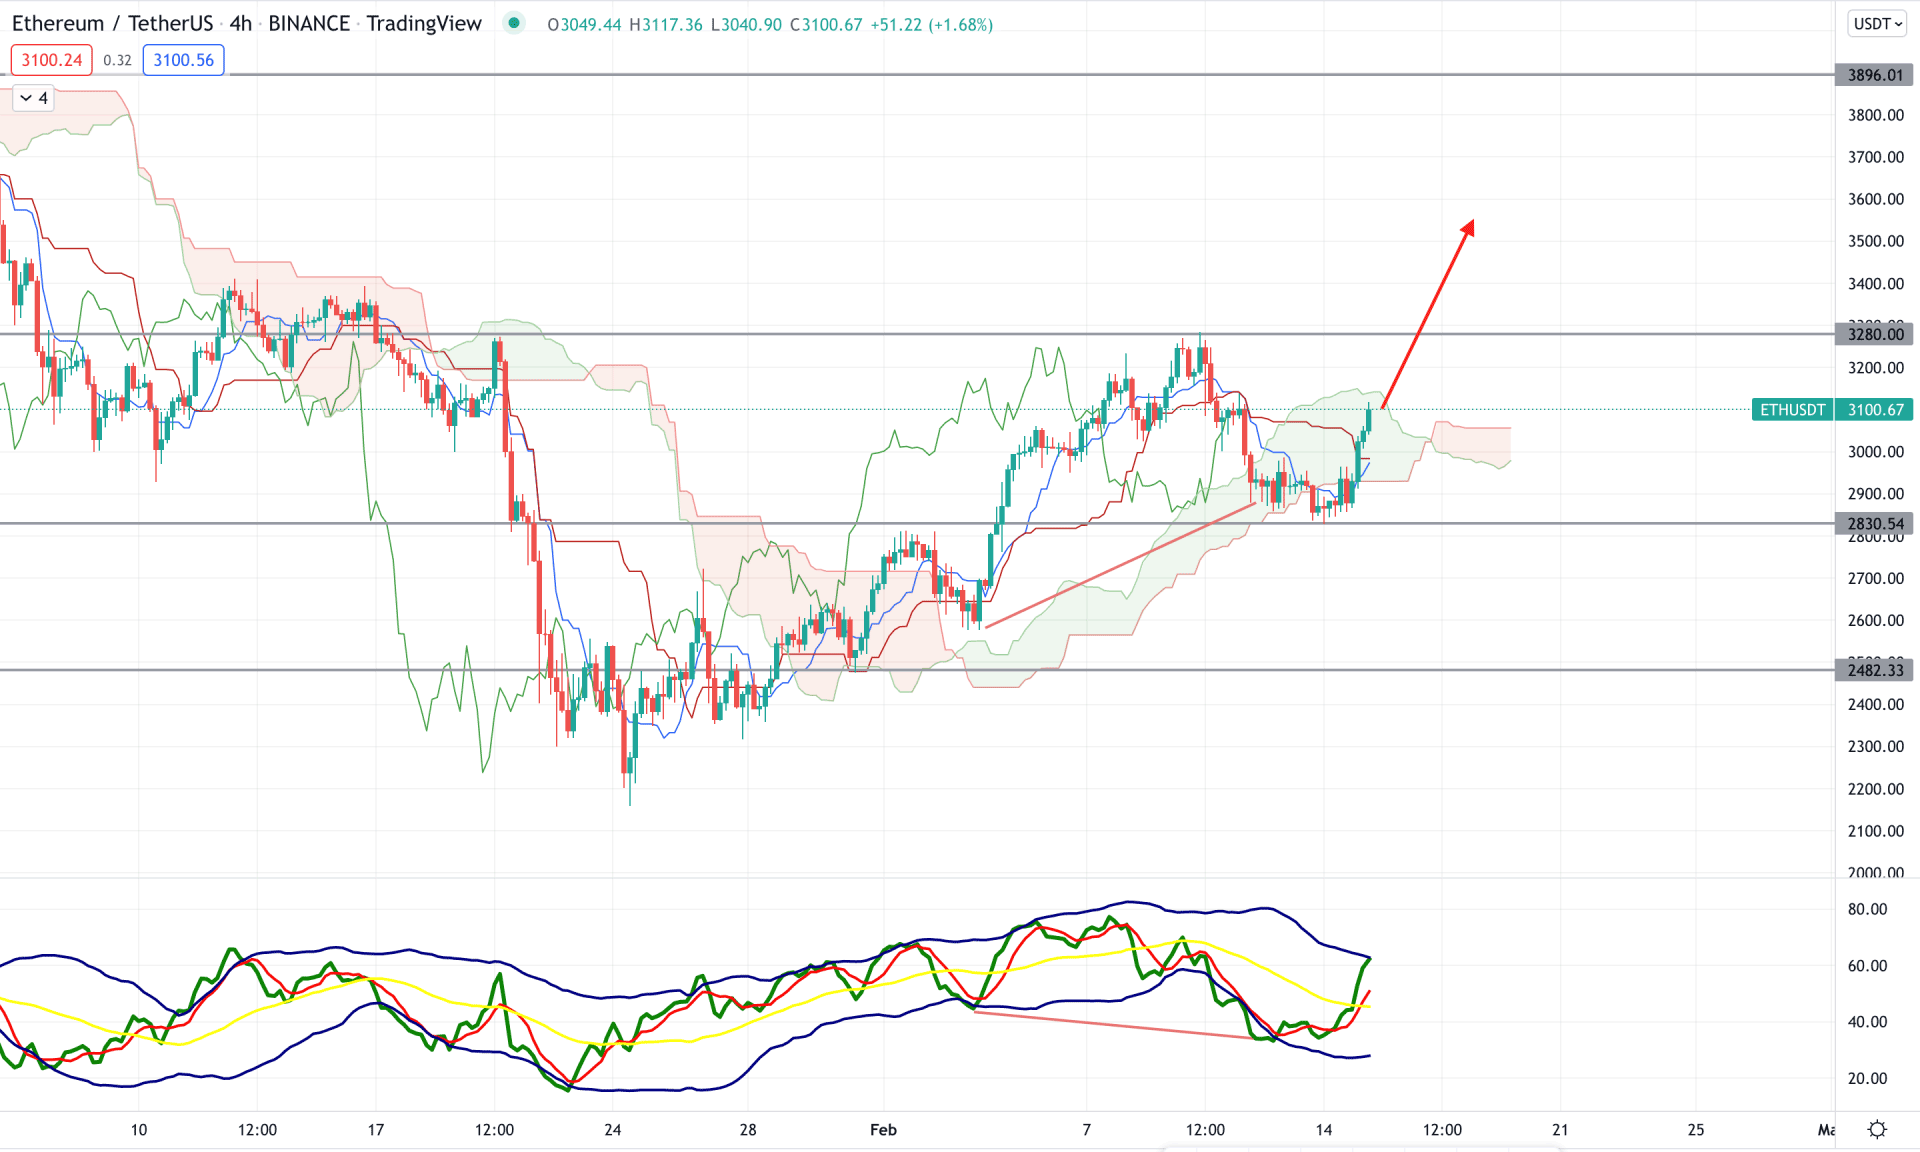
According to the Ichimoku Cloud, the current price trend of the ETH/USDT H4 chart is bullish as the recent price failed to hold the momentum below the Cloud Support. Although the current price is within the Cloud, there is a golden cross between dynamic Tenkan Sen and Kijun Sen, indicating a strong buying pressure in the price.
The above image shows how the price changed its direction from the 2830.54 static support and moved above the dynamic Kijun Sen level. Meanwhile, the Traders Dynamic Index (TDI) showed a strong buying pressure by taking the MA above the 50 level, followed by divergence.
Therefore, the buying pressure in the ETH/USDT H4 chart may extend above the 3280.00 area as long as it trades above the dynamic Kijun Sen. On the other hand, a break below the static 2830.54 level with a bearish H4 candle might need a HODLing approach towards the 2482.33 level before finding a further bullish setup.
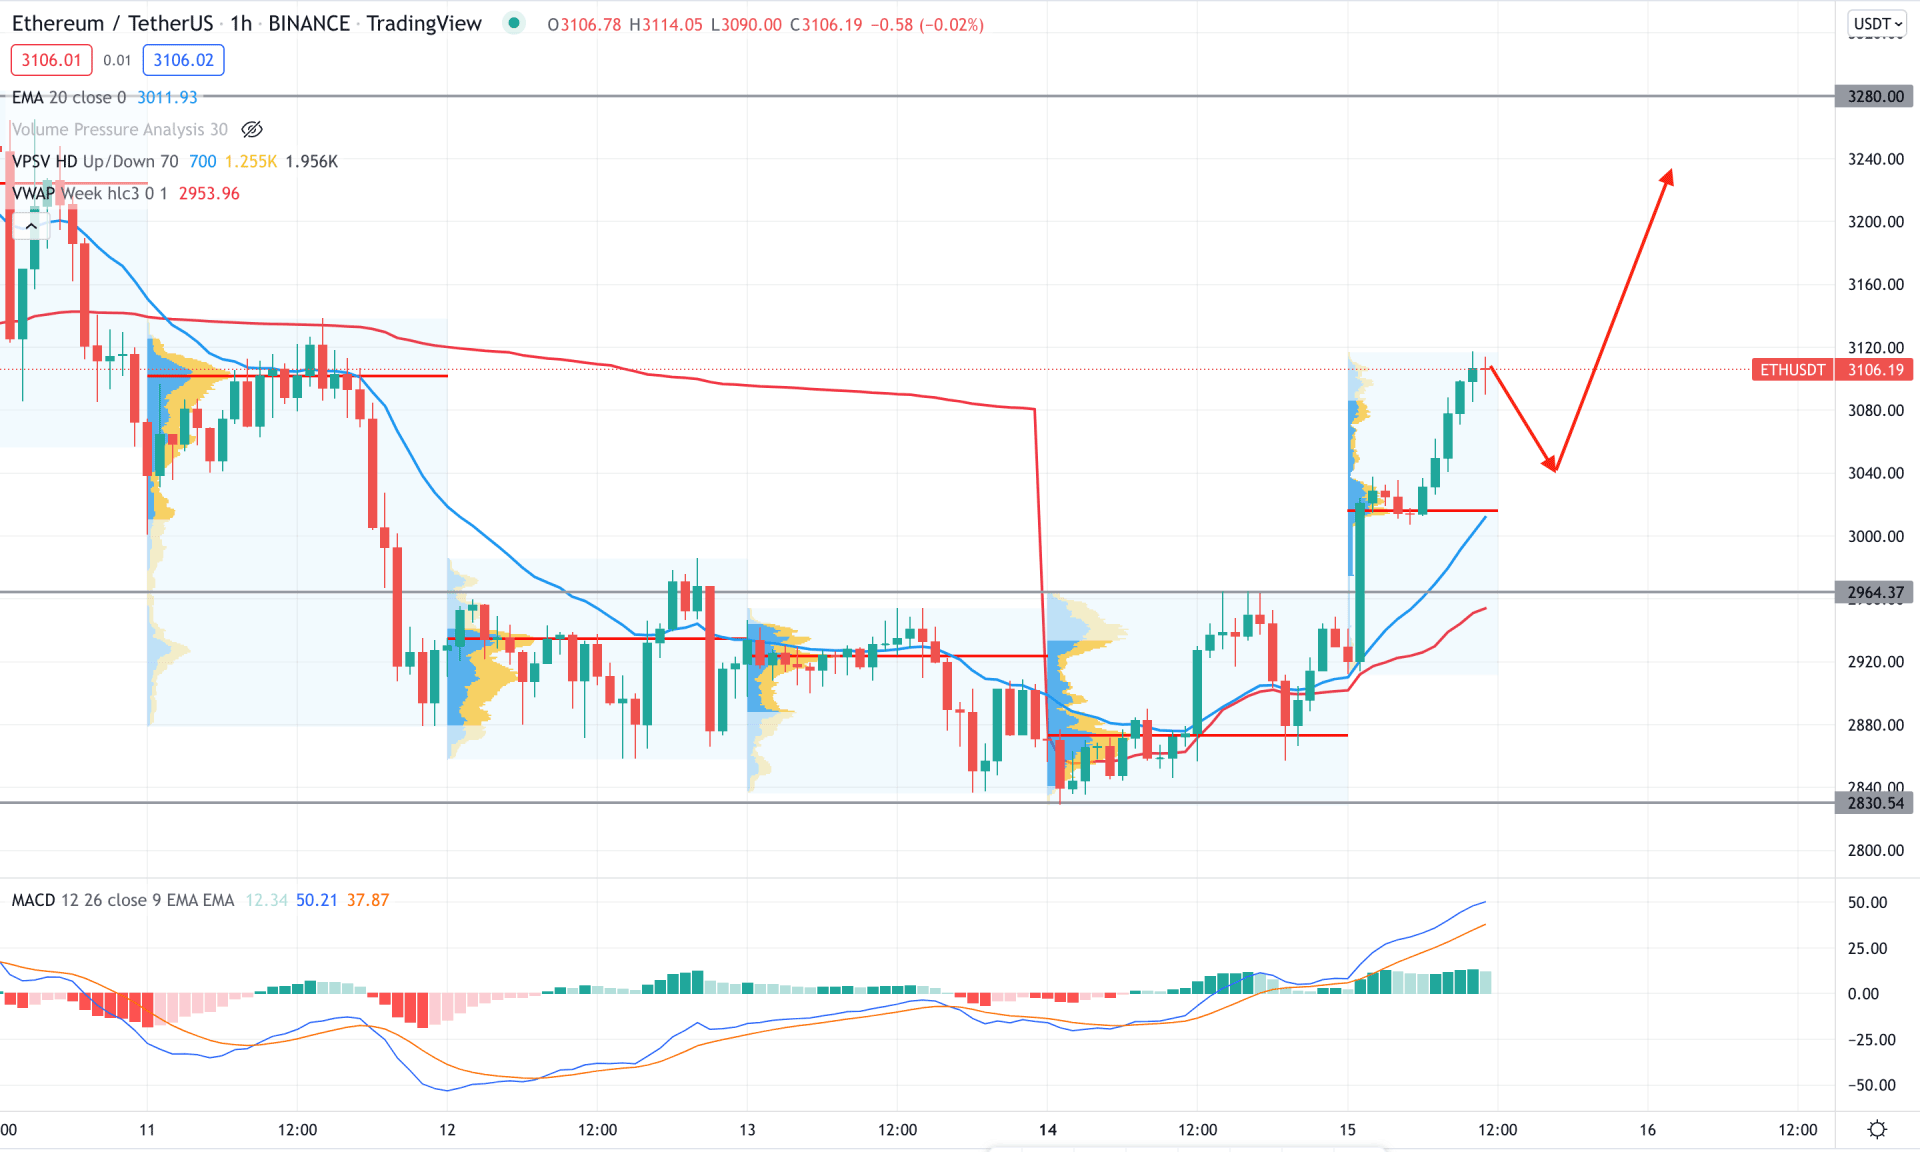
In the intraday chart, ETH/USDT changed the direction from bearish to bullish as soon the price moved higher from 2963.37 to 2830.54 range with a bullish impulsive pressure. Moreover, the buying pressure from 2872.89 and 3016.49 came with strong volume, and the price moved higher immediately after forming the volume change.
The above image shows how the price is trading above dynamic 20 EMA and weekly VWAP while the dynamic MACD Histogram turned bullish with a corrective pressure. However, the gap between the dynamic 20 EMA and price is 2%, where any buying pressure after 2% bearish movement would be a suitable buying point.
The primary target for the intraday bullish pressure would be towards the 3280.00 level. On the other hand, a break below the dynamic weekly VWAP might alter the current market structure and lower the price towards the 2830.53 area.
As of the above discussion, the ETH/USDT is more likely to show a bullish pressure towards the 3896.00 area due to the massive buyer's interest with a bearish channel breakout. In that case, any buying opportunity from the H1 correction would provide a high RR bullish opportunity for this coin.


