Published: January 18th, 2023
The number of Ethereum (ETH) validators has reached 500,000, according to statistics from BeaconScan. This is just in time for the Shanghai upgrade in March. The price of the ETH/USDT has also started a decent year with a 32% price increase so far.
In the Ethereum blockchain, a validator protects a proof-of-stake (PoS) blockchain by, among other things, validating the network's transactions and stopping double-spending mistakes. To utilize validator software, an initial investment of 32 ETH or approximately $50,000 at the current price is required.
Since the merge on September 15, 2022, when the network moved from a proof-of-work (PoW) consensus mechanism, validators have kept the Ethereum blockchain running.
The validation milestone is reached as Ethereum's core developers prepare to roll out the so-called Shanghai update, which is anticipated to happen sometime in March. Validators can access their staked ETH and the rewards achieved thus far following this update.
Ethereum is the second-largest cryptocurrency network by market cap for this network is $193,012,584,083.
Let’s see the future price direction of Ethereum (ETH) from the ETH/USDT technical analysis:
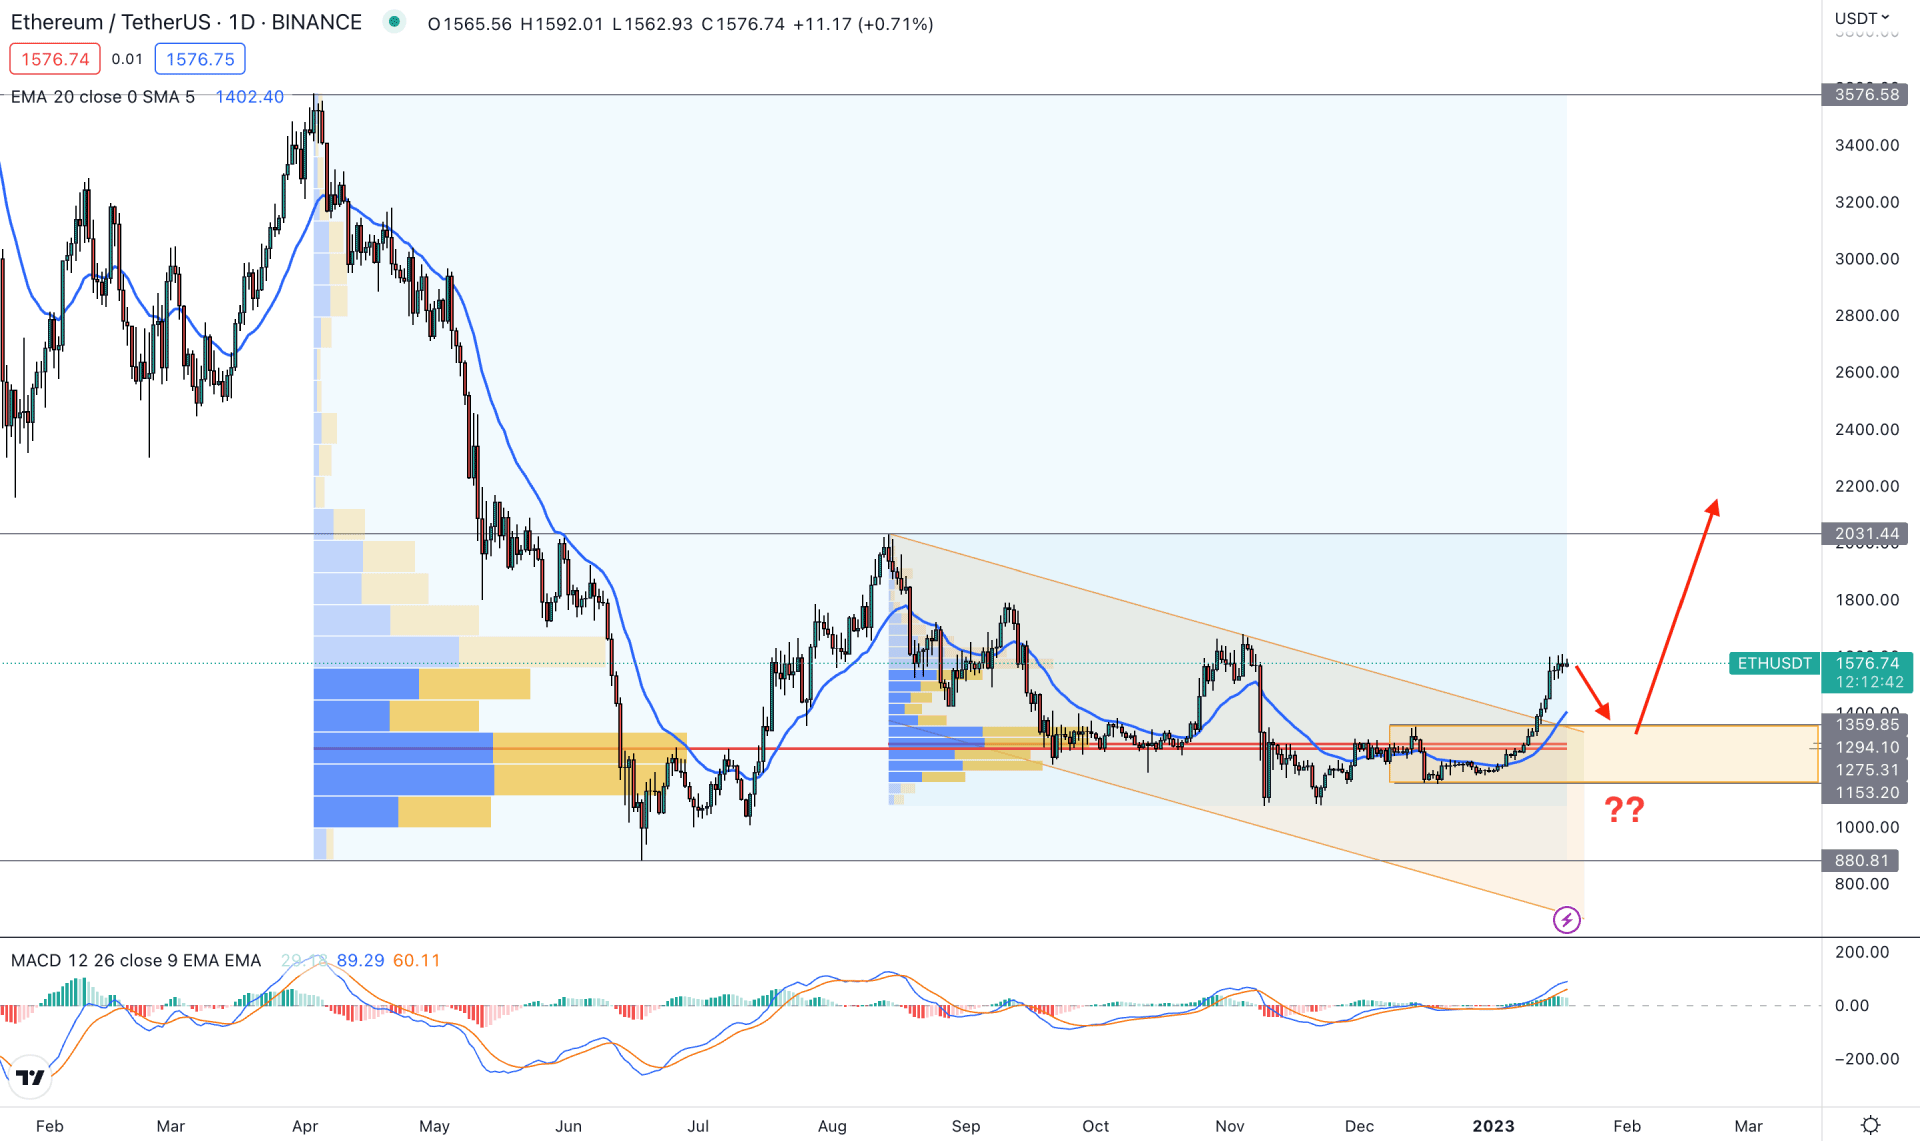
In the daily chart, the price is trading with strong bullish momentum, even if it is trading nearly at the bottom from 2022. After making a significant drop in 2022, the price remained corrective, and the recent price action from September to January is showing buyers’ interest in the market. As the current price is trading above the descending trendline resistance, the primary aim for this instrument would be bullish
Based on the fixed range high volume indicator, the highest trading volume from April 2022 to January 2023 is 1275.31. Moreover, another higher volume level from the August to January peak is also spotted at 1294.10.
As the current price is trading above the important high volume levels, it is a sign that institutional investors are interested in this market. In that case, it is safe to remain on the buyers' side until the price breaks below these high volume levels.
In the main price chart, the 20 Dynamic Exponential Moving Average is below the price and working as a dynamic support. The indicator window shows the same signal where the MACD Exponential Moving Averages are above the neutral line. It is a sign that the broader condition of this pair is bullish and investors should wait for the price to come to the near-term demand zone before aiming for a long opportunity.
Based on the daily structure any bearish correction and bullish rejection from the 1359.85 to 1153.20 area could offer a long opportunity, targeting the 2031.44 resistance level.
The alternative approach is to wait for the price to come below the 1150.00 level and form a bearish daily candle. In that case, a bearish possibility will be open, where the primary target would be 800.00 psychological level.
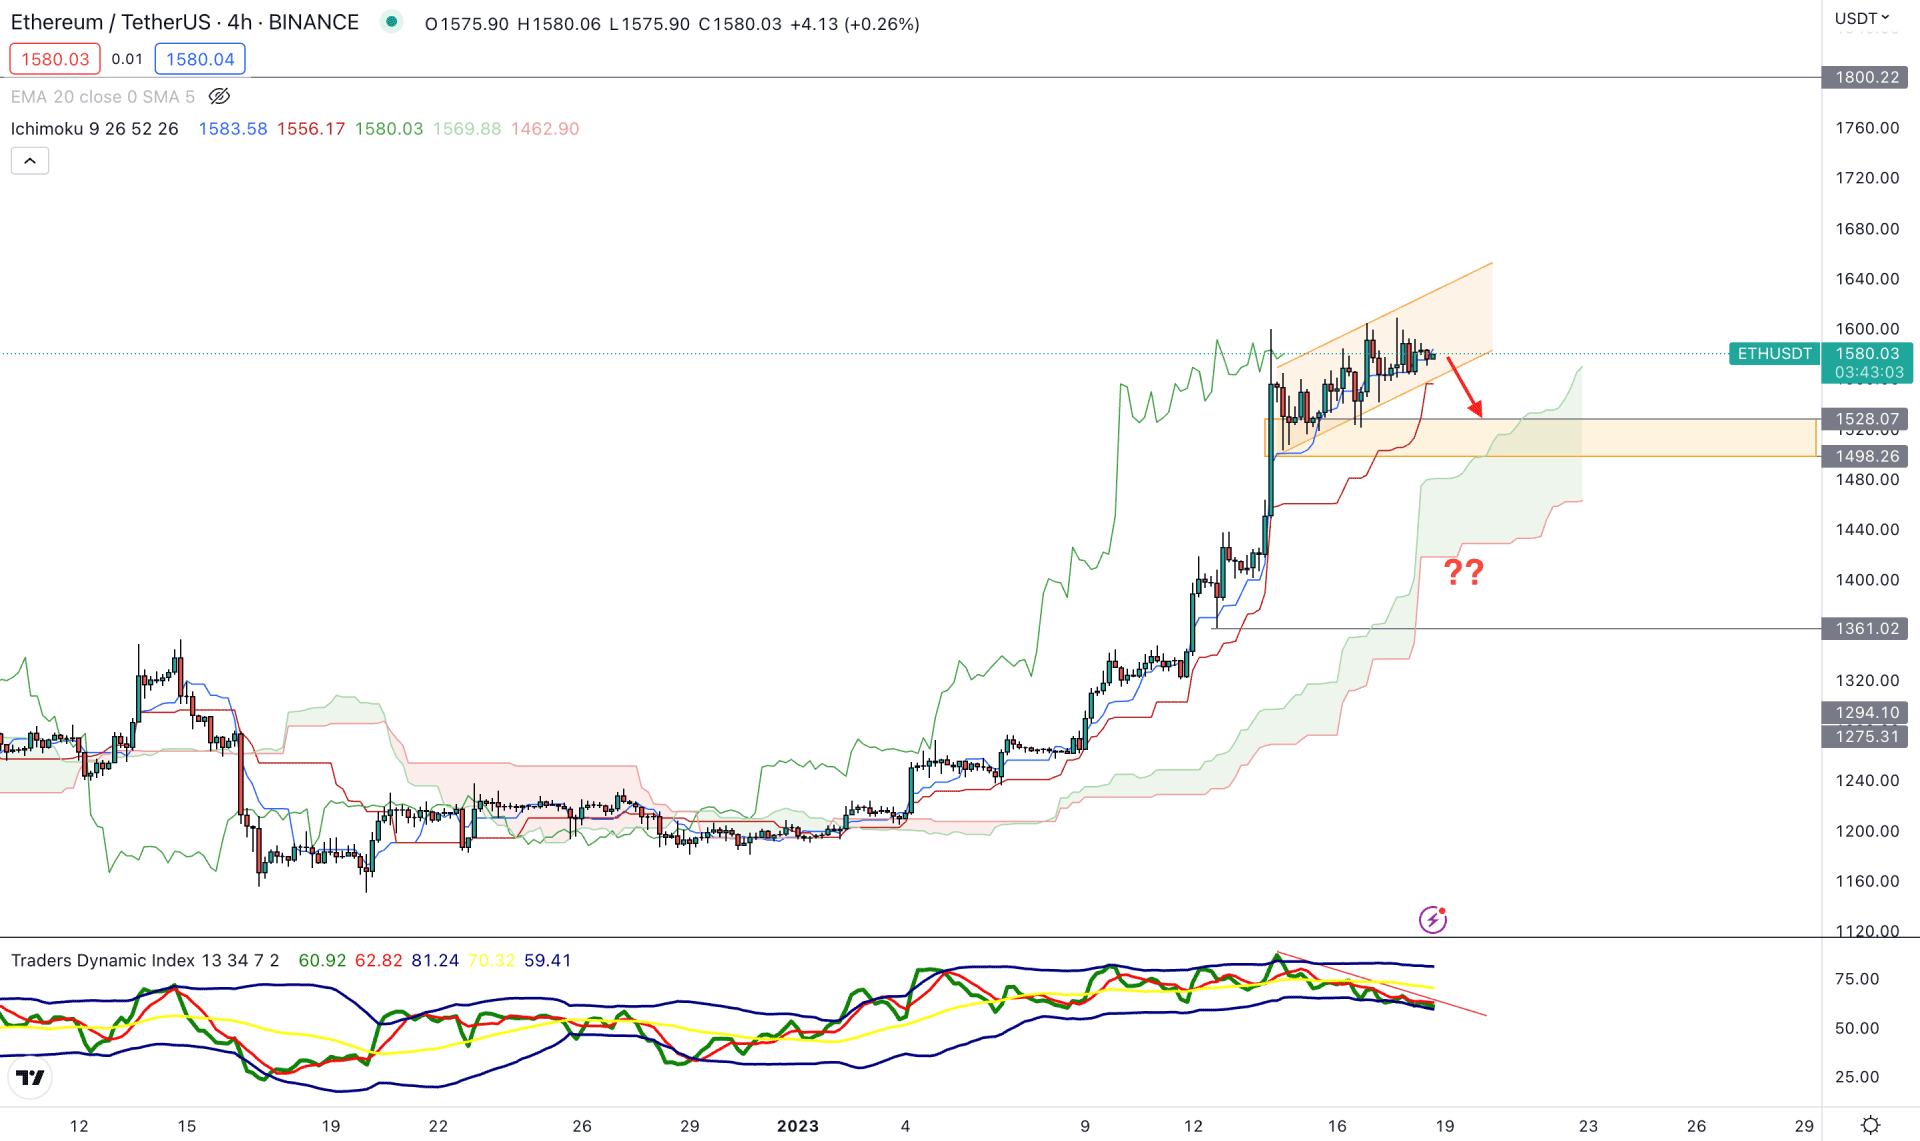
The price already showed a bullish signal in the daily chart, where a bearish correction and bullish rejection in the H4 timeframe could offer a trading opportunity.
However, the current price is losing the bullish momentum as shown in the chart, where the divergence between the price and Traders Dynamic Index (TDI) is visible.
On the other hand, the current bullish trend is still strong as shown in the future cloud. The gap between the Senkou Span A and B is showing strong buying pressure in the market, where the current Lagging Span is above the price.
Based on the H4 outlook, the first possible buy zone would be the 1528.07 to 1495.00 area but breaking below the 1490.00 level could increase the possibility of testing the 1361.00 level. Investors should keep a close eye on these levels and wait for a valid bullish rejection before opening a long position.
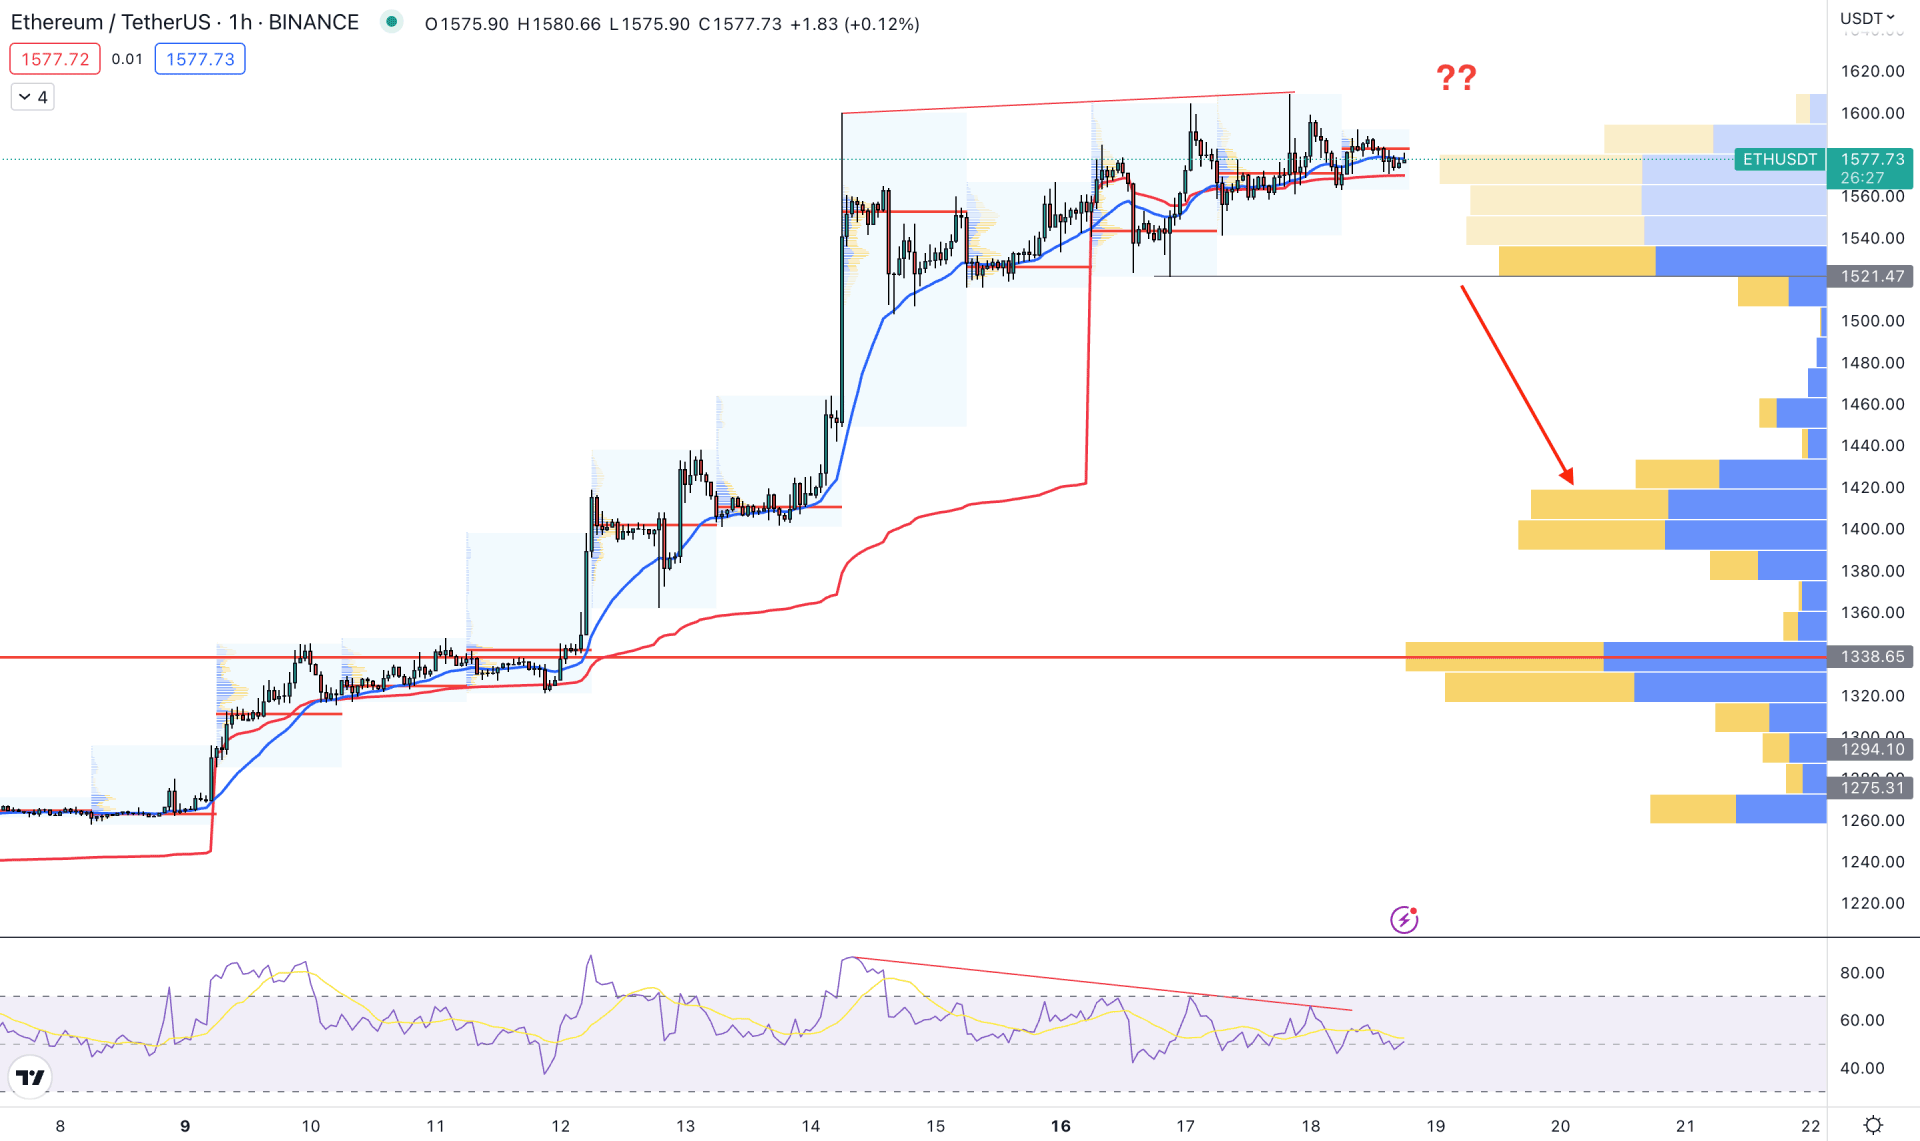
The situation is different in the H1 timeframe as the current price is extremely corrective at the top. Moreover, the gap between the current price and visible range high volume level is extended.
The current high volume level from 8 January 2023 to 18 January 2023 is marked at 1338.65 level, which is 16% below the current price. Moreover, a divergence is visible from the Relative Strength Index indicator, where the indicator is failing to make new highs.
The dynamic 20 EMA and weekly VWAP are closer to the price, which is a sign of a possible breakout.
Based on this price structure, a minor bearish correction is possible and any selling pressure below the 1521.47 level could extend the price toward the 1400.00 area.
Investors should closely monitor the 1521.47 support level from where any bullish rejection could offer a long opportunity. However, breaking below the 1500.00 level could lower the price in the coming hours.
Based on the current price outlook, the broader market structure for ETH/USDT is bullish where any minor bearish correction could offer a long opportunity. Investors should closely monitor near-term high volume levels to find the best place to join the rally.


