
Published: May 5th, 2026
As per the latest report, $81.6 million was withdrawn from Ethereum funds. As a result, the decline ended a three-week run of inflows averaging more than $190 million.
The weekly total for digital asset funds was $117.8 million, the lowest amount of the current period. The total assets under management remained relatively unchanged from the previous reading, hovering at $155 billion.
The headline figure, however, obscures a significant fluctuation during that time. Products lost $619 million between Monday and Thursday. cont
In contrast, Bitcoin funds raised $192.1 million, increasing overall annual assets to $4.2 billion. The weekly total fell short of the approximately $1 billion median for the previous three weeks. $6 million was added by short-bitcoin products.
The regional flows shifted away from the US. After contributing $1.1 billion the week before, the nation only contributed $47.5 million. The upcoming week turns into a spotless test. The argument that organizations, not retail, are motivating the bid would be strengthened by another Friday-style comeback.
Let's see further outlook from the ETH/USDT analysis:
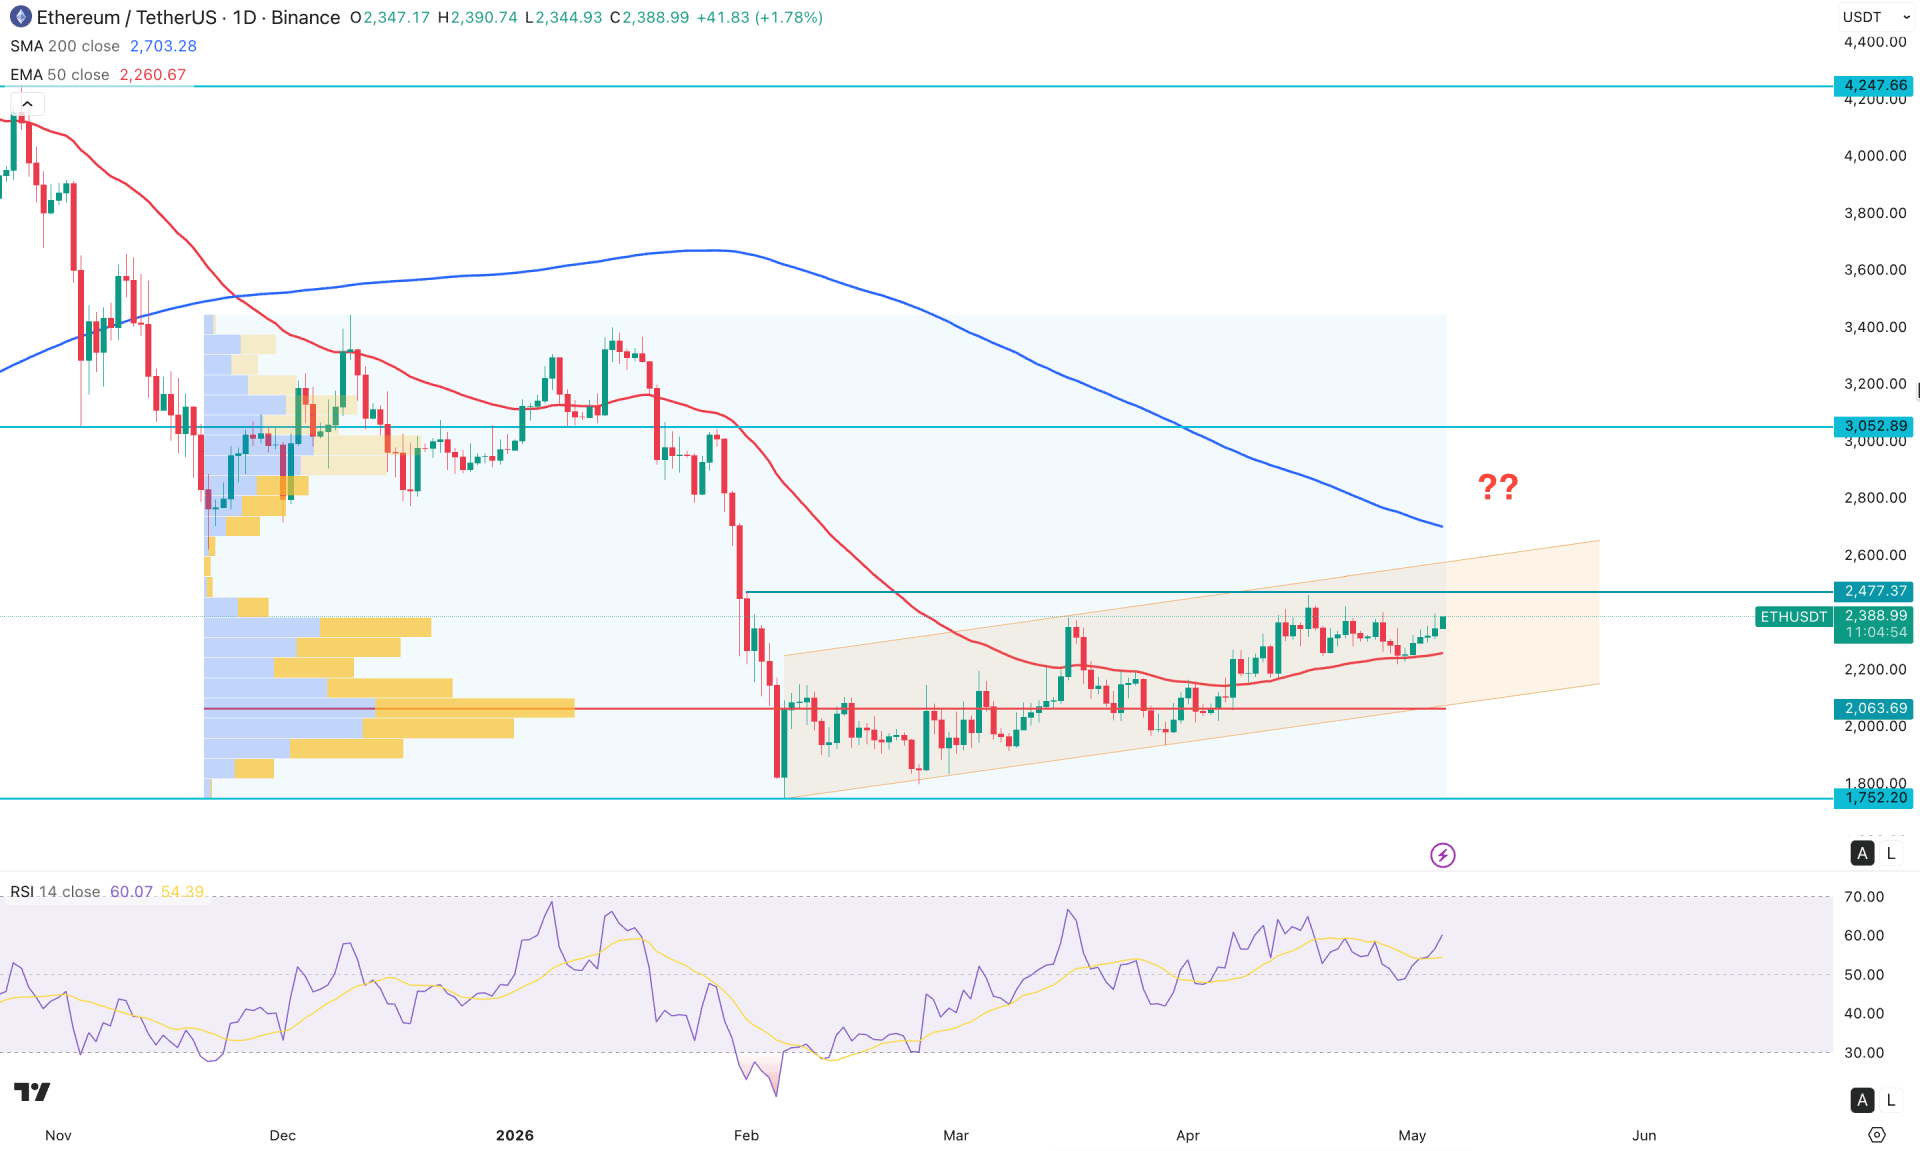
In the daily chart of ETH/USDT, the major market momentum shows that the most recent price is under corrective pressure from the bottom. As the price is approaching the zone, it is extending toward the channel resistance.
Looking at the higher timeframe, the price is trading at the extreme discounted zone as the monthly chart suggests a valid bottom at the 1752.20 level. From this area, multiple monthly bullish candles are visible, but the strength of the buying pressure is not satisfactory. The weekly timeframe shows the same picture, where the recent price is trading sideways after having minor buying pressure.
In terms of volume, the buying pressure is valid as the most active level since November 2025 is below the current price. Primarily, valid bullish pressure is seen from the recent bottom, but investors should remain cautious as the price is trading within an extended bear phase, from where sufficient bullish signals are needed before validating the reversal.
In the main price chart, an ascending channel formation is clear, and the current price is approaching the resistance level. The term dynamic resistance is the 200-day simple moving average, which is above the current price. Moreover, the recent price showed a decent bullish recovery after testing the 50-day EMA, which is a crucial bullish factor.
In the indicator window, the RSI is showing a bullish response after testing the 50.00 midline. After testing the 30.00 oversold level in February 2025, the RSI never tested the 70.00 level, which is likely to be tested soon.
Based on the current market structure, investors should closely monitor the 2477.37 static resistance line. A bullish break above this level with a daily candle could open room for reaching the 3000.00 psychological level.
On the other hand, a bullish continuation with failure to overcome the 200 SMA could increase bearish opportunities. From the current price area, immediate pressure is also possible, or a break below the 50-day EMA could increase the possibility of a channel breakdown.
However, long-term bearish pressure needs a valid break below the 2063.69 high-volume support level before testing the 1752.20 key support line.
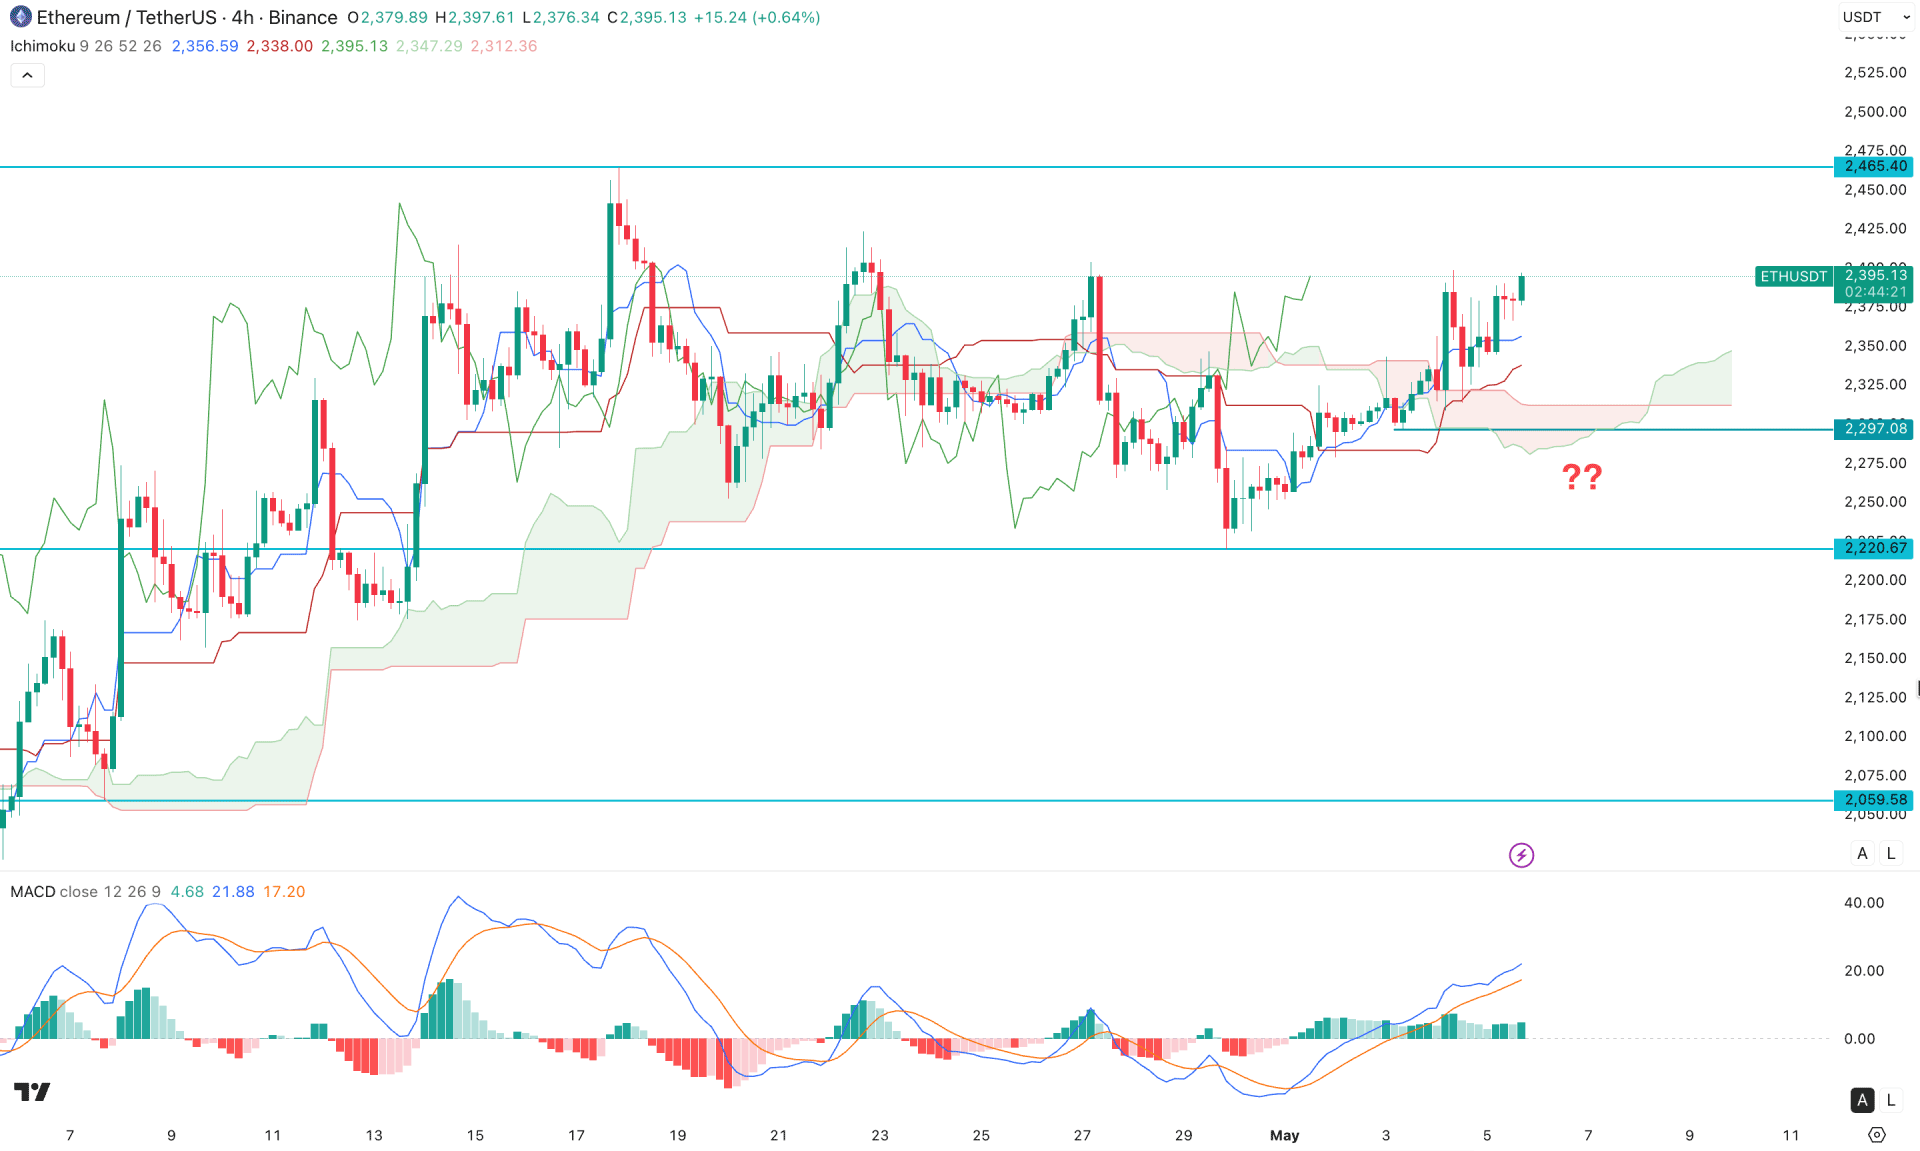
In the four-hour timeframe, ETH/USDT is trading within a corrective bullish momentum, where the recent price showed a strong sell-side liquidity sweep before forming a bullish cloud breakout. The most recent price is above the cloud support and has multiple bullish candles above the dynamic support line. As a result, the future cloud has shifted position, while both lines are heading upward with a bullish possibility.
In the indicator window, the MACD indicator remains steady above the neutral line, where the signal line is hovering in the premium zone.
Based on this market outlook, the bullish momentum is valid as long as the price remains above the Kumo cloud area. A minor downside recovery is possible, but the buying pressure could extend as long as the price remains above the 2297.08 swing low. On the bullish side, immediate resistance is at the 2465.40 level, and a move above this line could open room for moving beyond the 2500.00 area.
On the other hand, a bearish four-hour candle below the 2297.08 level could increase the possibility of testing the 2220.60 level. A failure to hold the price at that level could initiate a deeper decline towards the 2059.58 area.
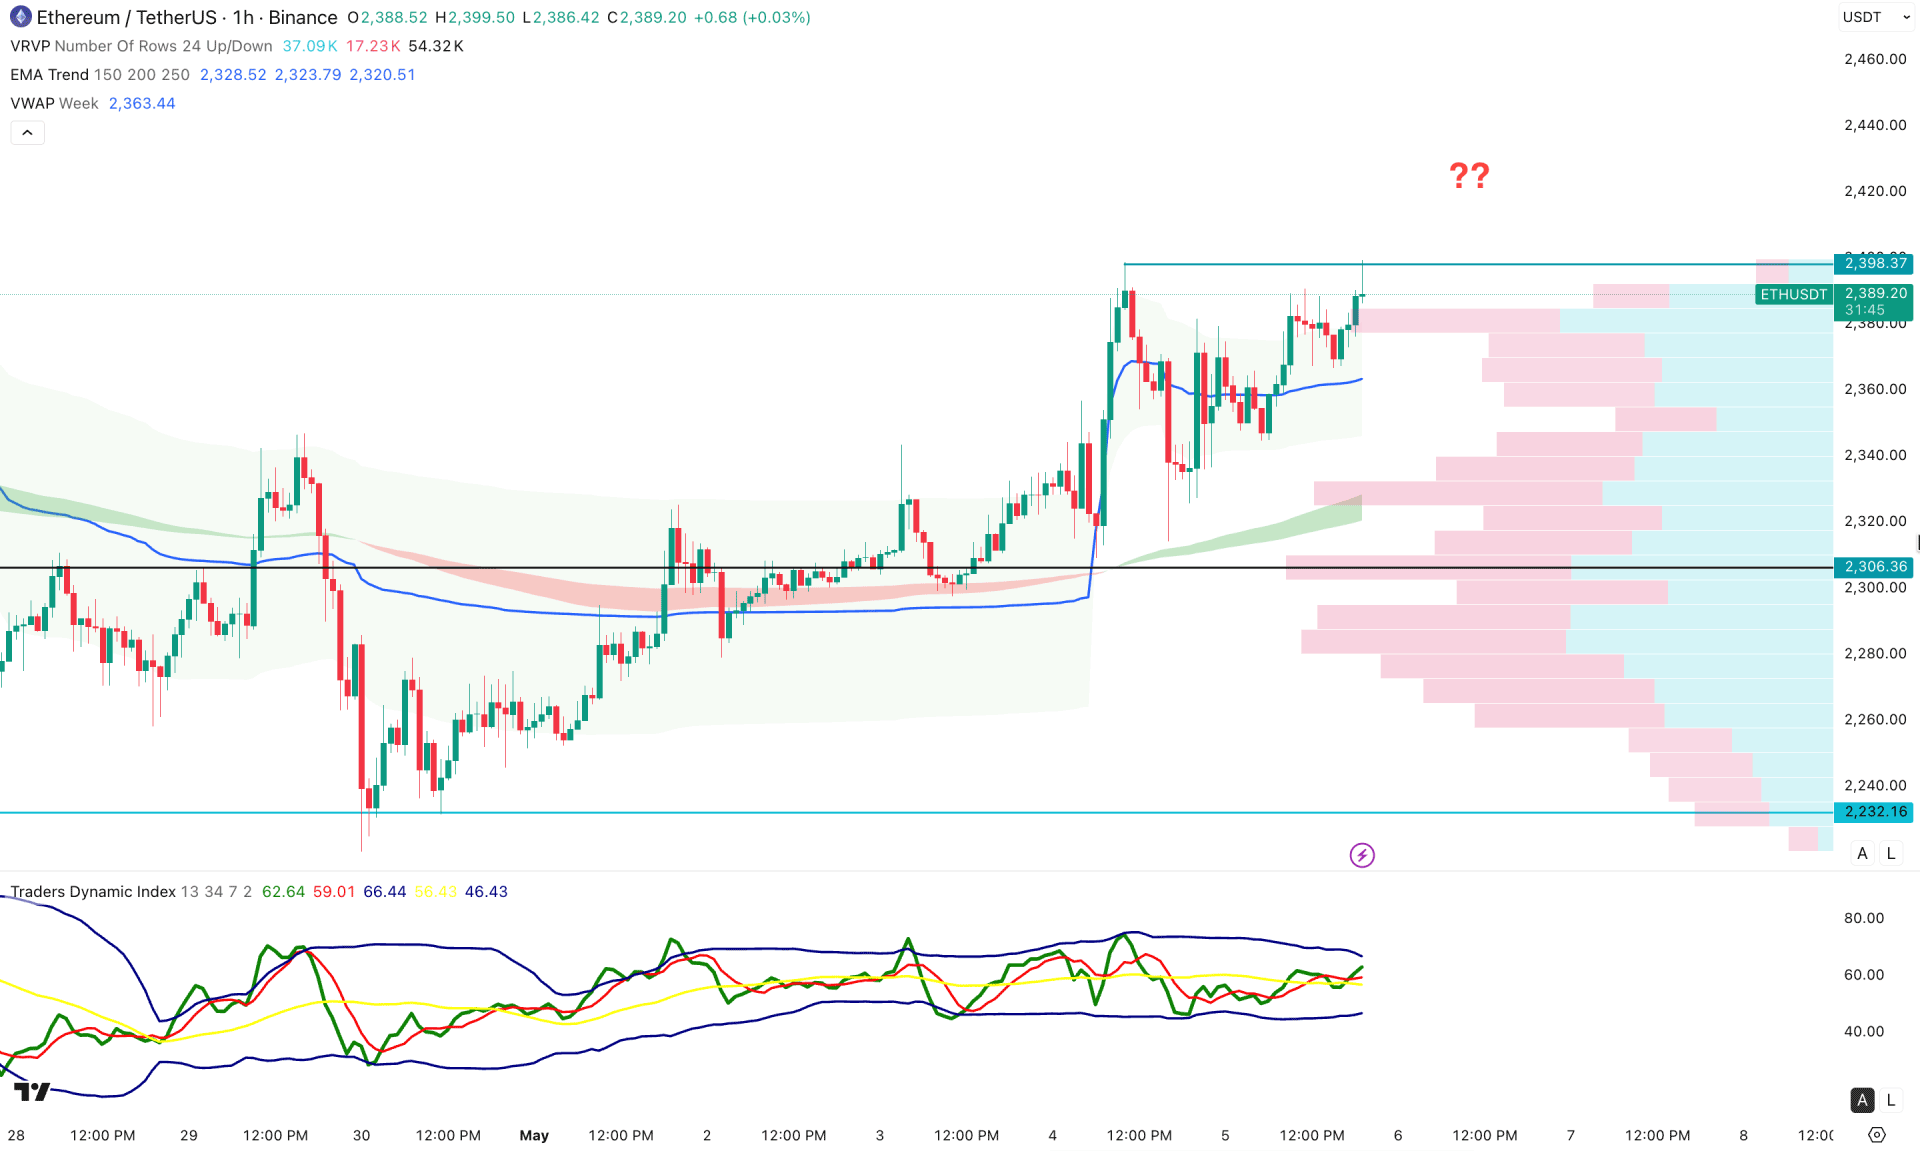
In the hourly timeframe, the ETH/USDT price is trading under extremely volatile conditions, where the most recent price is at the intraday peak. Although the major market momentum is bullish on the chart, the extended volatility at the top signals a possible downside correction.
The intraday support line is marked at the 2306.36 level, which is below the weekly VWAP support. As long as the current price remains above the weekly VWAP support, the price is likely to extend higher.
In the secondary indicator, the Traders Dynamic Index shows minor bullish pressure, as the current TDI line has a slope above the 50.00 neutral level.
Based on this market outlook, the immediate resistance is at the 2398.37 level, and failure to overcome this line could increase the possibility of a downside move. A bearish hourly candle below the VWAP support level can take the price below the 2306.36 level.
On the other hand, the 2340.00–2300.00 area would be a strong zone for a bullish rebound, which aligns with the VWAP line and could open long opportunities targeting the 2500.00 level.
Based on the market outlook, ETH/USDT is trading with minor bullish pressure, while the existing momentum remains intact. On the other hand, the price is trading at an extended discounted zone, which is attractive to long-term holders and buyers. In that case, investors should closely monitor the daily price outlook as the price is approaching a crucial channel resistance. Although a downside possibility is valid from the channel resistance, the major momentum can shift anytime as long as the channel low is protected.


