Published: May 21st, 2024
Ethereum (ETH) reached its highest level in two months, reaching $3,700, on the back of increased optimism regarding approving a spot ETH ETF. In the past twenty-four hours, Ethereum (ETH), the second-largest cryptocurrency in the world, has gained eighteen percent in value. This is due to increasing confidence in the prospective approval of a spot Ethereum ETF.
After Eric Balchunas, a senior analyst at Bloomberg, increased the probability of ETF approval from 25% to 75% on May 20, the price increase surpassed 18%. According to Balchunas, political pressure may be influencing the U.S. SEC, which has historically shown little interest in ETF registrants.
Even without official affirmation from the regulatory body, Balchunas observed that sources claim the SEC requests that exchanges such as NYSE and Nasdaq revise their filings. According to Nate Geraci, co-founder of the ETF Institute and president of the ETF Store, the final decision is still outstanding. He suggested that modifications to exchange rules (19b-4) might require approval distinctly from the registration of funds (S-1).
Due to the intricate nature and possible hazards linked to proof-of-stake (PoS) cryptocurrencies, the regulatory authority has been granted an extra timeframe to assess and sanction these documents.
A decision regarding the VanEck spot Ethereum ETF is expected on Thursday, May 23, which could result in substantial price fluctuations. Any favorable development can potentially increase the price of Ether to at least $4,000.
President Biden's position on cryptocurrencies is the subject of speculation, with some anticipating that he will adopt a more moderate posture before the election. Some consider this recent development concerning the Ethereum ETF to be an early sign of this possible transition. As a result of Trump's open support for cryptocurrencies, analysts believe the Biden administration may adopt a more crypto-friendly stance to prevent alienating potential voters during a contentious election.
Is it too late to buy ETH/USDT? Let's see the complete outlook from the ETH/USDT technical analysis:

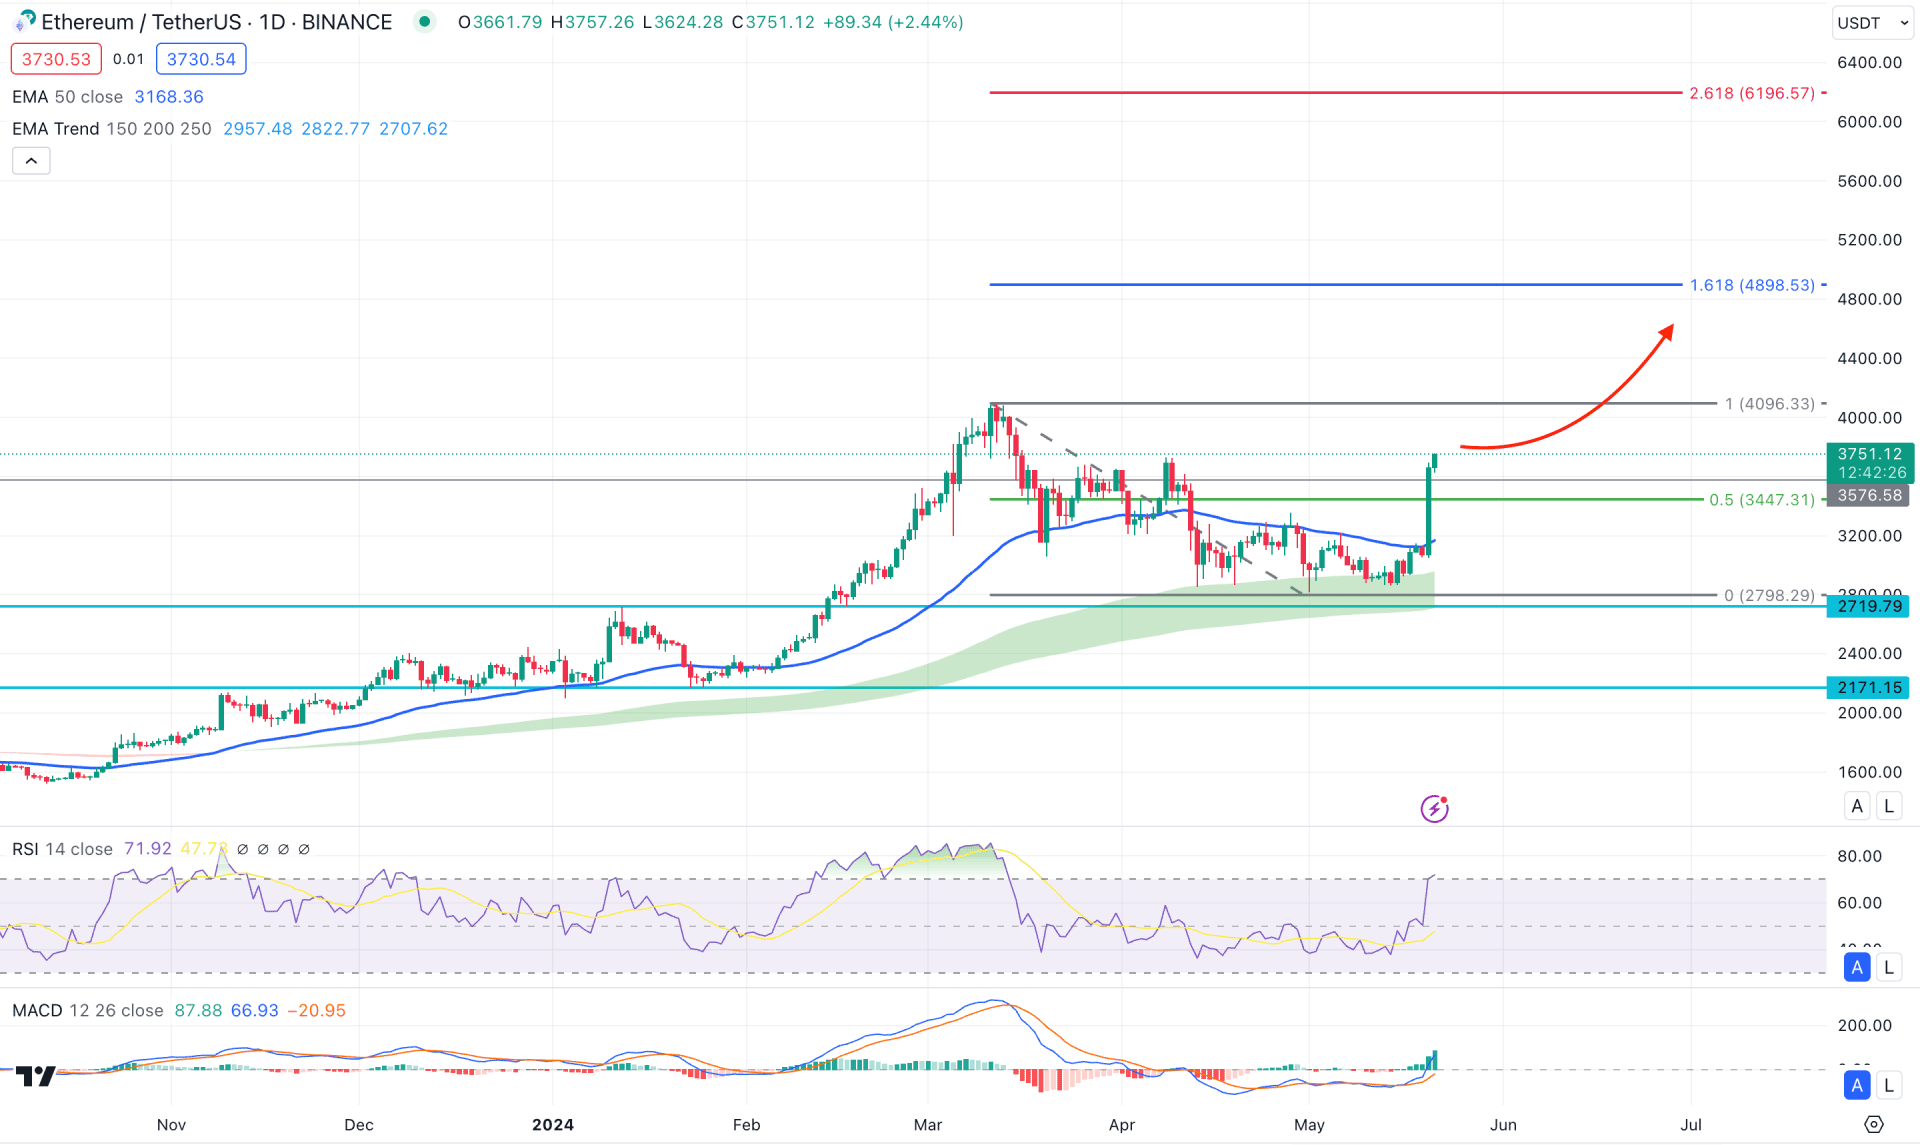
In the daily chart of ETH/USDT, the broader market direction is bullish, where the most recent price shows an extensive correction for more than three months. However, the higher timeframe’s price action is optimistic to bulls, which might create a long opportunity in the daily chart.
Looking at the monthly chart, the recent price trades higher after a bearish month in April 2024. The ongoing buying pressure in May is valid above April’s high, which needs proper validation by a bullish close before confirming the long-term market trend. In the weekly chart, the current candle is trading at 8 8-week high, creating a long opportunity from a range breakout.
In the daily chart, the MA cloud consists of 150, 200, and 250 lines that are working as a major support zone, from where the most recent bullish impulse has come. Moreover, a proper bottom formation is seen at the 2798.29 line before forming a bullish reversal.
In the indicator window, the 14-day Relative Strength Index (RSI) reached the 70.00 overbought level, creating a confluence bullish signal. The MACD Indicator shows the same outlook where the current Histogram is bullish, with no sign of a divergence.
Based on the daily outlook of ETH/USDT, the ongoing buying pressure is potent from the breakout above the 50-day EMA line. In that case, the buying pressure might extend, with the main aim of testing the 161.8% Fibonacci Extension level from the recent swing, which is at the 4898.53 level. Moreover, a bullish break and a consolidation above the 4096.33 level could extend the upward pressure at the 6000.00 psychological line.

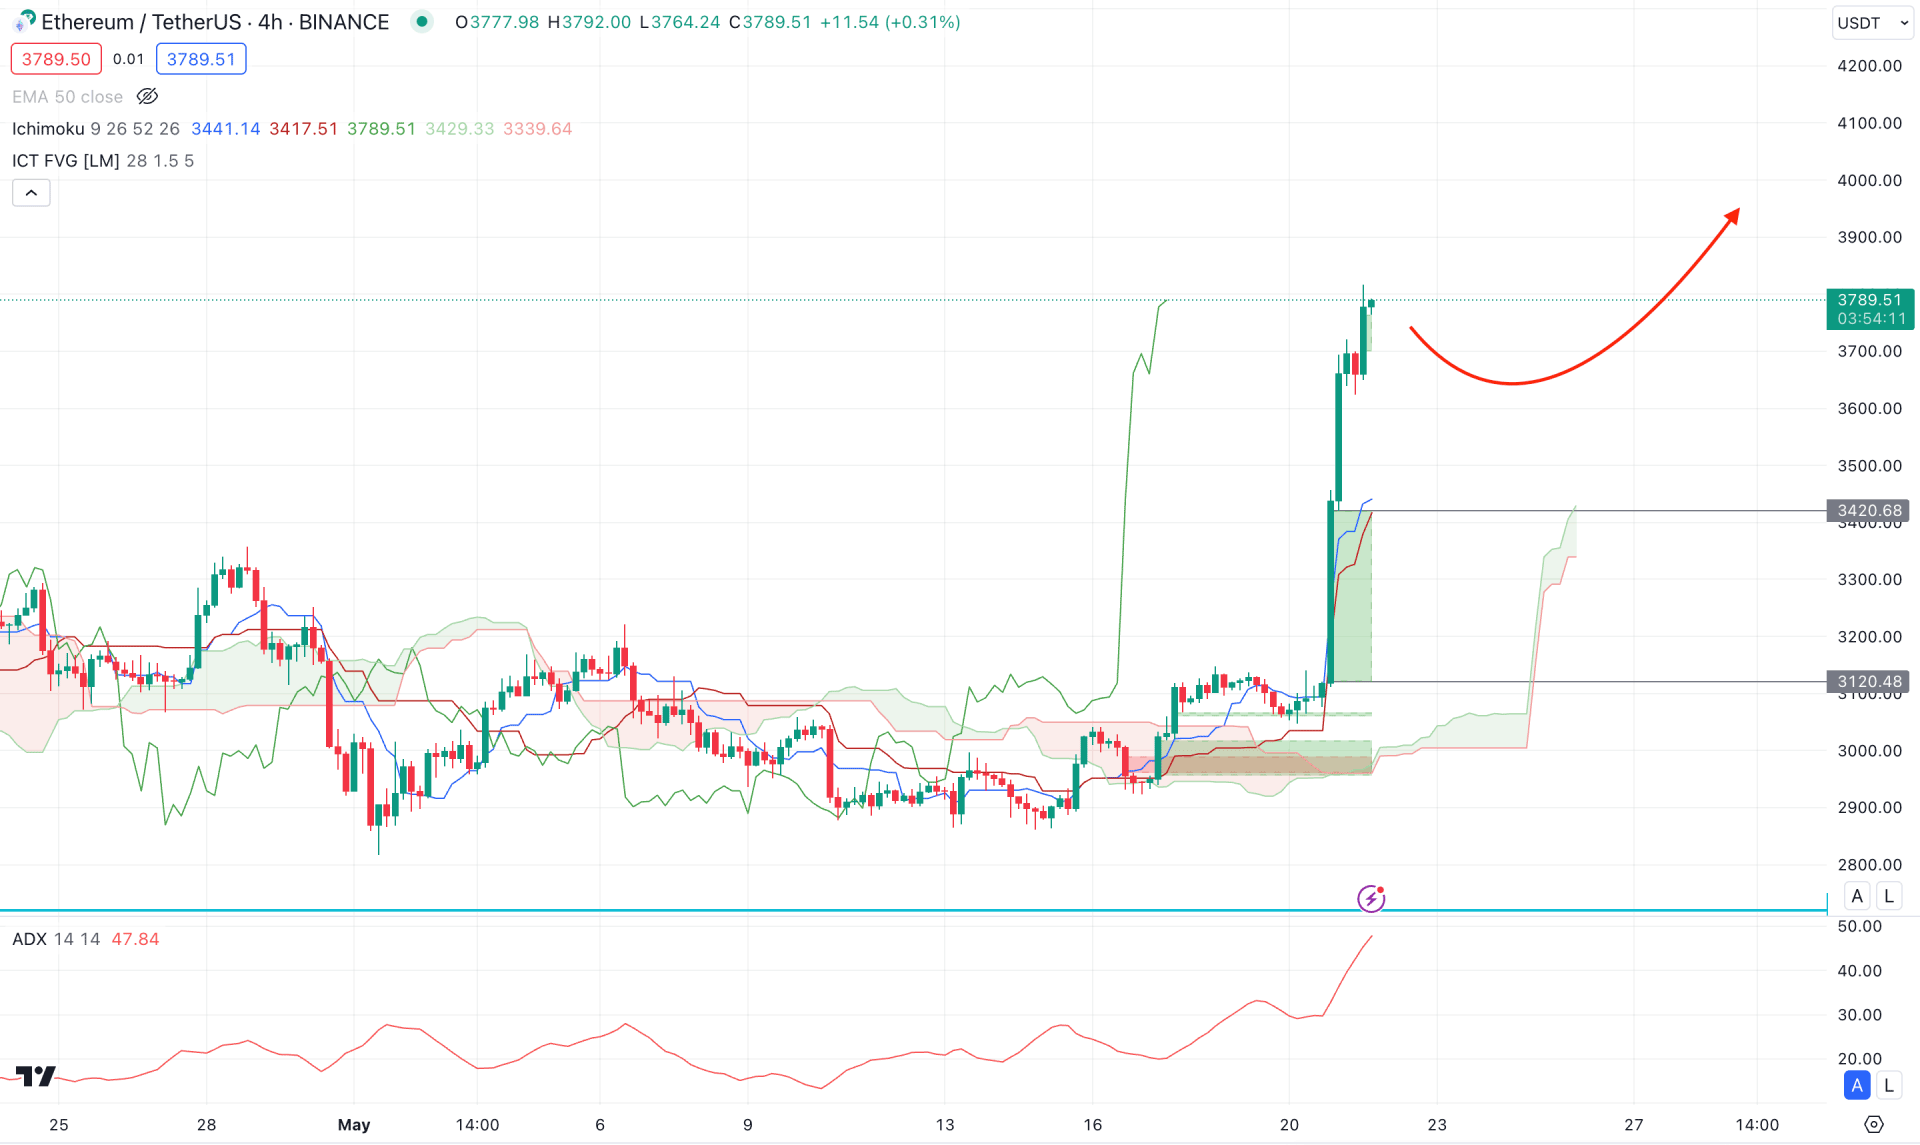
In the H4 timeframe, a bullish breakout is visible from the Ichimoku Cloud zone, suggesting a range breakout on the buyers’ side. Following the trend, the Futures Cloud suggests a bullish continuation, where the Senkou Span A is above the Senkou Span B.
In the secondary window, the Average Directional Index (ADX) reached its highest level since the last 2 months, suggesting an active buying pressure in the market.
Based on the H4 ETH/USDT chart, the recent bullish impulse created a far value gap at the 3420.68 to 3210.48 zone, which could be the primary target of a downside correction. On the other hand, immediate buying pressure is possible from the current area, where the primary target would be the 5000.00 psychological line.

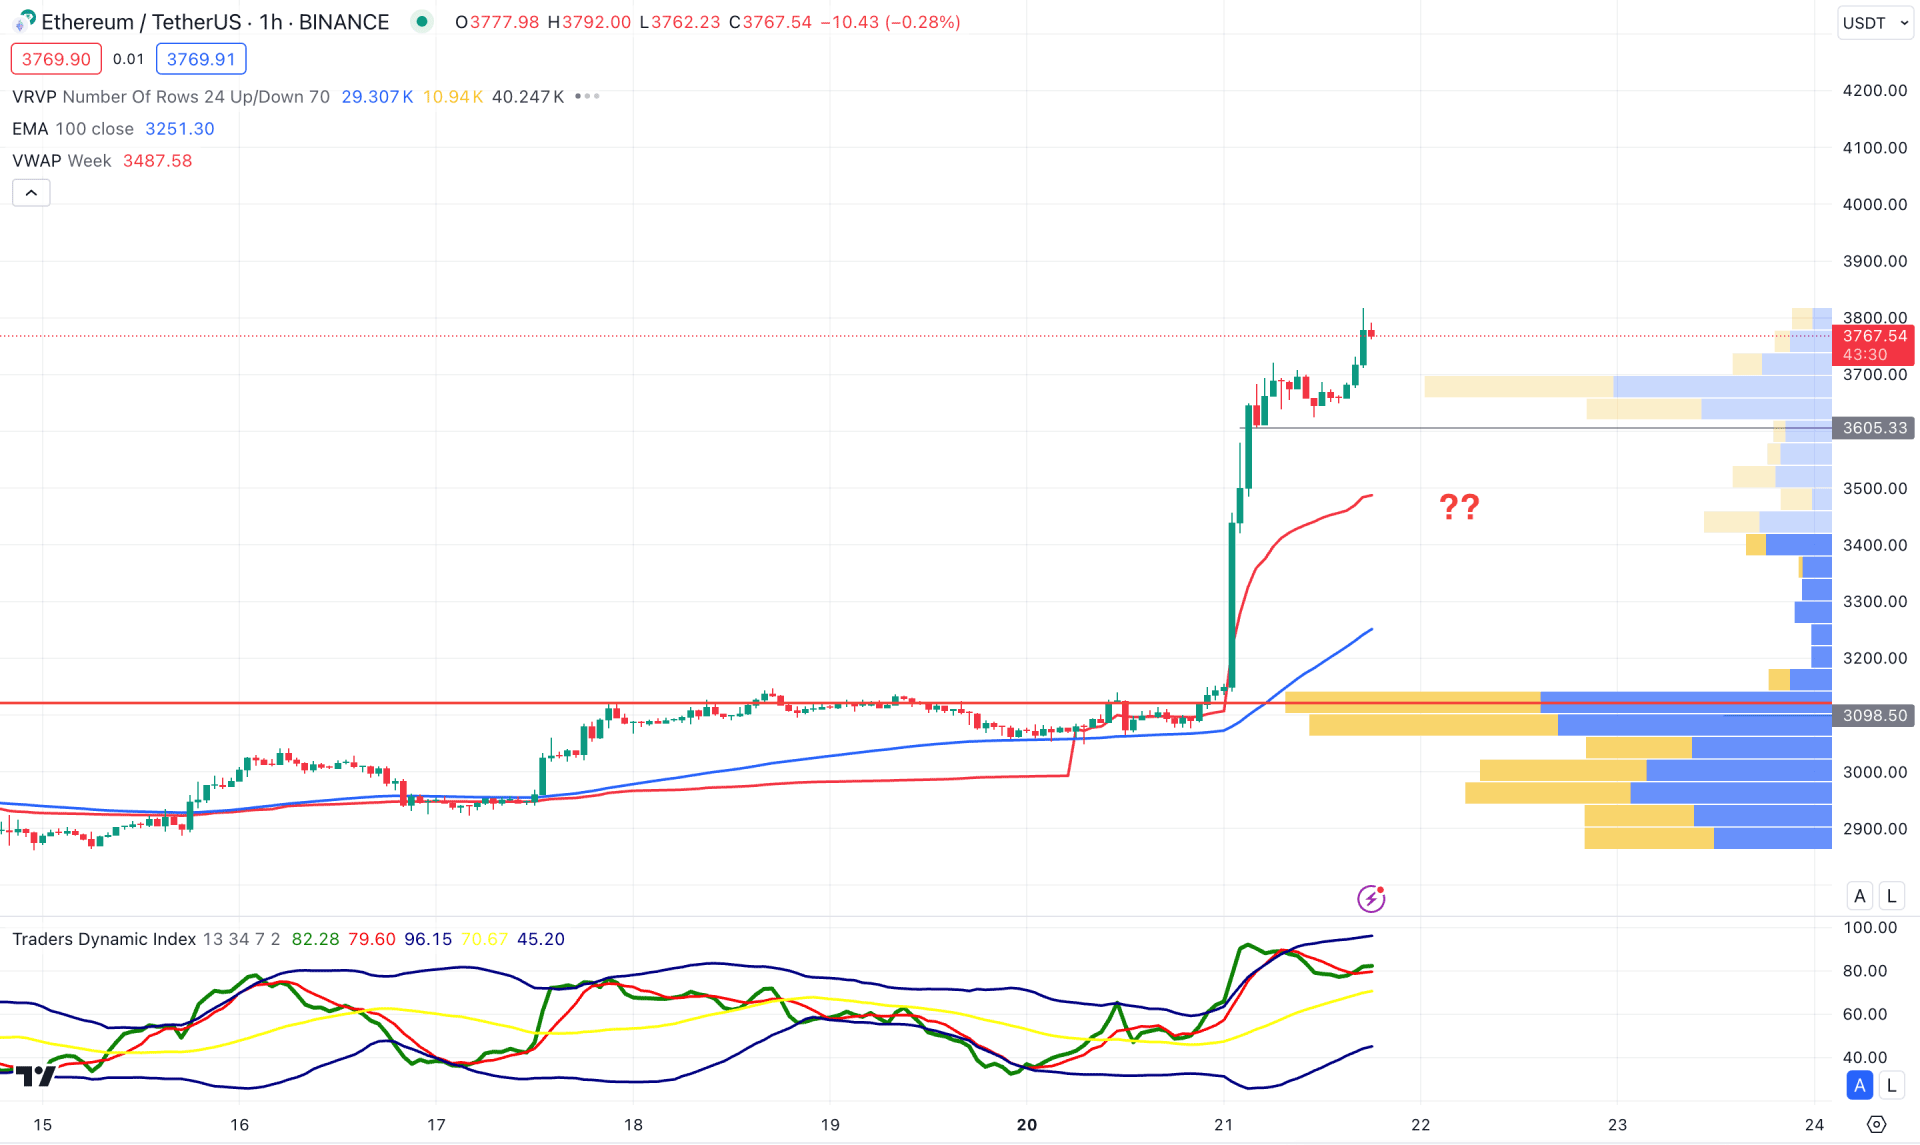
In the hourly chart, the current buying pressure is potent above the visible range high volume line, creating a downside possibility as a mean reversion.
The 100-hour EMA is below the current price and hovering below the weekly VWAP line. It is a sign that bulls are still active in the market and can rebound the price at any time.
The indicator window showed a different story, where the current Traders Dynamic Index (TDI) showed a divergence with the current swing.
Based on the H1 chart of ETH/USDT, an immediate bearish pressure with an hourly close below the 3600.00 level could extend the downside pressure toward the 100 EMA line. However, any bullish reversal from the dynamic VWAP line could resume the existing trend at any time.
Based on the ongoing price action, ETH/USDT could extend the buying pressure at any time. Investors should closely monitor the intraday price, where a sufficient downside correction is pending, before extending the bull run.