
Published: July 21st, 2022
Ethereum’s native token Ether (ETH) gained 48% over the last seven days, outperforming its counterpart Bitcoin, which managed to gain almost 19% in the same period. Moreover, the current buying pressure on Ethereum came from the $918 bottom on 19 June 2022, where a new bull trend may appear.
However, the real question is whether the current buying pressure in the ETH/USDT chart is solid or not. Based on the macroeconomic factors, the current buying pressure could be a bull trap, and the geopolitical outlook is getting darkening. In that case, there is a higher possibility of grabbing the buy-side liquidity in crypto assets and continuing to move down after making new swing highs.
On the other hand, Ethereum has experienced merging news that would reduce energy consumption by more than 99%. However, the upgrade will now reduce the transaction fees significantly. As per the current projection, the margin event will come after the Goerli testnet Merge, which will appear on 11 August 2022.
Can Ethereum’s bullish break extend the buying pressure? Let’s see the future price direction of Ether from the ETH/USDT Technical analysis:
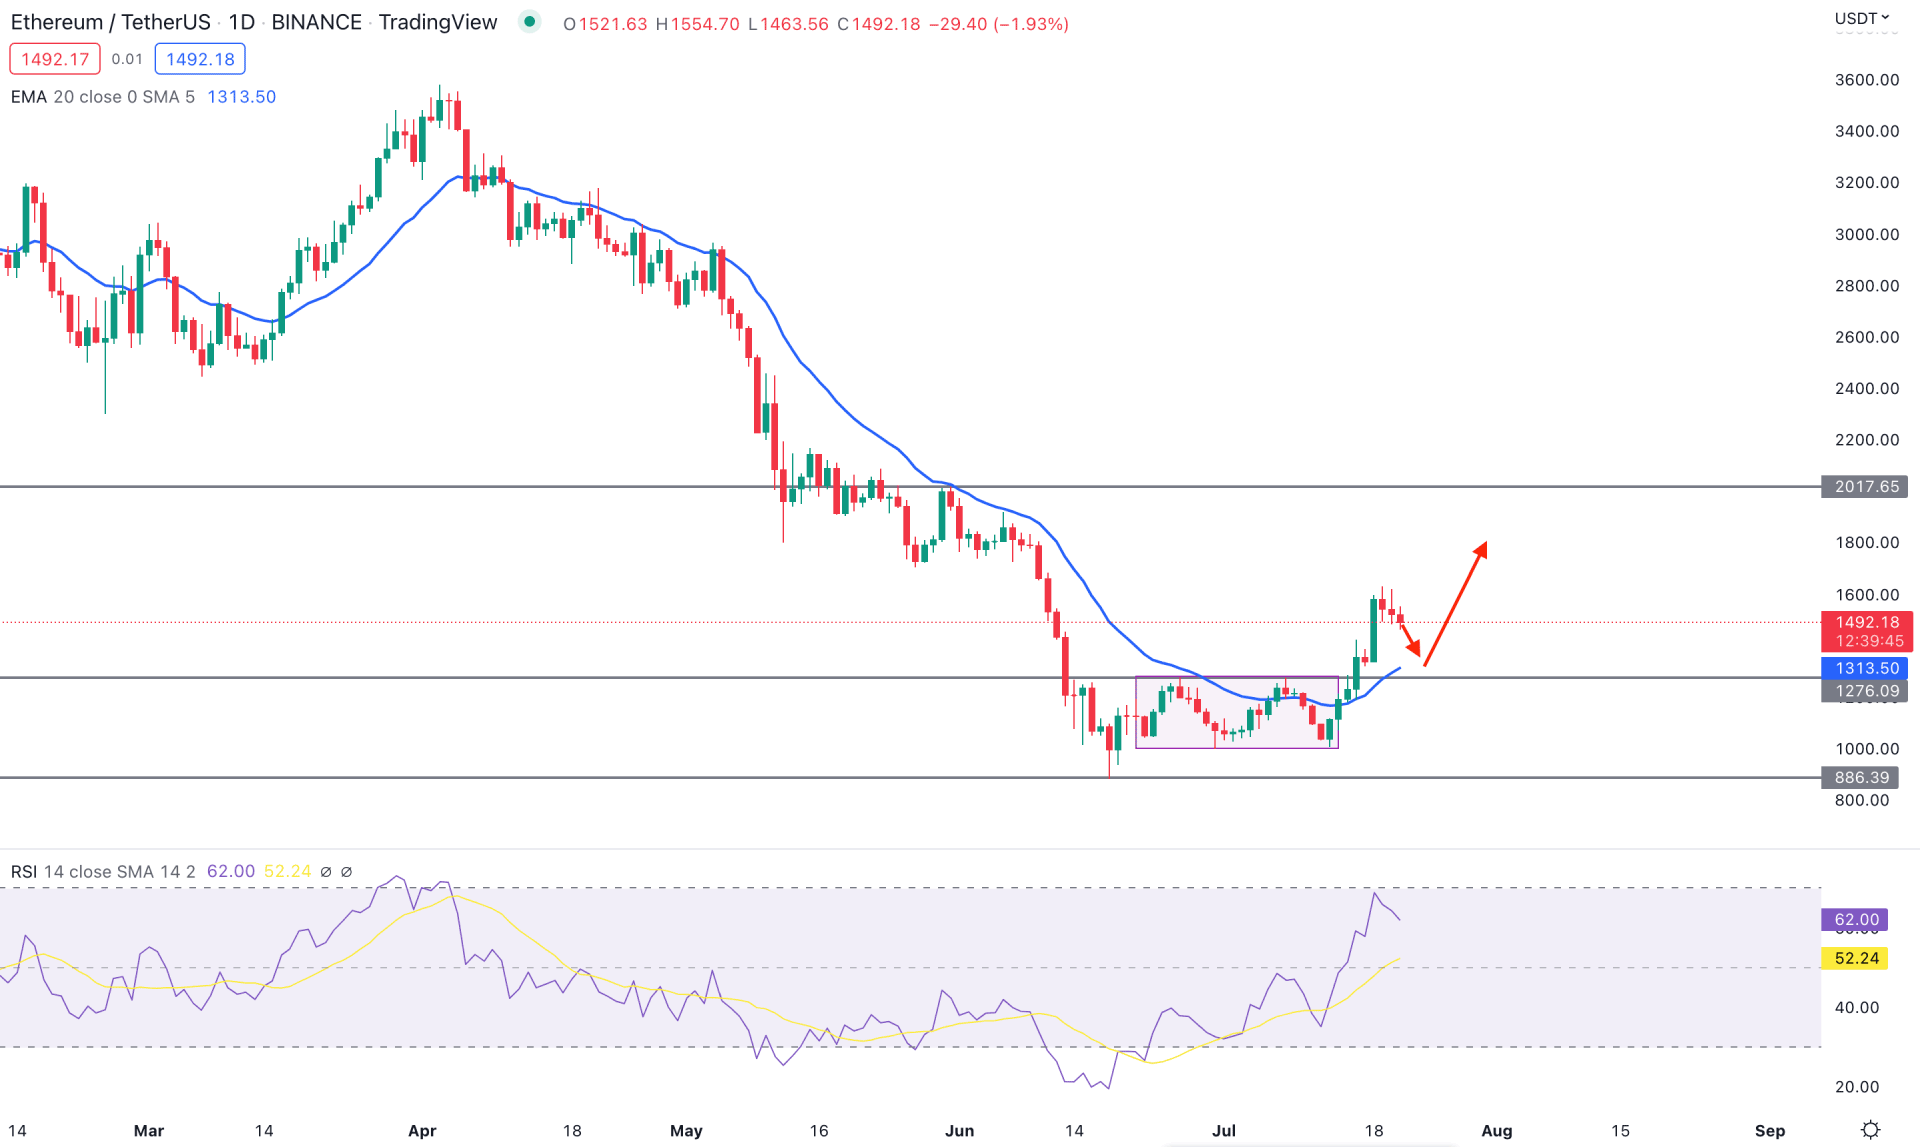
The long-term selling pressure in the ETH/USDT daily chart is visible; the price is still 58% down from the April 2022 peak. During the previous bearish rally, the price tested the 20-day moving average multiple times but failed to hold the momentum above it. Mid-June's corrective price action pushed investors' sentiment sideways within a rectangle pattern. Finally, the price moves above the confluence support from the dynamic 20 EMA breakout.
The indicator window showed buying pressure from the Relative Strength Index (RSI), which moved above the 50% neutral line and reached the 70% line. Although the current RSI level is within the 50 to 70 zone, it is more likely to move above the 70% overbought zone.
Based on the daily price structure, investors should consider the upcoming price action bullish as the current price trades above the 1276.00 horizontal support level. In that case, any minor bearish correction and buying pressure from the 1350.00 to 1270.00 zone would be a bullish opportunity in this pair toward the target of the 2000.00 psychological level.
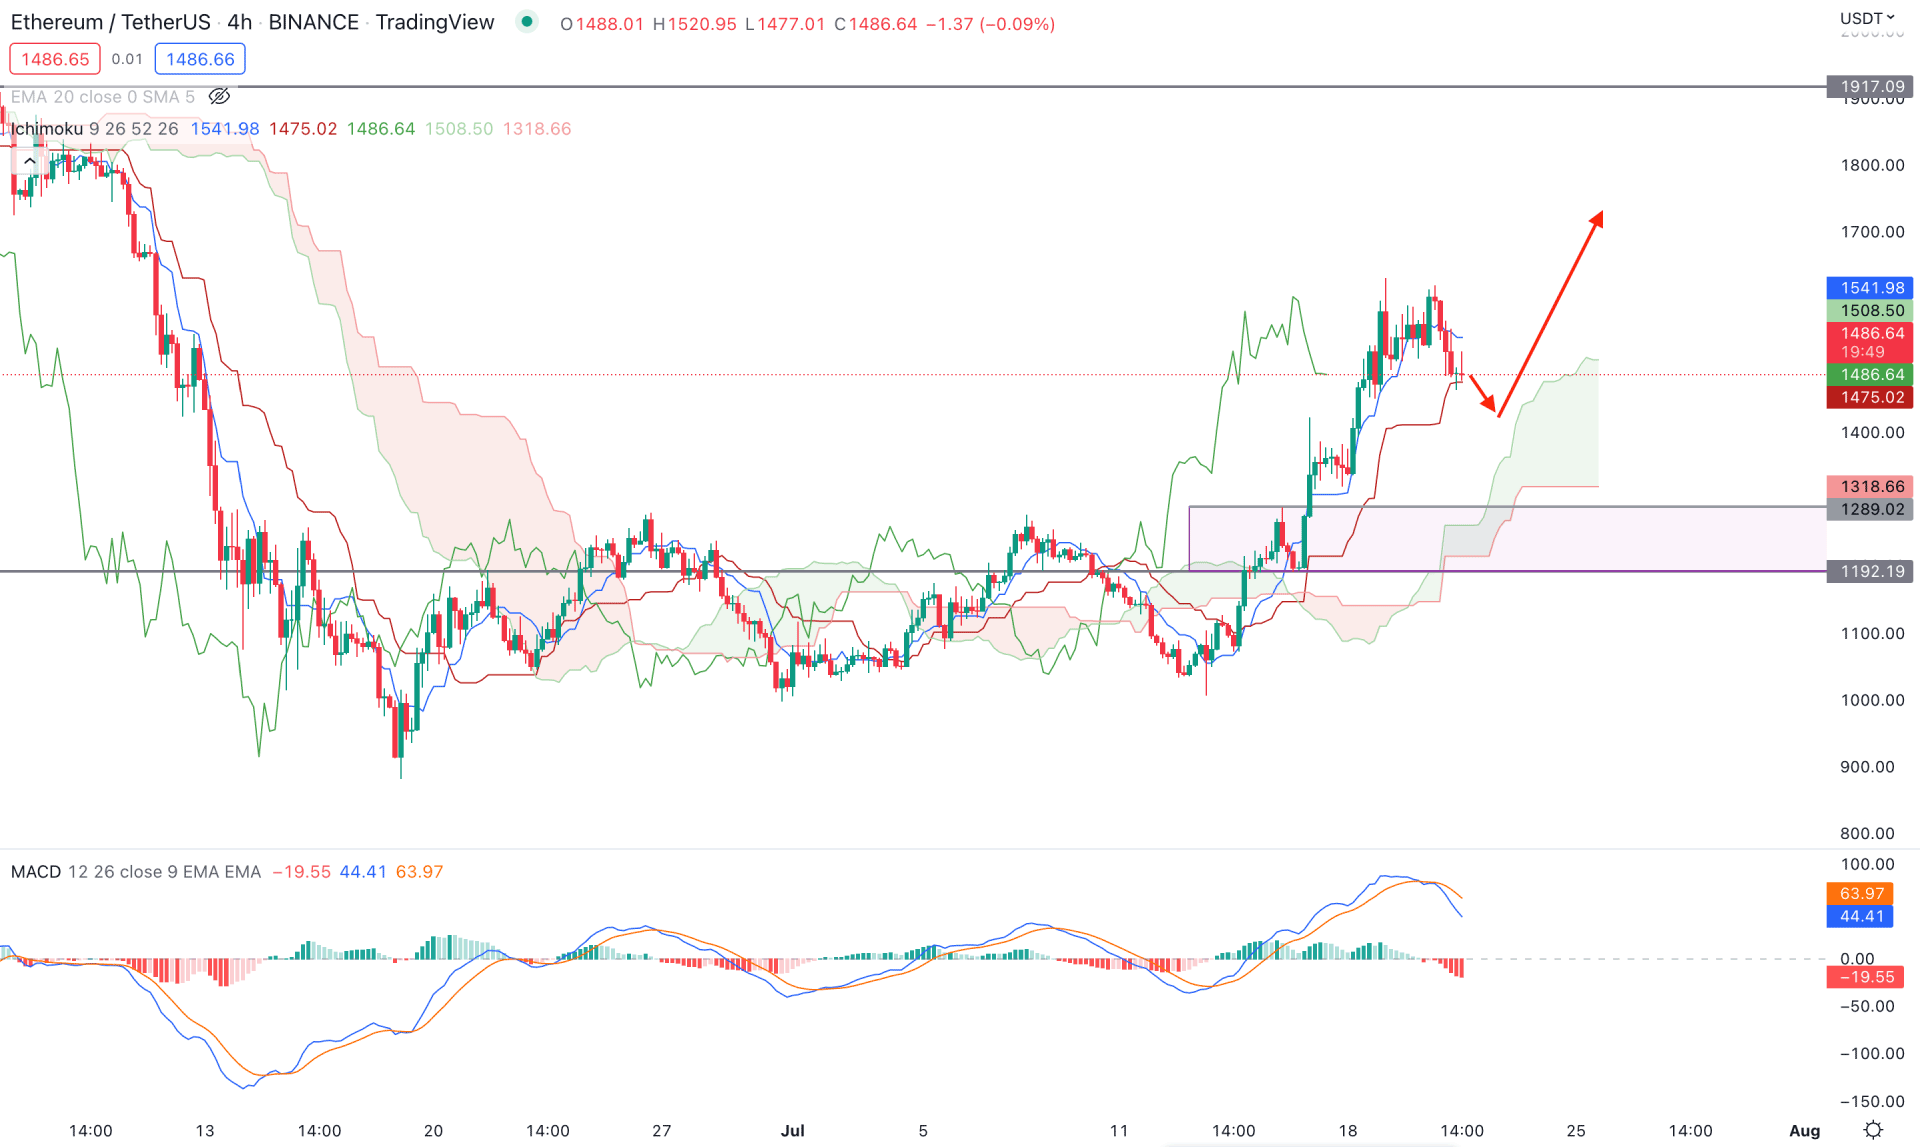
According to the Ichimoku Cloud, the intraday trend of ETH/USDT is clearly bullish as the current price trades above the Kumo Cloud for a considerable time. Moreover, the thickness in the future cloud is solid for buyers where the Senkou Span A is above the Senkou Span B with a string gap. In that case, any minor correction towards the dynamic Kijun Sen and recovery would be a bullish opportunity in this pair, where the main aim is to test the 1917.00 resistance level.
The indicator window shows the MACD Histogram where the current Histogram level is below the neutral zero line. The EMA is above the neutral line and sloping down, indicating that the price has found a top, from where a bearish correction may appear. On the other hand, the dynamic Kijun Sen is below the price, but Tenkan Sen is above the price. It signifies a corrective price action where breaking below the Kijun Sen line would increase the selling pressure.
Based on the H4 price action, a minor bearish correction is pending in this pair. However, the first bullish opportunity may come from the dynamic Kijun Sen with a bullish H4 close. However, breaking below the Kijun Sen line, the price drops towards the 1289.00 to 1192.00 zone.
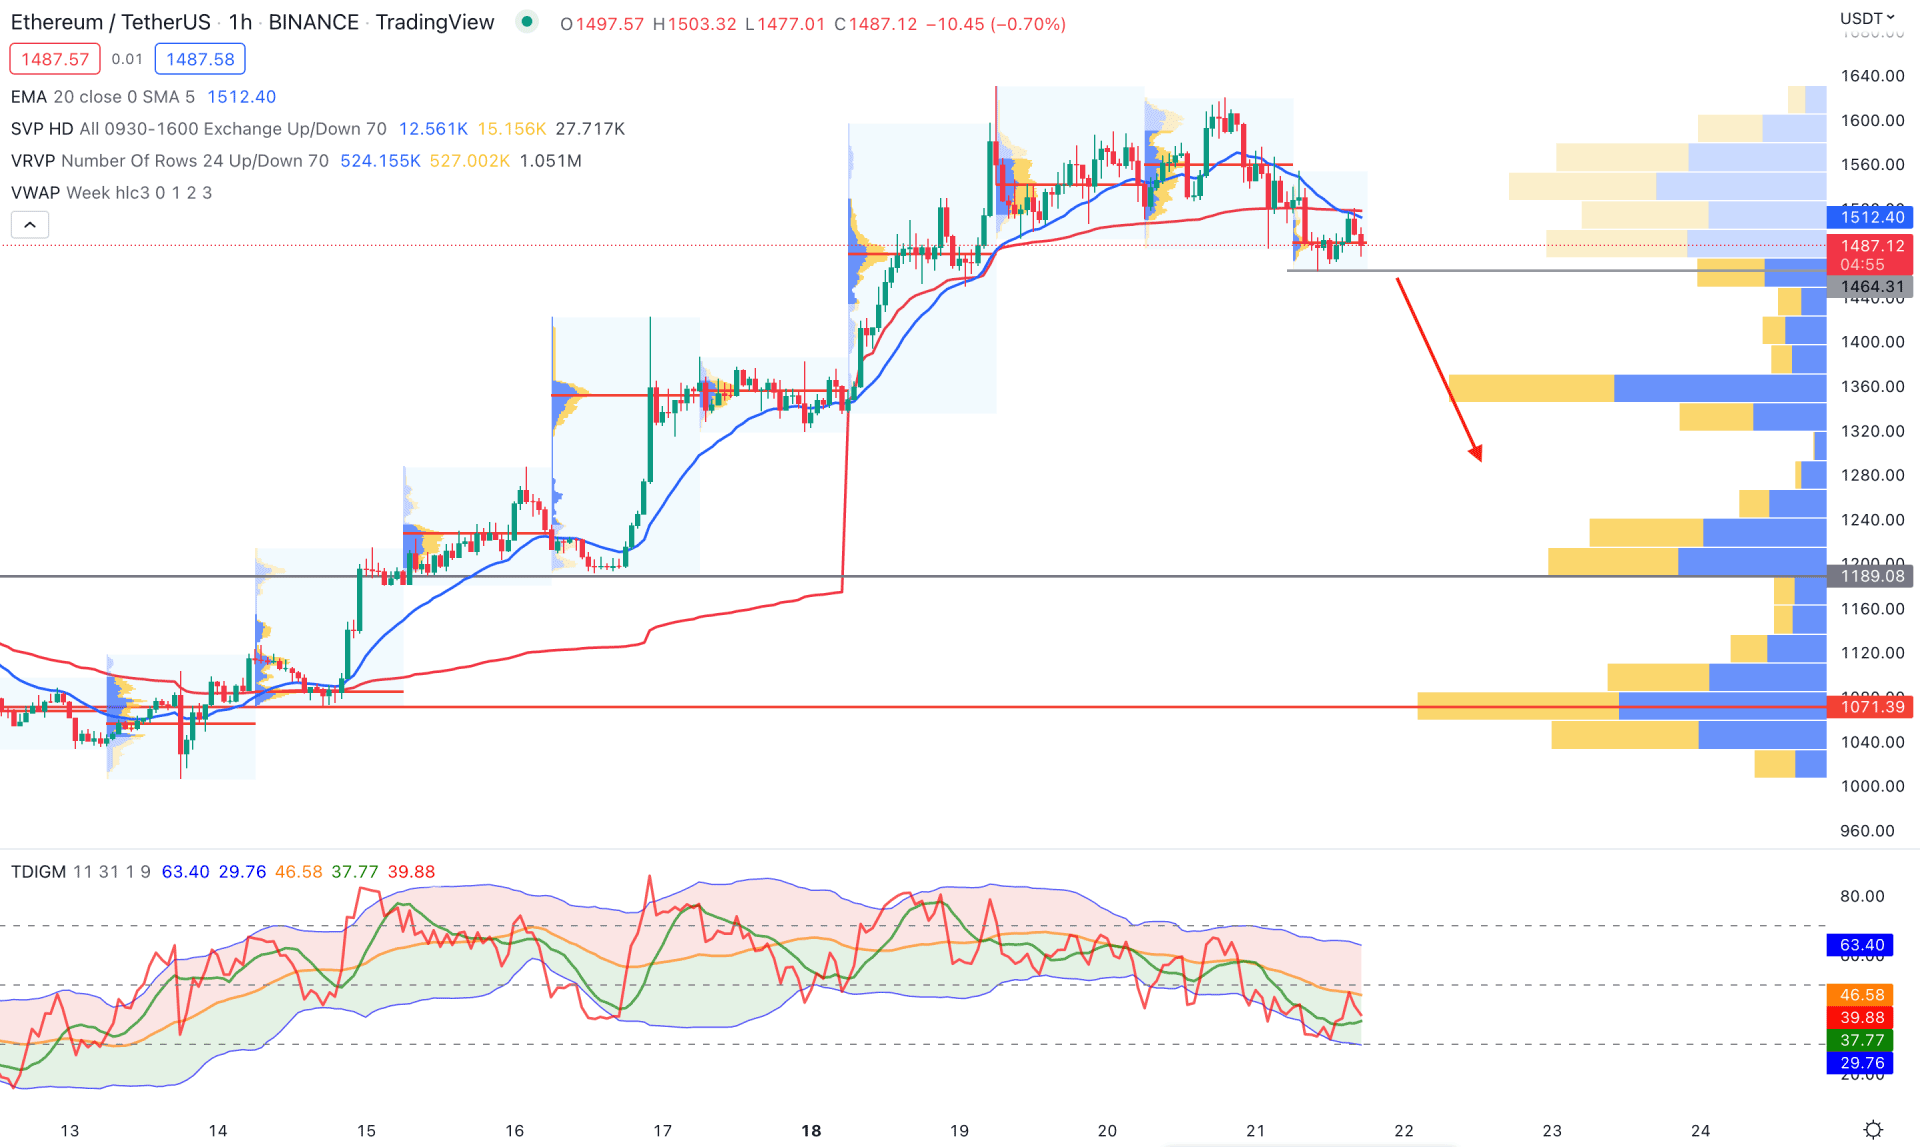
In the Hourly chart, ETH/USDT is trading with a corrective pressure where the gap between the current price and visible range high volume level is wide. As per the current price scenario, the strongest trading volume is available at the 1071.39 level, from where the buying pressure started. However, the price rose above that line and peaked at the 1640.00 level.
The indicator window shows how sellers control the price by taking the TDI level below the 50 zone. The dynamic 20 EMA and weekly VWAP are above the price, working as minor resistances. In that case, any bearish pressure and an H1 candle close below the 1464.00 level would open a bearish opportunity in this pair towards the 1189.00 support level.
Based on the current multi-timeframe analysis, ETH/USDT is more likely to show a bearish correction on the intraday chart. However, a long-term buying opportunity may appear if the price shows any bullish rejection from the 1276.00 horizontal support level.


