
Published: October 20th, 2022
For long-term investors, Ethereum (ETH) could be problematic as it becomes more self-fulfilling in the event of sweeping lows.
In October, more than 750,000 addresses became active, as shown by the active addresses Indicator for 30 Days, according to Santiment. The lower active addresses would be a bearish signal for ETH investors as fewer traders are interested in this instrument.
Even after a much-anticipated upgrade, ETH has declined 64% this year, but it can be a buying opportunity. Along with the general Crypto market, ETH has dropped. That is a turn for investors to get safer investments amid economic worries.
So the good news is, the drop in ETH isn’t due to issues with ETH itself. There are many positive facts about this blockchain. It’s the second-largest crypto and has taken top positions in non-fungible tokens and decentralized applications. It’s also an attractive platform for developers.
However, the recent price action indicates that traders should be more cautious regarding buying this instrument as it is trading at the crucial support level. Let’s see the future price of Ethereum (Ether) from the ETH/USDT technical analysis:
After the latest Ethereum merging event, ETHER bulls failed to show solid momentum, which has become the main reason for grabbing a bearish opportunity in this instrument. Moreover, the recent price action shows extreme corrective pressure, while several on-chain metrics show less investor activity in the market.
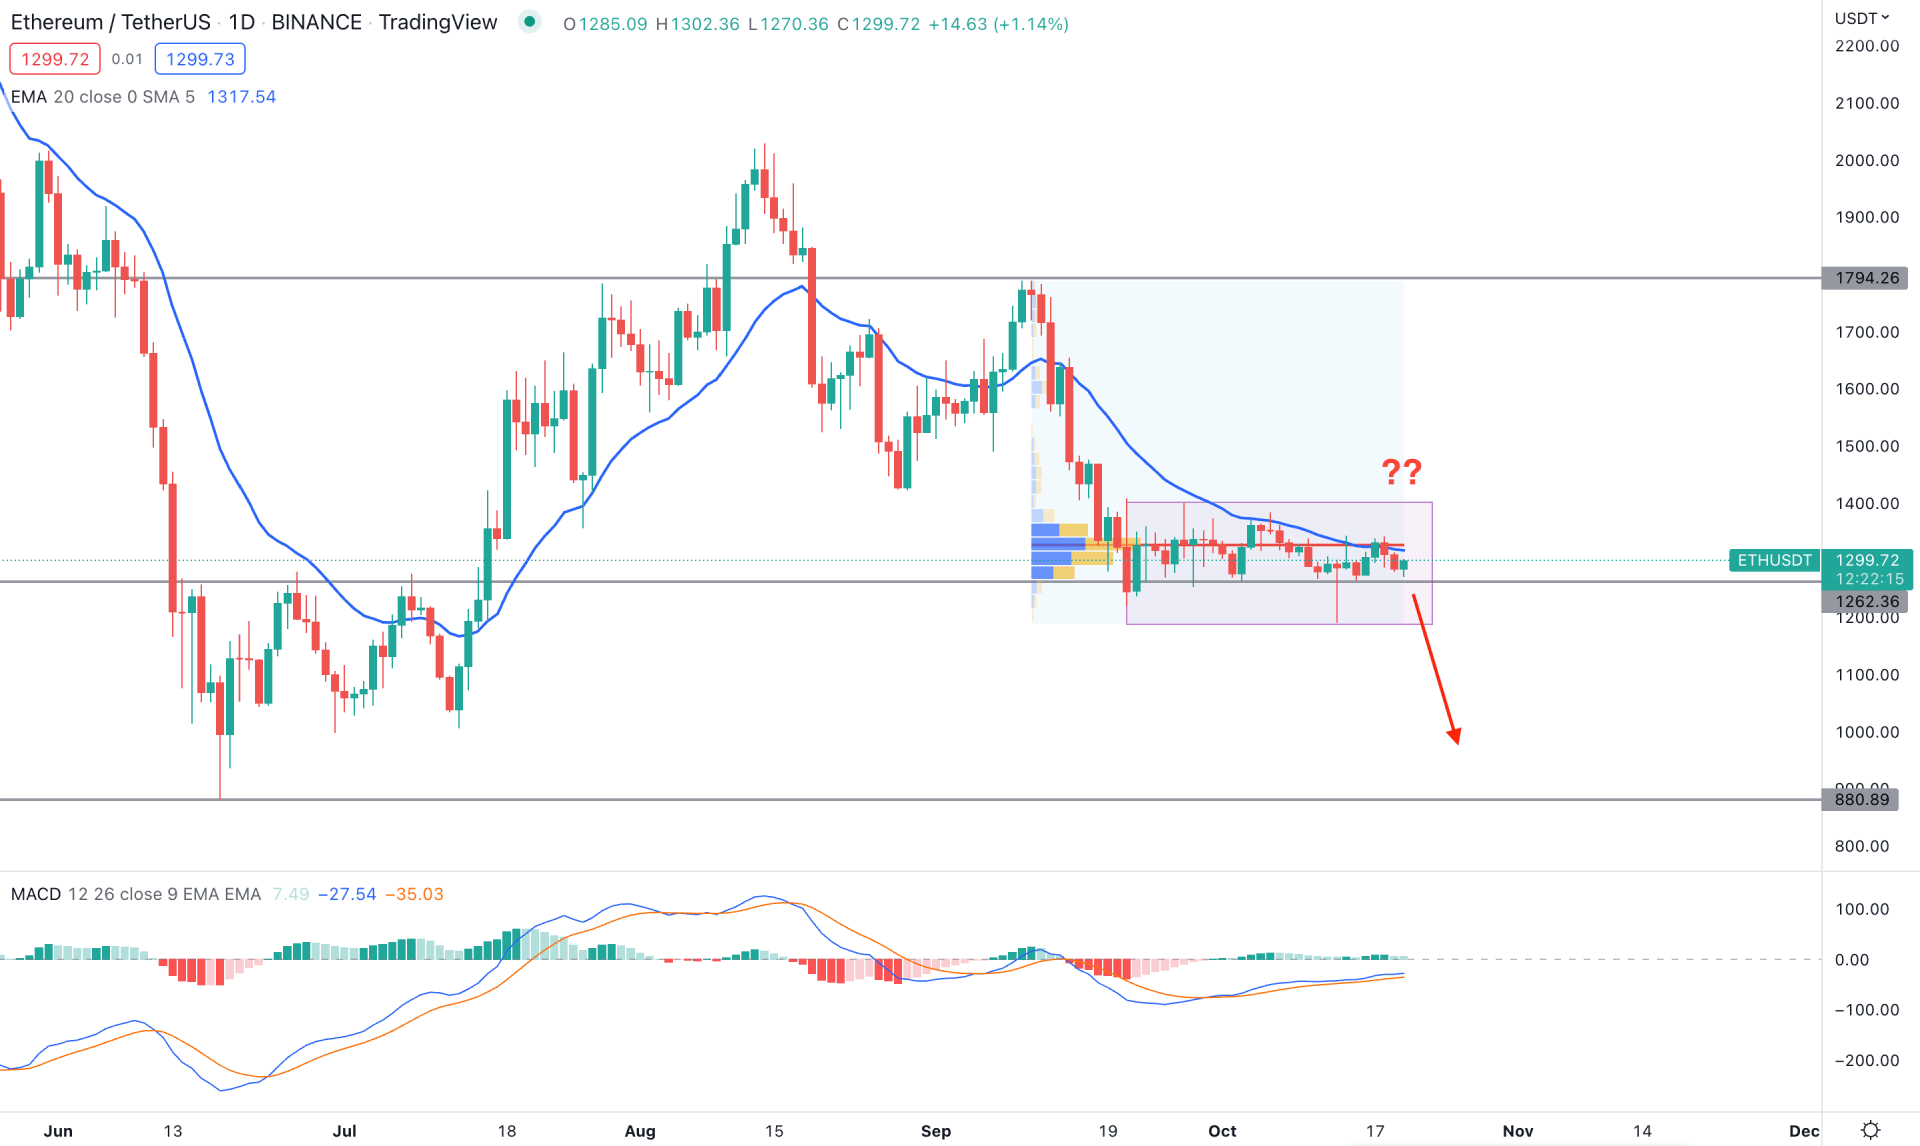
A strong bullish pressure appeared in ETH/USDT price since June 2022, but it failed to hold momentum above the 2000.00 level with a strong daily close. As a result, bears became active in the market where the current high volume level from September high to October low moves above the current price level. Therefore, the existing short opportunity is valid until the price forms a new high volume level with buying pressure.
The recent price action shows an extreme corrective price action where the rectangle pattern could offer a breakout trading opportunity in this pair. Moreover, 1262.36 is the near-term event level, which is the major barrier for bulls.
Based on the current outlook, ETH/USDT price could drop 29% to the 880.89 support level, if a bearish D1 candle appears below the 1262.36 level. On the other hand, a bullish opportunity is valid if a rectangle pattern breakout appears with a daily close above the 1400.00 psychological level. In that case, the buying pressure could extend towards the 1794.00 area.
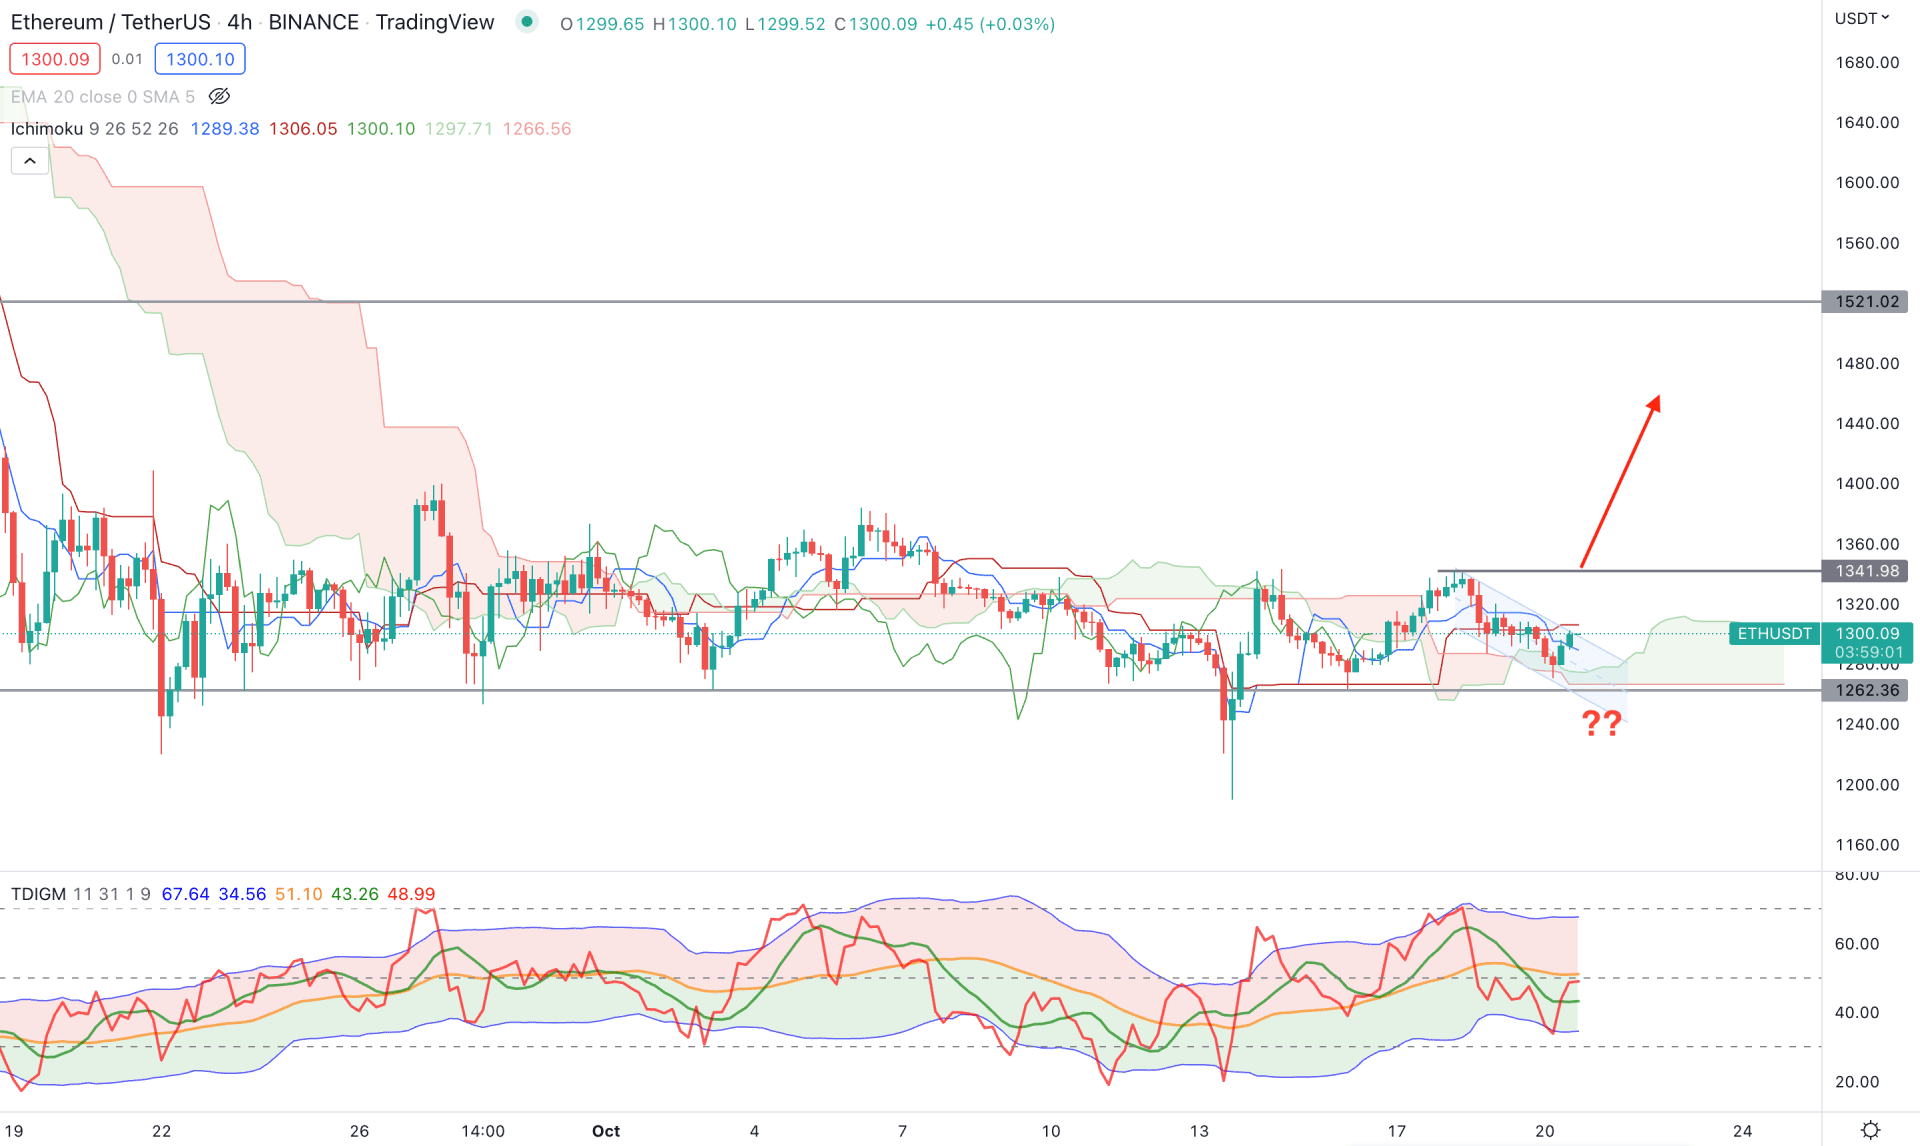
Although the bearish possibility in the ETH/USDT price is potent in the daily chart, the H4 price shows a different outlook. The price is trading within a strong consolidation, where a breakout with a massive change in volumes is needed to form a stable trend.
In the future cloud, the Senkou Span B is flat, which is a sign of less medium-term traders’ activity in the market. However, the Senkou Span A is above the price & aiming higher, which signals higher intraday traders’ presence in the market.
The indicator window shows a bullish possibility from the current Traders Dynamic Index position. As per the current formation, the TDI level formed a bullish crossover and moved beyond the 50% level. As the buying pressure in the TDI level came from testing the lower band area, it could offer a bullish possibility by reaching above the 60% zone.
Based on the H4 price action of ETH/USDT, the current descending channel breakout with an H4 candle above the 1341.98 level would be a conservative bullish opportunity toward the target of the 1521.00 level.
The alternative approach is to find a price below the 1260.00 level, which could activate the daily bearish possibility, targeting the 880.89 support level.
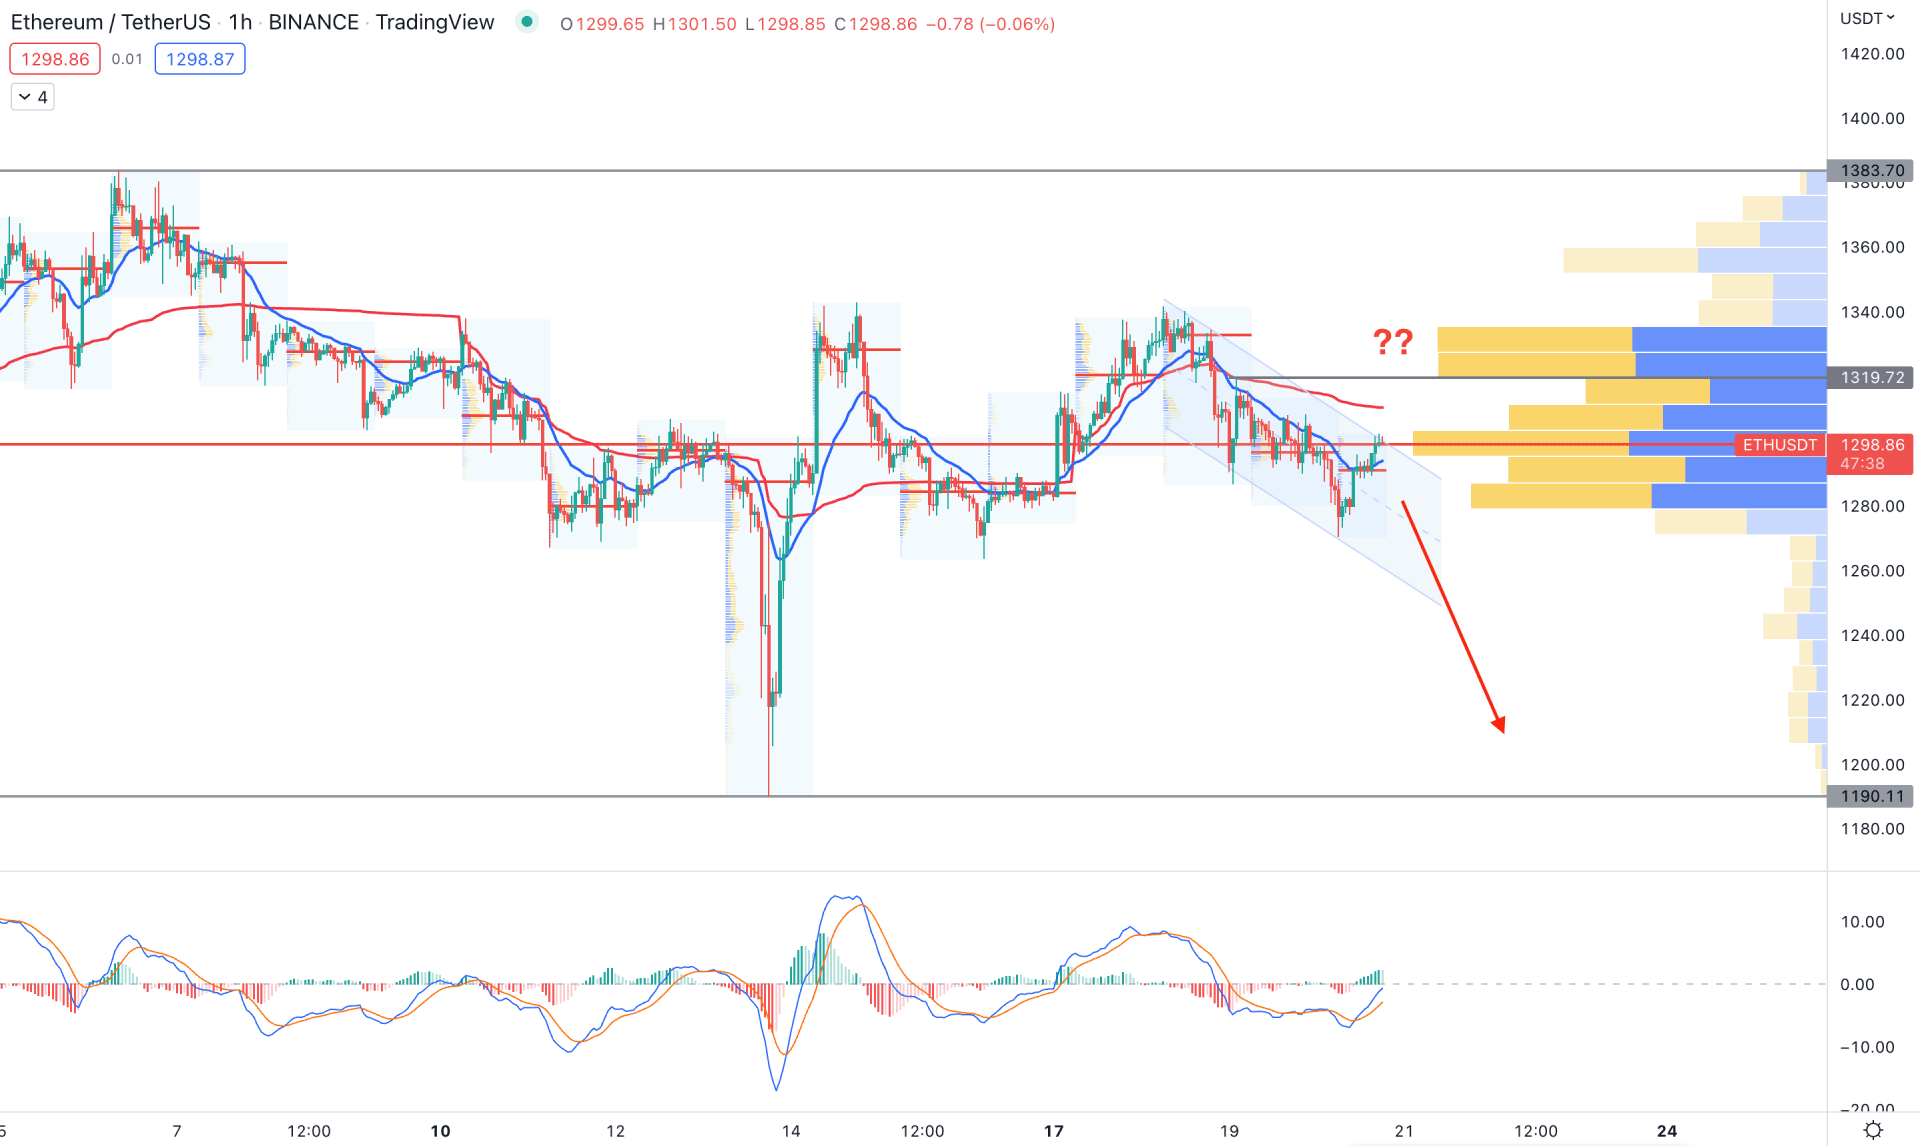
In the hourly chart, the bearish possibility is potent as the current price is trading at the channel resistance where the visible range high volume level is in line with the price.
In the main chart, the 20 Exponential Moving Average and weekly VWAP are above the price and working as dynamic resistances. On the other hand, the MACD Histogram is bullish, where MACD lines showed a bullish crossover.
Based on the H1 price chart, a bearish H1 candle below the 1280.00 level could extend the channel by racing the 1240.00 area. On the other hand, a bullish pressure with an H1 close above the 1340.00 level is needed before aiming for the 1383.78 level.
Based on the current market structure, ETH/USDT could drop if a daily candle closes below the significant event level of 1262.36. On the other hand, a bullish rectangle breakout with a change in volume is needed to form a long signal targeting the 2400.00 area.


