
Published: March 25th, 2025
According to Santiment data, the amount of Ethereum available on exchanges fell, hitting a ten-year low of 8.71 million ETH.
A decrease in a coin's trading supply indicates that investors may be transferring coins to personal wallets for a long time. It's crucial to remember that different on-chain analytical tools may have different metrics.
There is comparable purchasing pressure on the remainder of ETH accumulation locations, which has increased by 4.77 million Ethereum since the year started, representing a remarkable 32% growth rate. Notably, March saw a drop in ETH below the psychological $2,000 mark, accounting for around 45% of that gain (2.11M ETH).
In the meantime, open interest in ETH's futures market rose from 9.40M ETH to 10.10M ETH during the last three days, indicating a minor boost in derivative traders' confidence in the leading altcoin.
If ETH experiences a significant market catalyst, the strong purchasing pressure surrounding the present price levels could set up it as a major support and ignite a rally.
The catalyst for a change could come from the next Ethereum Pectra upgrade. Although Pectra caused problems for validators when it was deployed on test systems Holesky and Sepolia, programmers have demonstrated remarkable resilience in the face of these difficulties.
Let's see the future price outlook of this coin from the ETH/USDT technical analysis:
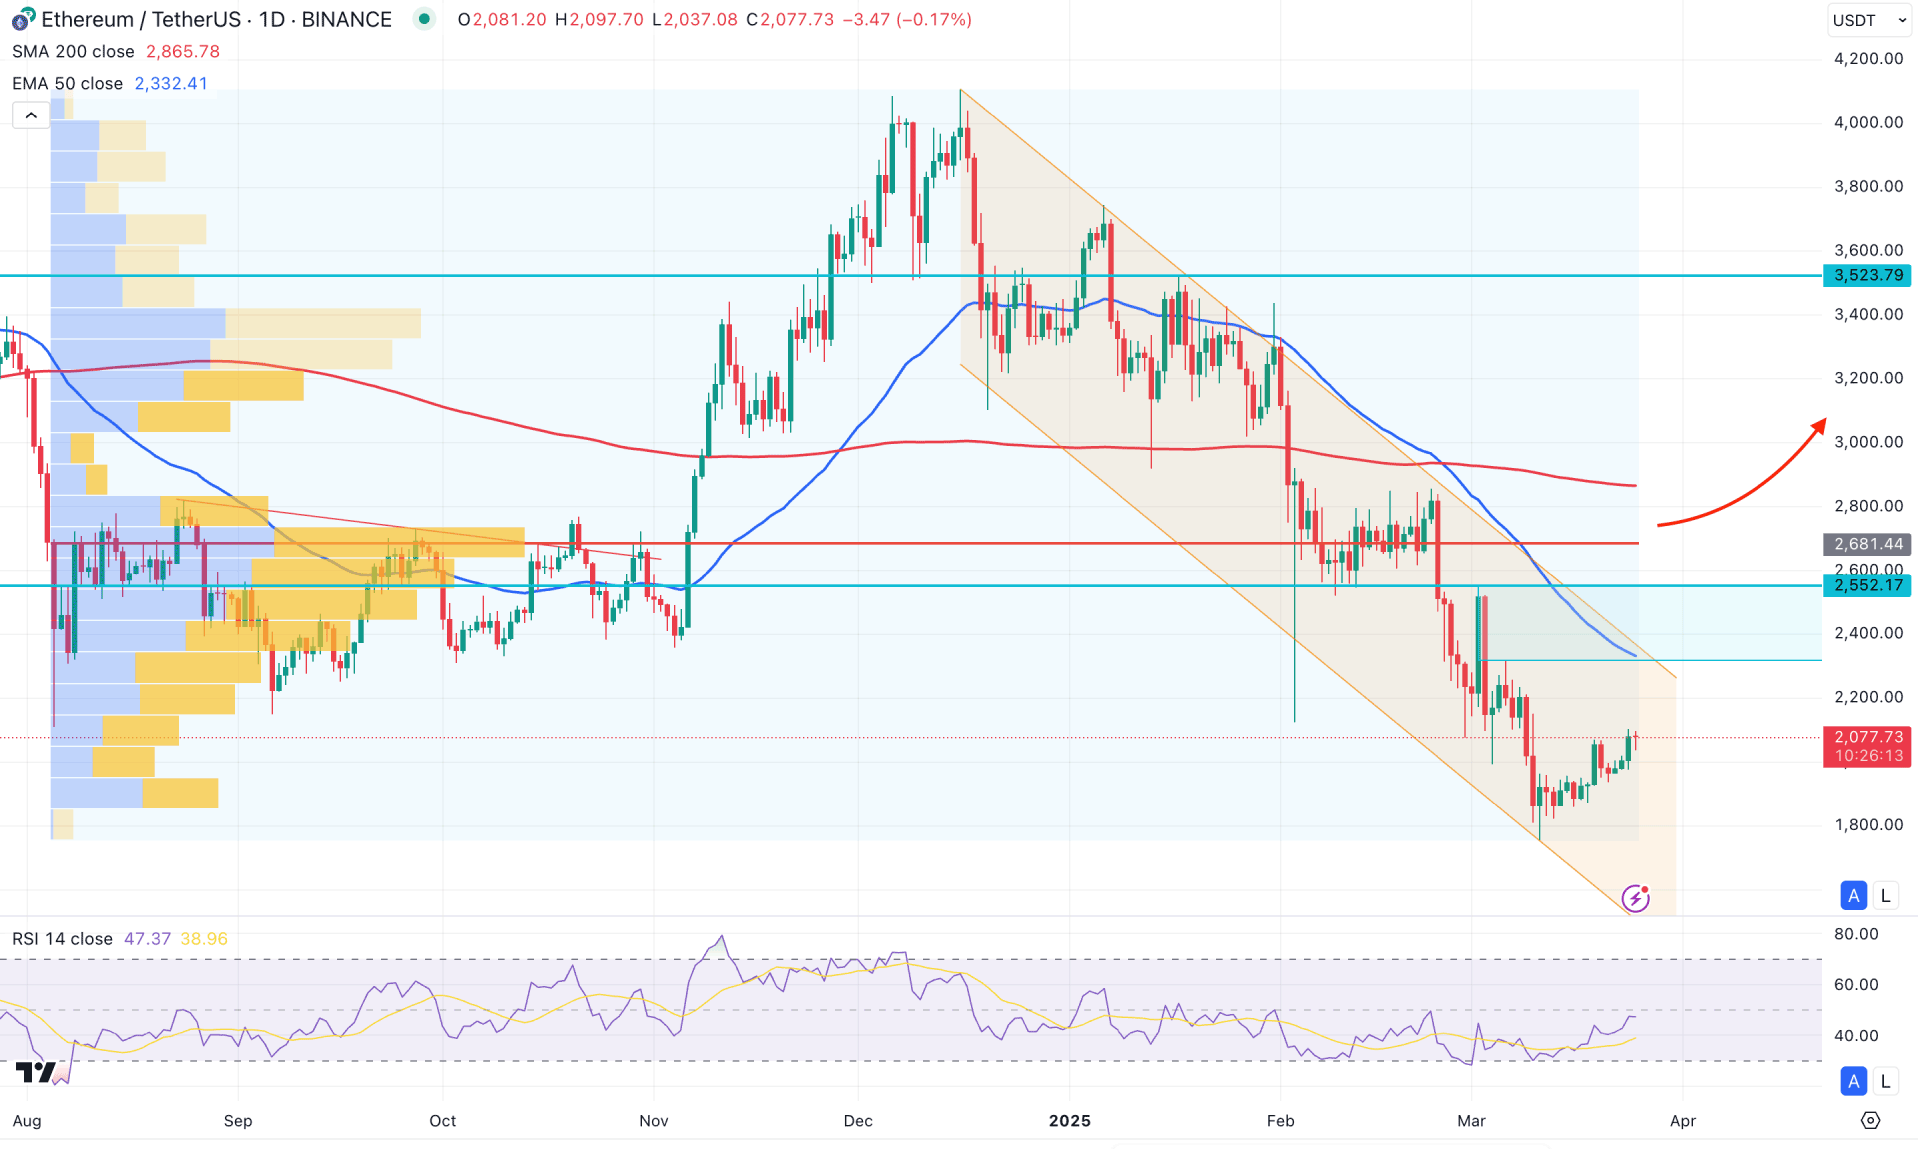
In the daily chart, Ethereum is trading within a bearish momentum after reaching the yearly high. The selling pressure below the 2000.00 psychological level signals a discounted price for bulls, but proper price action is needed before opening a long position.
Looking at the higher timeframes, a consolidation is observed on the monthly chart, where the current price is trading below the February 2025 low with corrective pressure. Primarily, a bullish rebound above the 2236.99 monthly high could signal a primary long opportunity, but proper validation is needed from the weekly chart.
In the weekly timeframe, a bullish rebound is visible with a 2-bar reversal setup, where the current price is moving upward with continuous momentum. Moreover, several imbalances have formed above the current price that need to be filled soon. However, a proper bullish price action should come from a valid price action with a solid volume structure.
Looking at the current price level, the highest activity level since August 2024 is at 2683.90, which is 29.8% above the current price. As the current price is bearish below the high-volume line, a downside continuation is likely after forming a valid candlestick pattern.
On the main chart, the 200-day Simple Moving Average is already acting as a major resistance level. The 50-day Exponential Moving Average has crossed below the 200-day SMA line, signaling a valid death cross formation. In this case, the high-volume line above the current price, combined with selling pressure from dynamic indicators, offers a short opportunity from a reliable price zone.
In the indicator window, the Relative Strength Index (RSI) found support at the 30.00 level and rebounded above the 40.00 area. However, the RSI is still below the 50.00 level, signaling that the price is still trading under the seller's zone.
Based on the daily market outlook for Ethereum, a bullish continuation with a valid reversal from the channel resistance could present a short opportunity targeting the 1800.00 level. In that case, investors should monitor how the price reacts at the 2328.00 to 2254.98 supply zone. Since the 50-day ZEMA is already aligning with the supply zone, backed by the 200-day SMA, we may expect a channel extension in the coming days.
On the other hand, a bullish counter-impulsive momentum with a daily candle above the 2600.00 level might invalidate the current outlook. In that case, a consolidation above the 2600.00 level with a valid range breakout might extend long-term bullish strength, aiming for the 4106.45 yearly high. Overcoming the 3600.00 psychological level might open the door to the 5000.00 level soon.
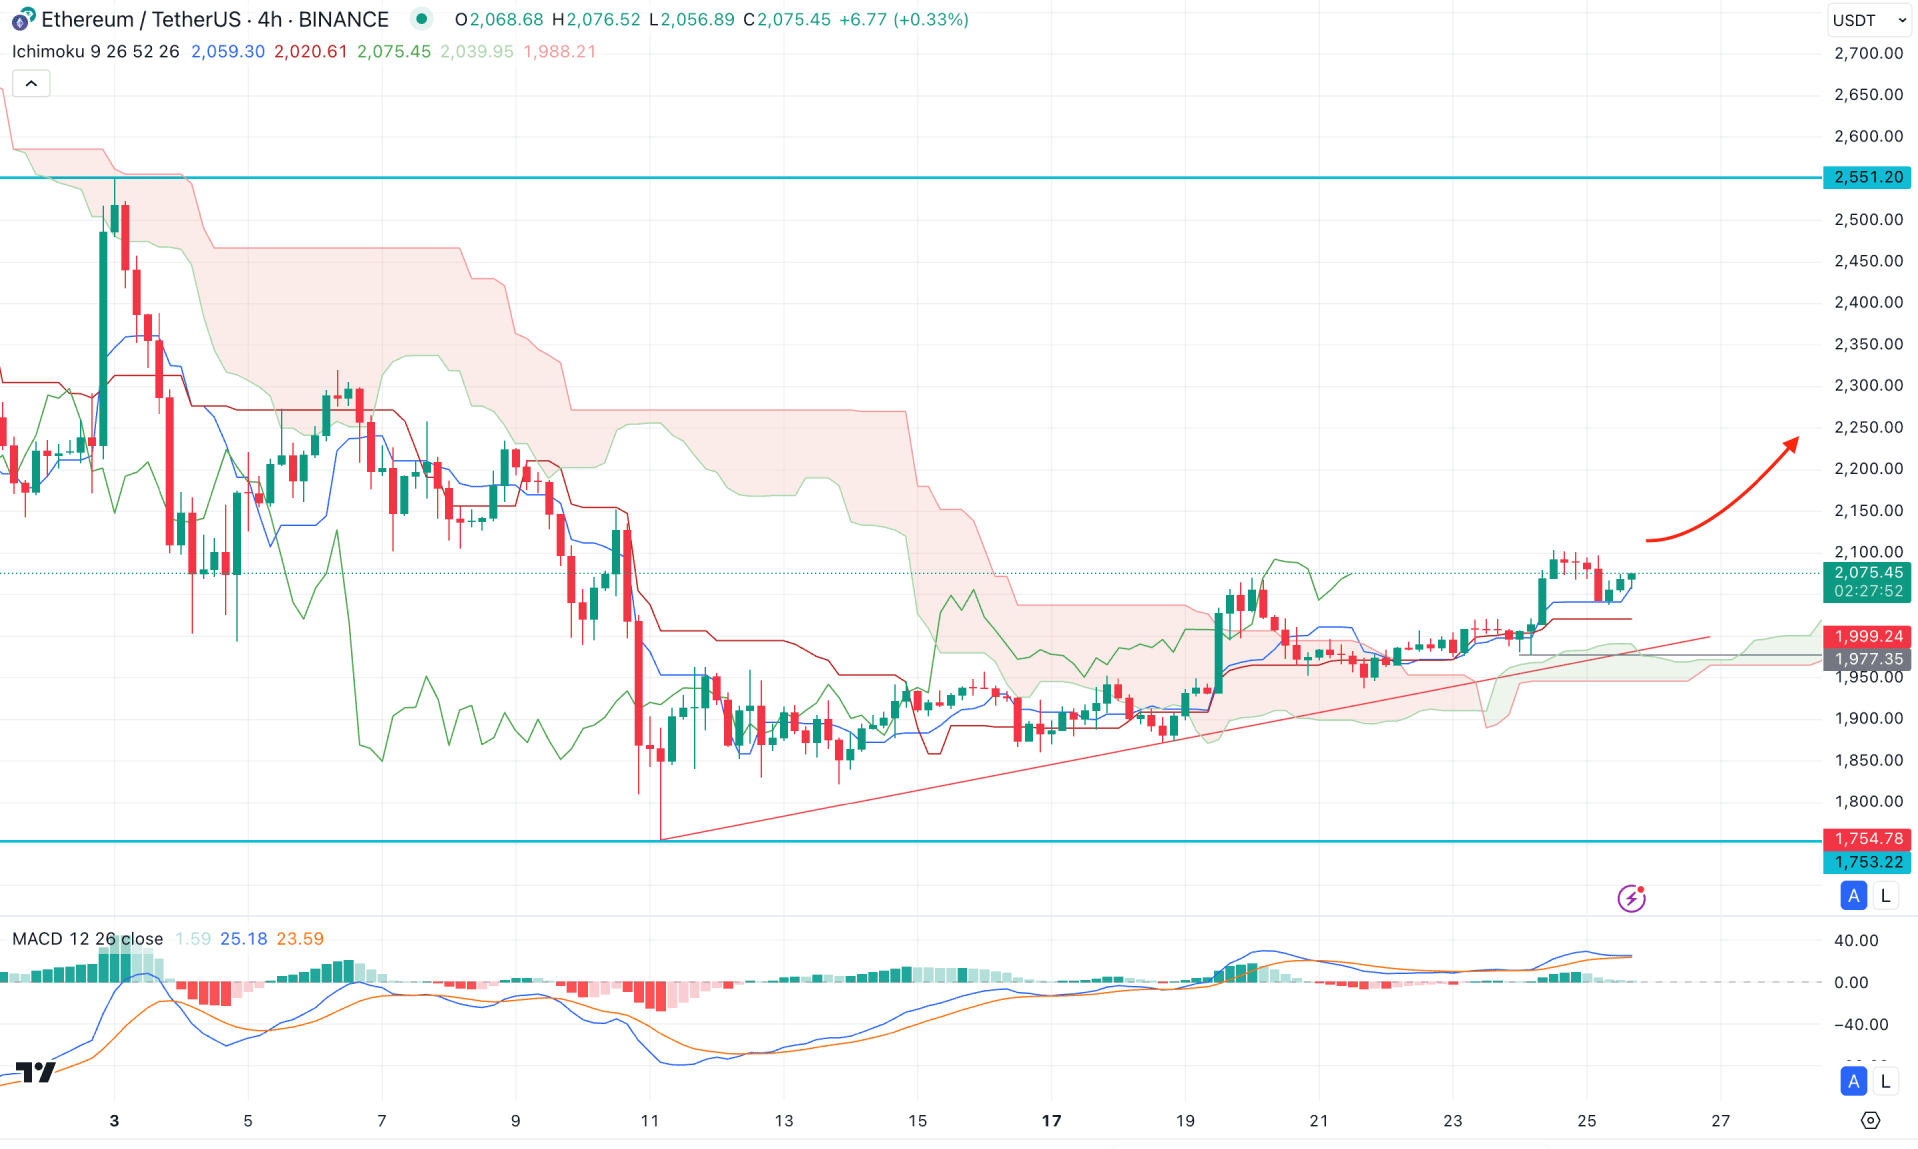
In the four-hour timeframe, the recent price shows bullish pressure supported by an ongoing rising trend line. The future cloud indicates an optimistic outlook, as both lines are heading upwards. Primarily, it is a bullish continuation signal, which might extend and form a new swing high above the 2200.00 level.
In the secondary indicator window, the signal line has become flat at the highest level in a month, signaling a possible top formation in the price. Moreover, the histogram failed to hold positive momentum and reached near the neutral point.
Based on the H4 market outlook, a bullish continuation with a break above the 2100.00 level would be a good signal for further upward movement, potentially extending beyond the 2300.00 area. On the other hand, the rising trend line might have enough liquidity below the cloud support. In that case, selling pressure with an early close above the 1950.00 level could target liquidity from the 1750.44 low before forming another bullish attempt.
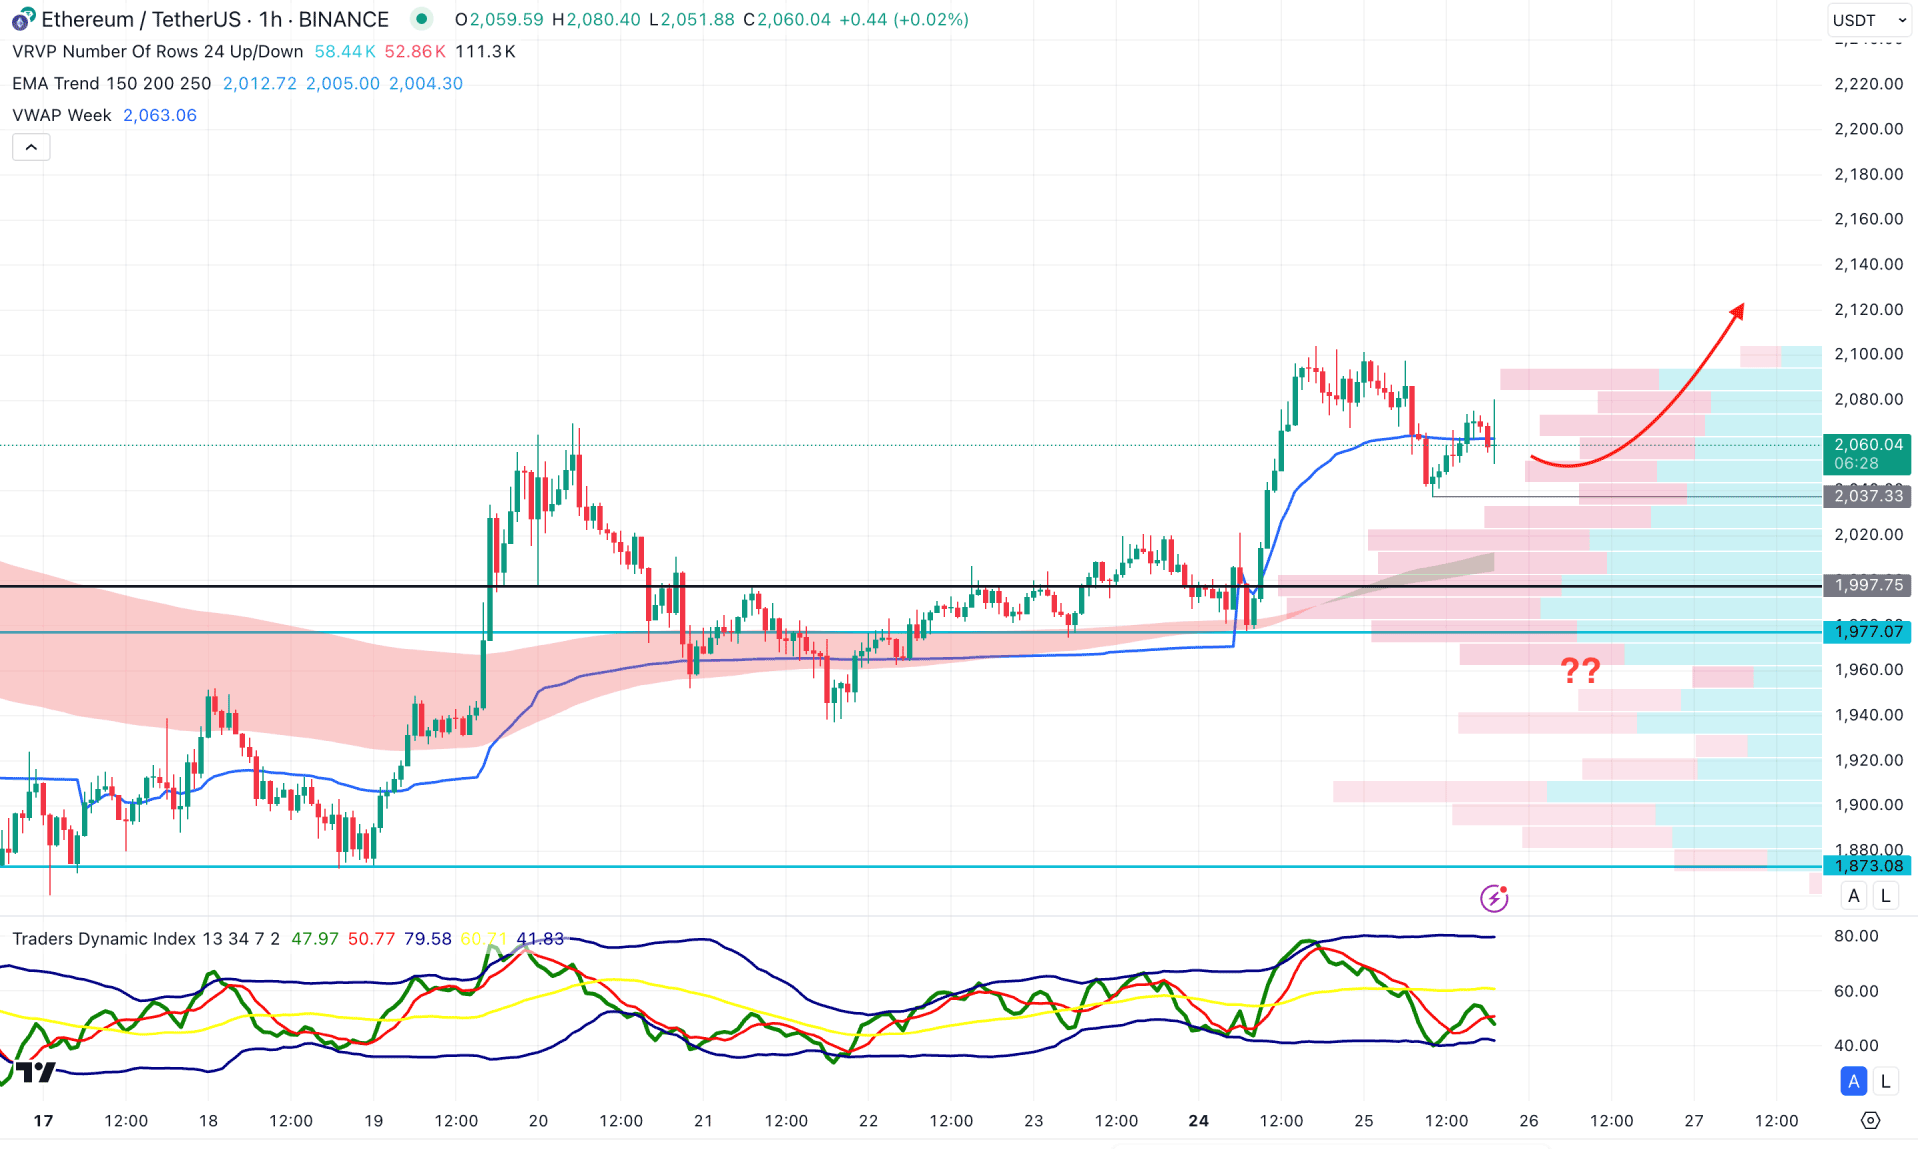
In the hourly timeframe, the recent price shows a bullish breakout from the high-volume area, creating a new swing high above the 2100.00 level. Moreover, ongoing upward pressure is visible above the moving average wave, which is acting as immediate support.
In the indicator window, the Traders Dynamic Index (TDI) shows a different story, as the current TDI level is hovering below the 50.00 point with a downward slope. Moreover, the weekly VWAP level is in line with the current price, showing no significant upward pressure.
Based on this outlook, investors should monitor how the price reacts at the 2037.33 support level. A bullish trading idea would be to look for immediate upward pressure with a candle close above the 2100.00 level before heading toward the 2200.00 area. On the other hand, a deeper discount is possible, which might grab the imbalance formed below the 2030.00 level. In that case, sell-side pressure with an immediate bullish recovery above the VWAP line would be needed before opening a long position.
The maximum tolerance level for incoming buying pressure would be the 1977.07 support level. If counter-impulsive bearish pressure occurs from the current price area, with a closed candle below the 1977.00 level, it could extend the loss and test the 1873.03 low.
Based on the current market outlook, Ethereum is trading at a discounted level, but no sufficient long-term bullish price action has formed. The ideal approach would be to wait for a valid channel breakout, establishing a stable market above the 2600.00 level. On the other hand, if the day price remains bullish, any selling pressure towards the near-term low could present a short-term trading opportunity.


