Published: May 27th, 2025
After a slight decline from last week's high above $2,700, Ethereum has held steady above $2,500. The overall momentum seems more muted, which makes traders and experts wonder about its current stance. However, the larger cryptocurrency market is still in a positive pattern due in large part to Bitcoin's dramatic upward surge.
Some observers think Ethereum hasn't yet tapped adequately into the enthusiasm of the broader market, even though the price is still above essential levels. Burak Kesmeci, an analyst at CryptoQuant, made one such observation, pointing out that, unlike previous cycles, there is still little retail activity surrounding Ethereum.
This may indicate that the market has not yet priced in Ethereum's possible upside, and that the rise remains in its early phases. Likely, Ethereum hasn't yet peaked for this cycle due to the lack of consumer enthusiasm, which has traditionally correlated with local tops.
Kesmeci's research revealed a significant change in retailers' interactions with Ethereum. The expert said that prior rallies were frequently followed by notable increases in retail trading frequency, drawing parallels to the 2021 bull run.
However, although Bitcoin rose from $16,000 to over $111,000 over the present cycle, retail enthusiasm has been relatively low. Retail activity in ETH briefly increased in December 2024, but this impetus swiftly waned as the market responded to bigger geopolitical concerns, including heightened tariff tensions.
Let's see the further market outlook from the ETH/USDT technical analysis:

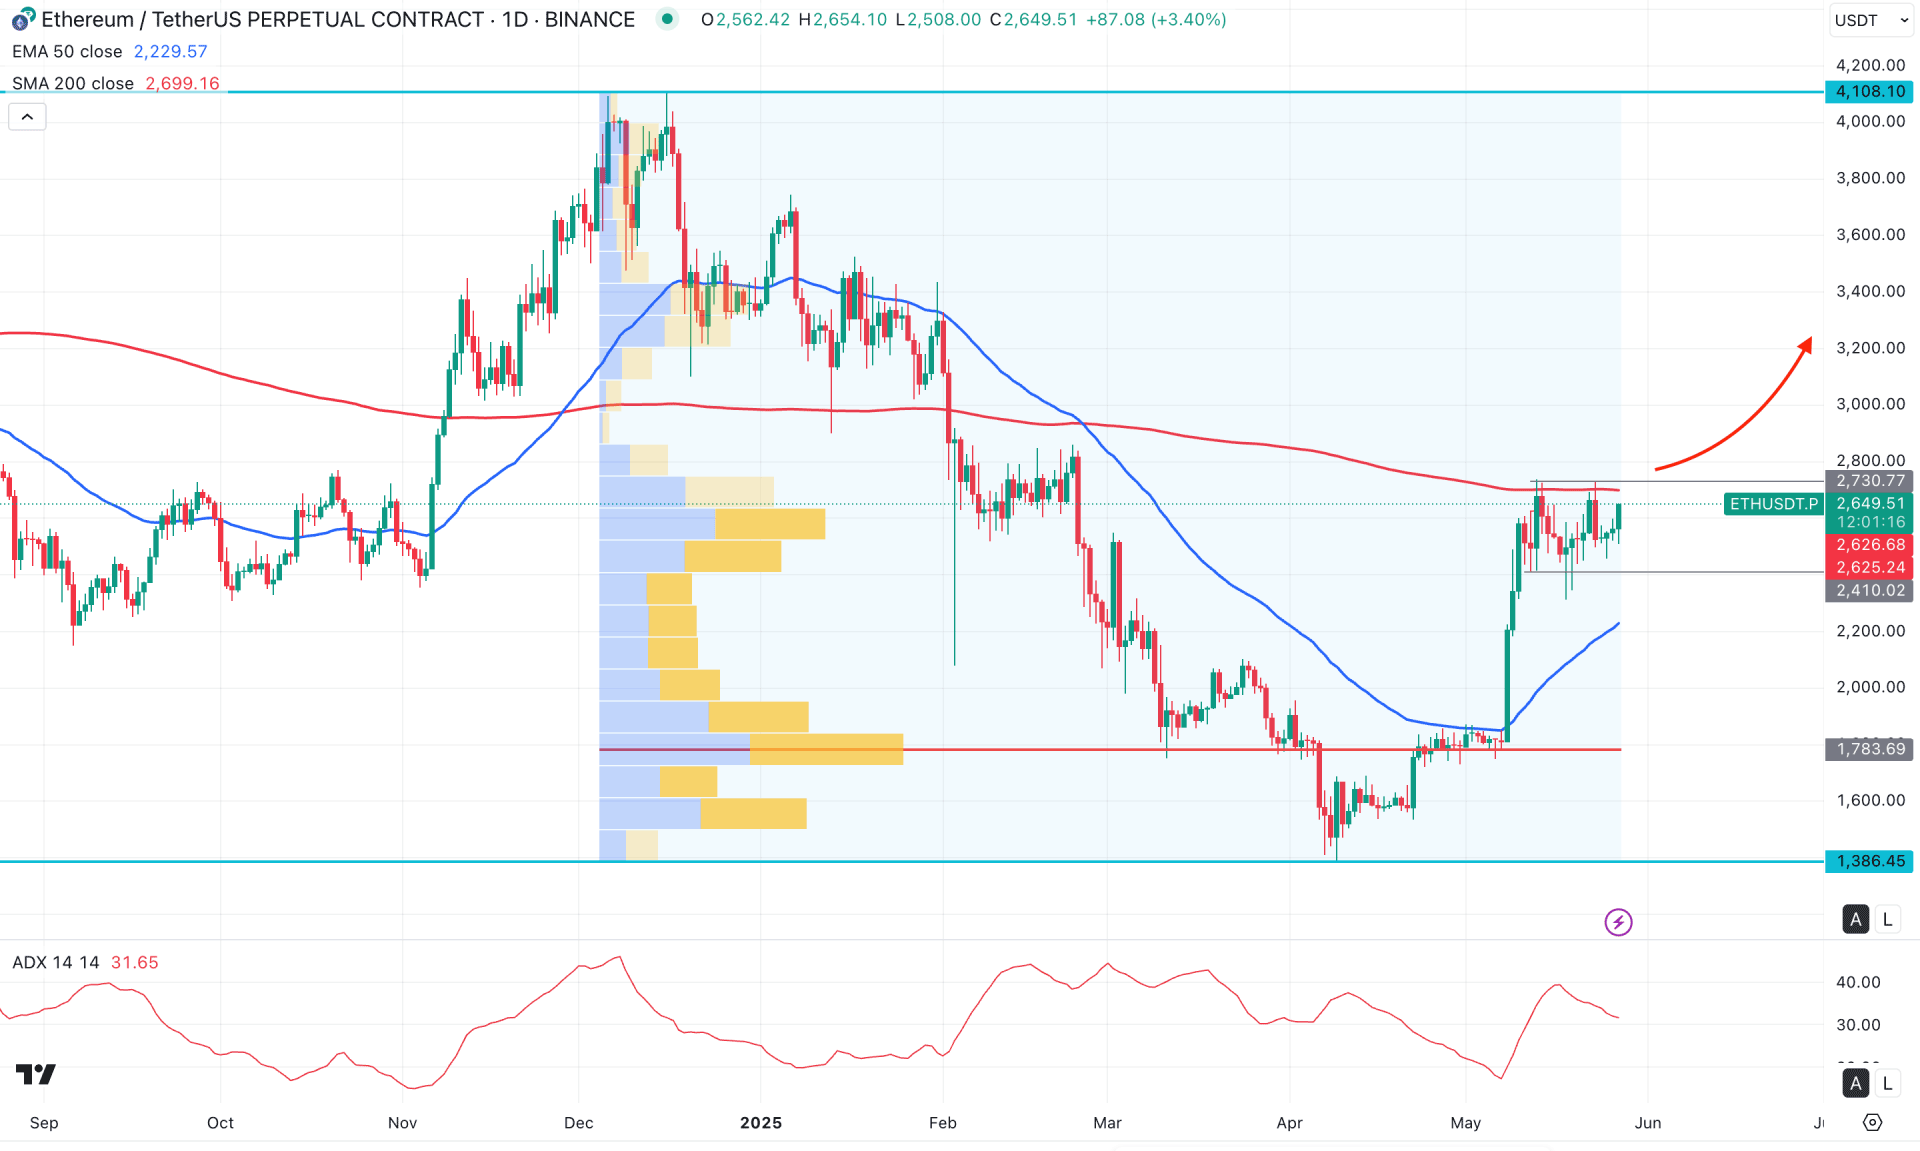
The daily chart of ETH/USDT shows a decent bullish recovery, where a solid bottom has formed at the 1386.45 level, resulting in a significant 96% gain. Following this major bullish reversal, the price is maintaining momentum near a dynamic resistance area. A bullish breakout from this zone could resume the ongoing uptrend.
In the monthly time frame, a bullish breakout is evident from the hammer candlestick, and the current price is trading at a two-month high. The weekly chart reflects the same bullish momentum, although the most recent candles show multiple indecision patterns near the top.
In the main price chart, the 200-day SMA remains flat and acts as an immediate resistance. Moreover, the price has formed a potential double top pattern at the 200-day SMA, although no significant selling pressure has emerged from this level. Meanwhile, the 50-day EMA is positioned below the current price and is sloping upward. This indicates that medium-term traders remain bullish, and the indecision primarily comes from higher timeframes.
Volume analysis also supports the buyers, with the most significant level since December 2024 located at 1783.69. Unless a new high is formed, the ongoing bullish momentum is likely to continue.
In the secondary indicator window, the Average Directional Index (ADX) shows a bullish breakout above the 20.00 threshold and is currently hovering around the 30.00 level. As long as the ADX remains above 20.00, we can expect the bullish strength to continue.
Based on the daily market outlook, a potential bullish breakout with a daily candle closing above the 2800.00 psychological level could offer a valid long opportunity, with the primary target being the 4000.00 psychological level. However, the current price is moving sideways after a strong bullish impulse, and a minor downside correction is possible before forming a secondary long opportunity.
An alternative trading approach would be to look for an immediate bearish reversal, especially if the price consolidates below the 50-day EMA. In that scenario, the bearish momentum could extend below the 1783.69 key level.

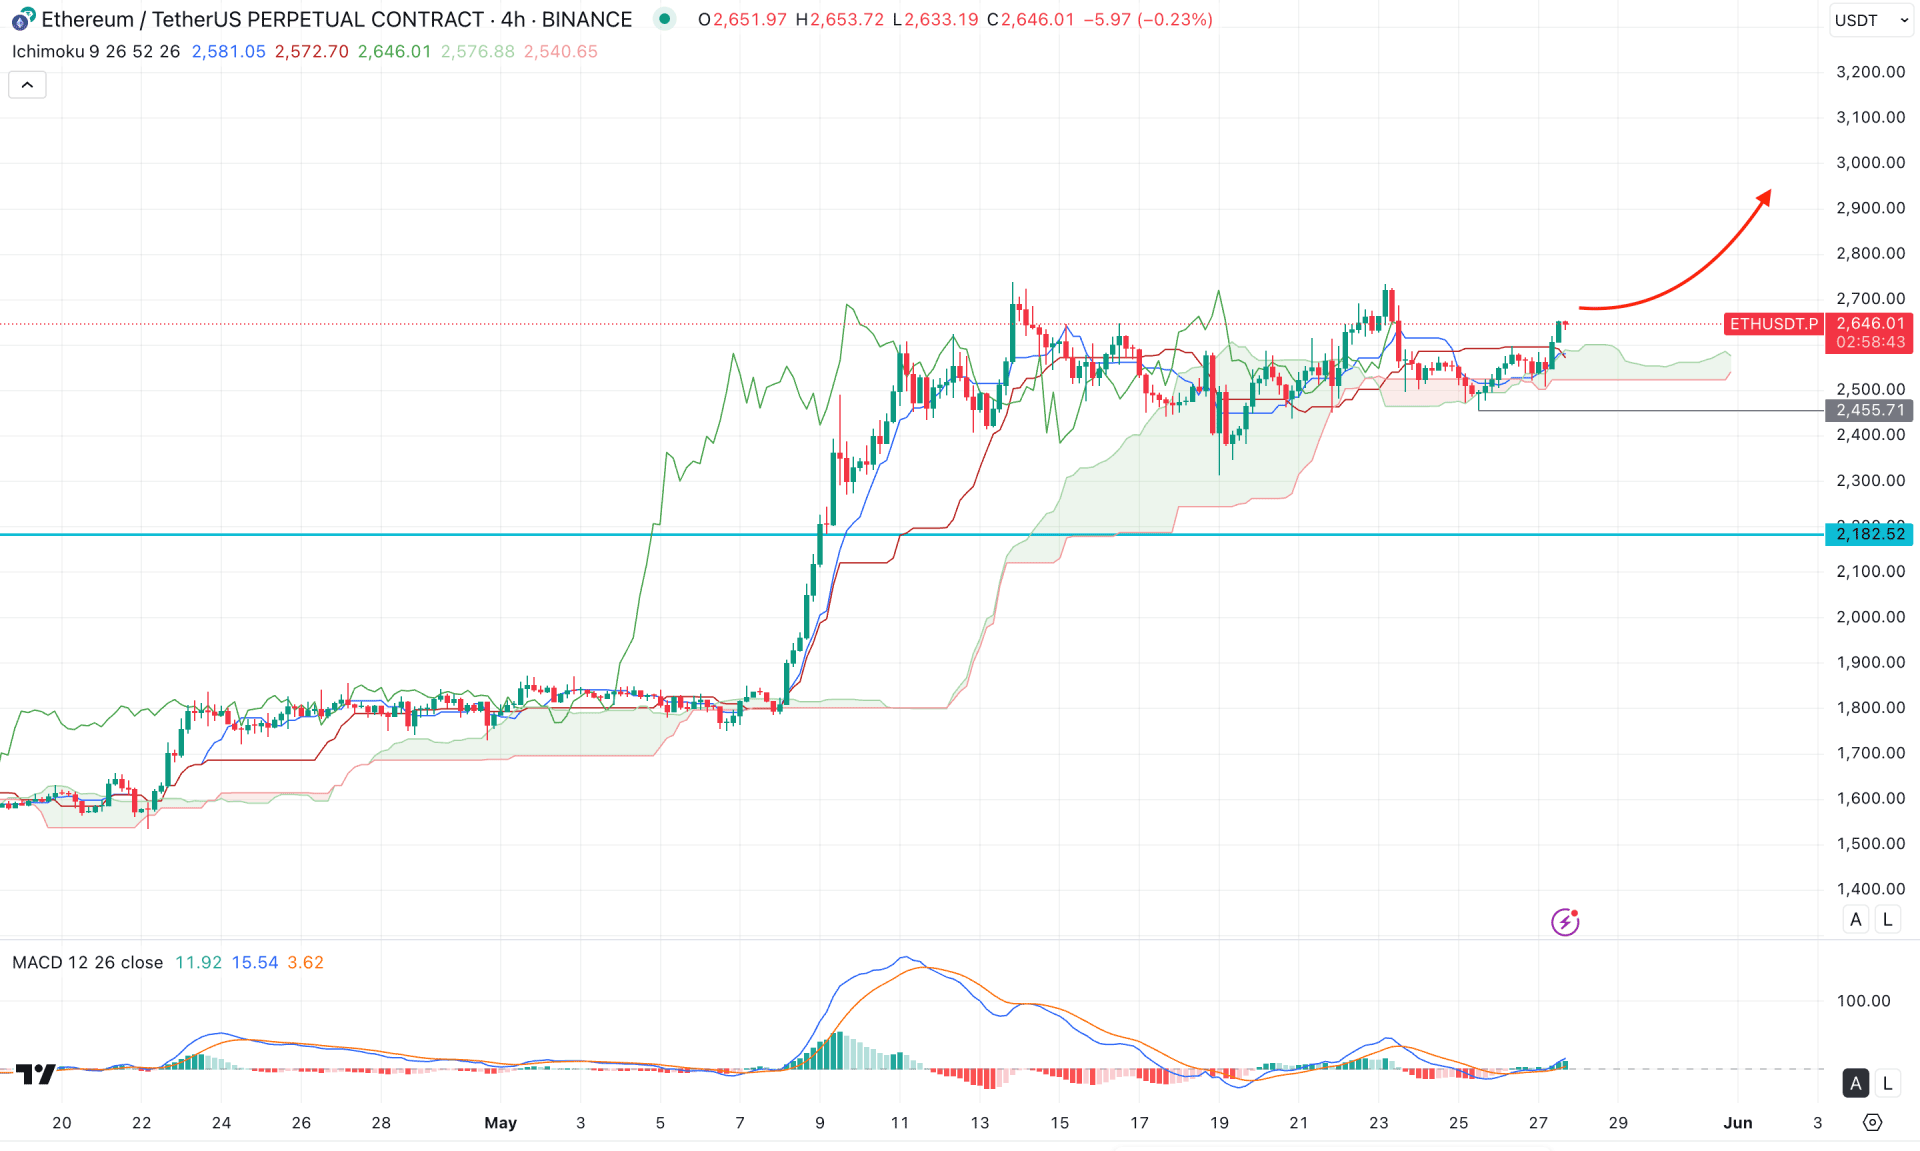
A bullish continuation is evident on the four-hour timeframe, as the consolidation above the Ichimoku Cloud indicates a strong bullish bias. Furthermore, the future cloud looks positive, with both the Futures Cloud lines aiming higher in alignment with the broader market trend. In this context, the primary focus should be identifying bullish trade opportunities.
On the other hand, the MACD histogram reflects a sideways short-term structure, as the current price is moving within a consolidation zone. However, the signal line has formed a bullish crossover from the bottom, indicating confirmed buying pressure.
Based on the H4 market outlook, a bullish continuation remains likely, as the current price is above the dynamic support line. If this momentum continues, the price can create a new swing high above the 2780.00 level and potentially advance beyond the 3000.00 psychological level.
Alternatively, a bearish correction toward the 2455.71–2300.00 zone is possible. However, a sustained bearish breakout below the 2182.51 level could invalidate the bullish setup and push the price lower toward the 1600.00 area.

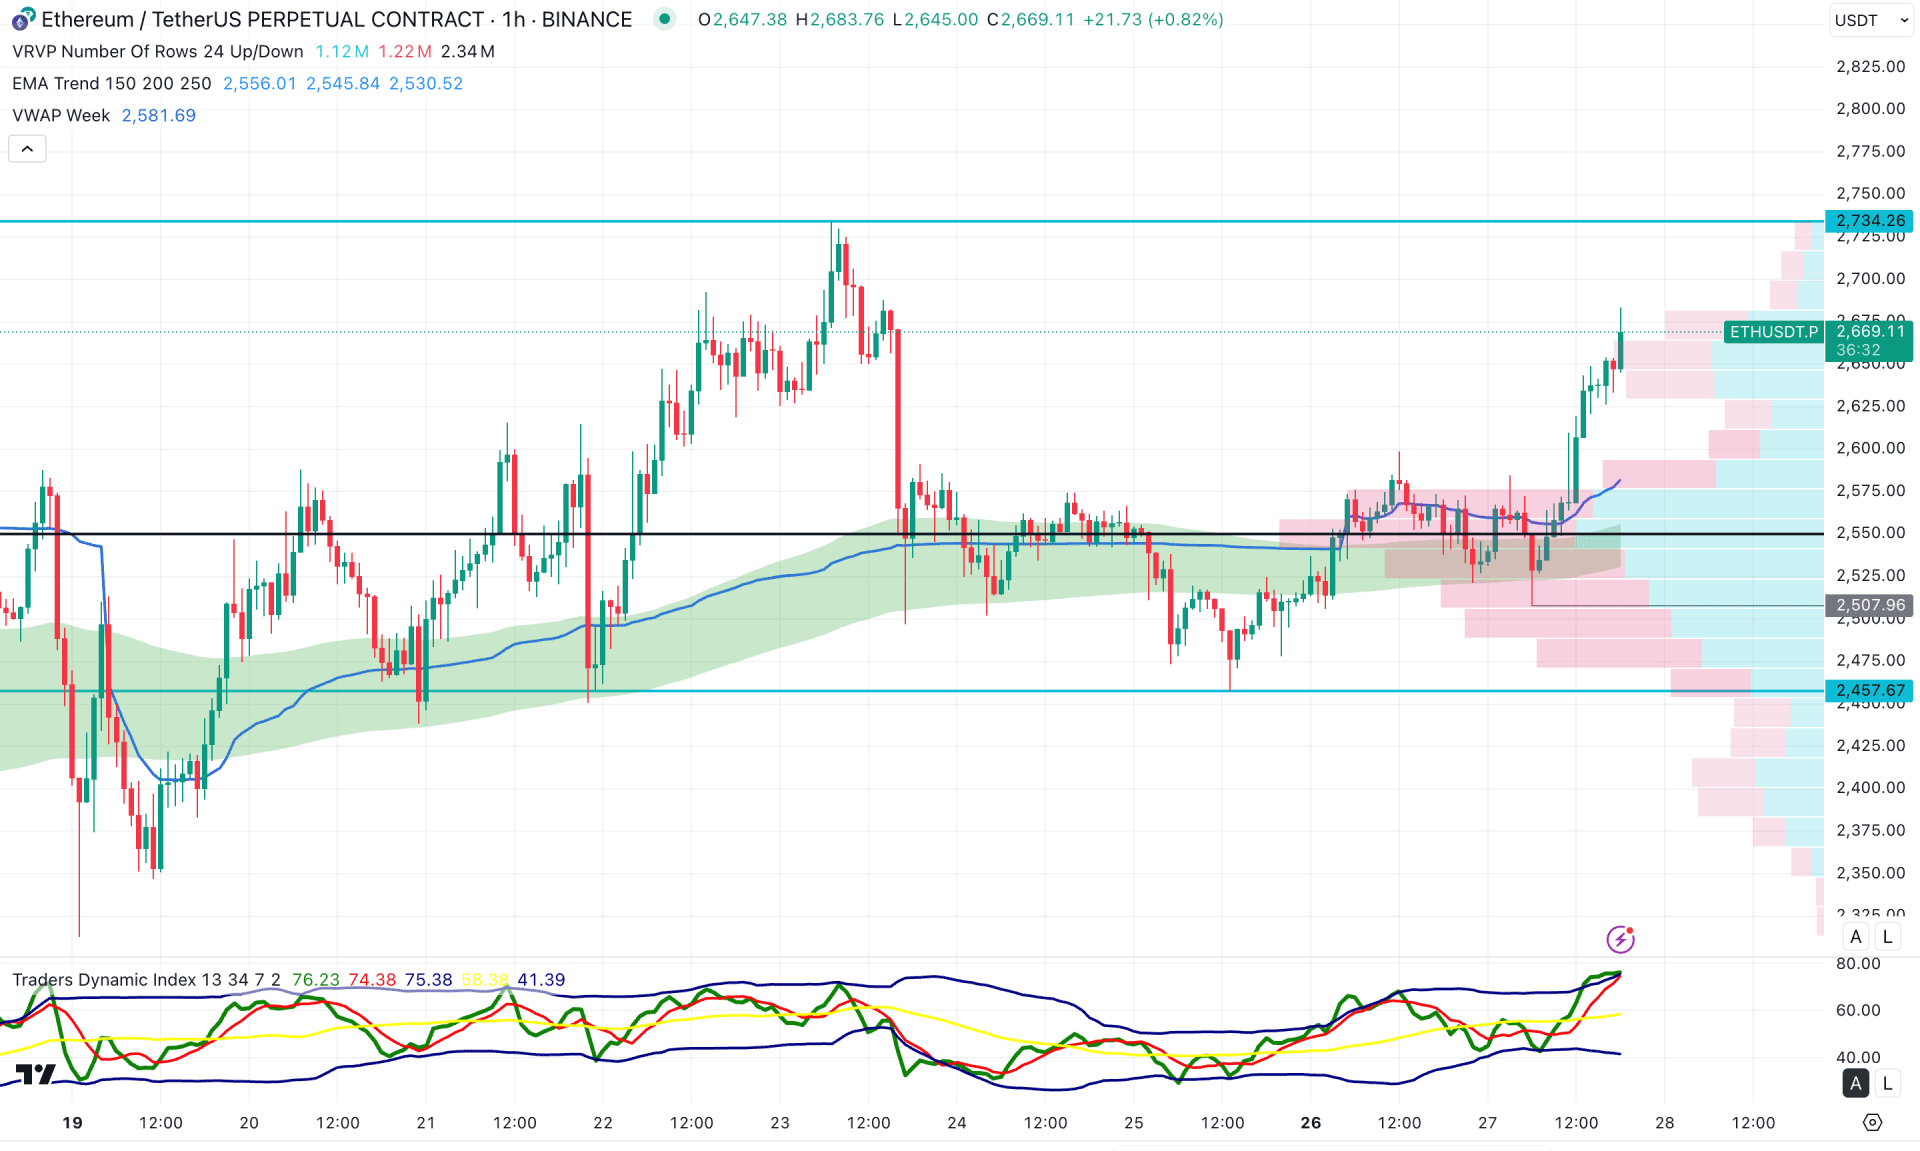
In the hourly time frame, the recent price shows a buying pressure as the dynamic Moving Average wave is below the current price with a bullish slope. Moreover, the intraday high volume line is also below the current price, working as a confluence of buying pressure.
The Traders Dynamic Index (TDI) has reached the upper peak in the secondary indicator window, signalling a bullish overextension in the hourly chart.
Based on this outlook, a minor downside recovery is pending, which can provide an opportunity to bulls. However, any immediate bullish continuation with a stable price above the 2734.26 level might resume the existing trend anytime.
Based on the current market outlook, ETH/USDT will likely extend the buying pressure in the coming days. In that case, investors should monitor how the price breaks out from the current range, as a bullish breakout above the range high could be a long-term investment opportunity.