
Published: December 23rd, 2025
For months, there has been pressure on Ethereum, the second-biggest cryptocurrency in terms of market value. ETH is currently trading below $3,000 after falling nearly 40% from its August top of 4,953.
Investor patience has been put to the test by this protracted downturn, particularly as the cryptocurrency market as a whole looks for an unambiguous path.
Selling pressure is one of the main causes of Ethereum's poor price movement. Spot Ethereum ETFs saw withdrawals for seven days in a row, indicating a decline in institutional demand. BlackRock ETHA, on the other hand, led this outflow charge with about $558.1 million within the last five days.
Whales sold around $360 million worth of ETH in a single week, according to on-chain data. Despite the market briefly showing indications of recovery, Ethereum has found it more difficult to rise as a result of this persistent dumping.
In addition, traders are keeping a careful eye on December 26, when the Deribit market will see a record amount of cryptocurrency options expire. Approximately $3.8 billion in Ether choices are among the approximately $28.5 billion in contracts for options that are scheduled to expire.
Let's see the further outlook from the ETH/USDT technical analysis:
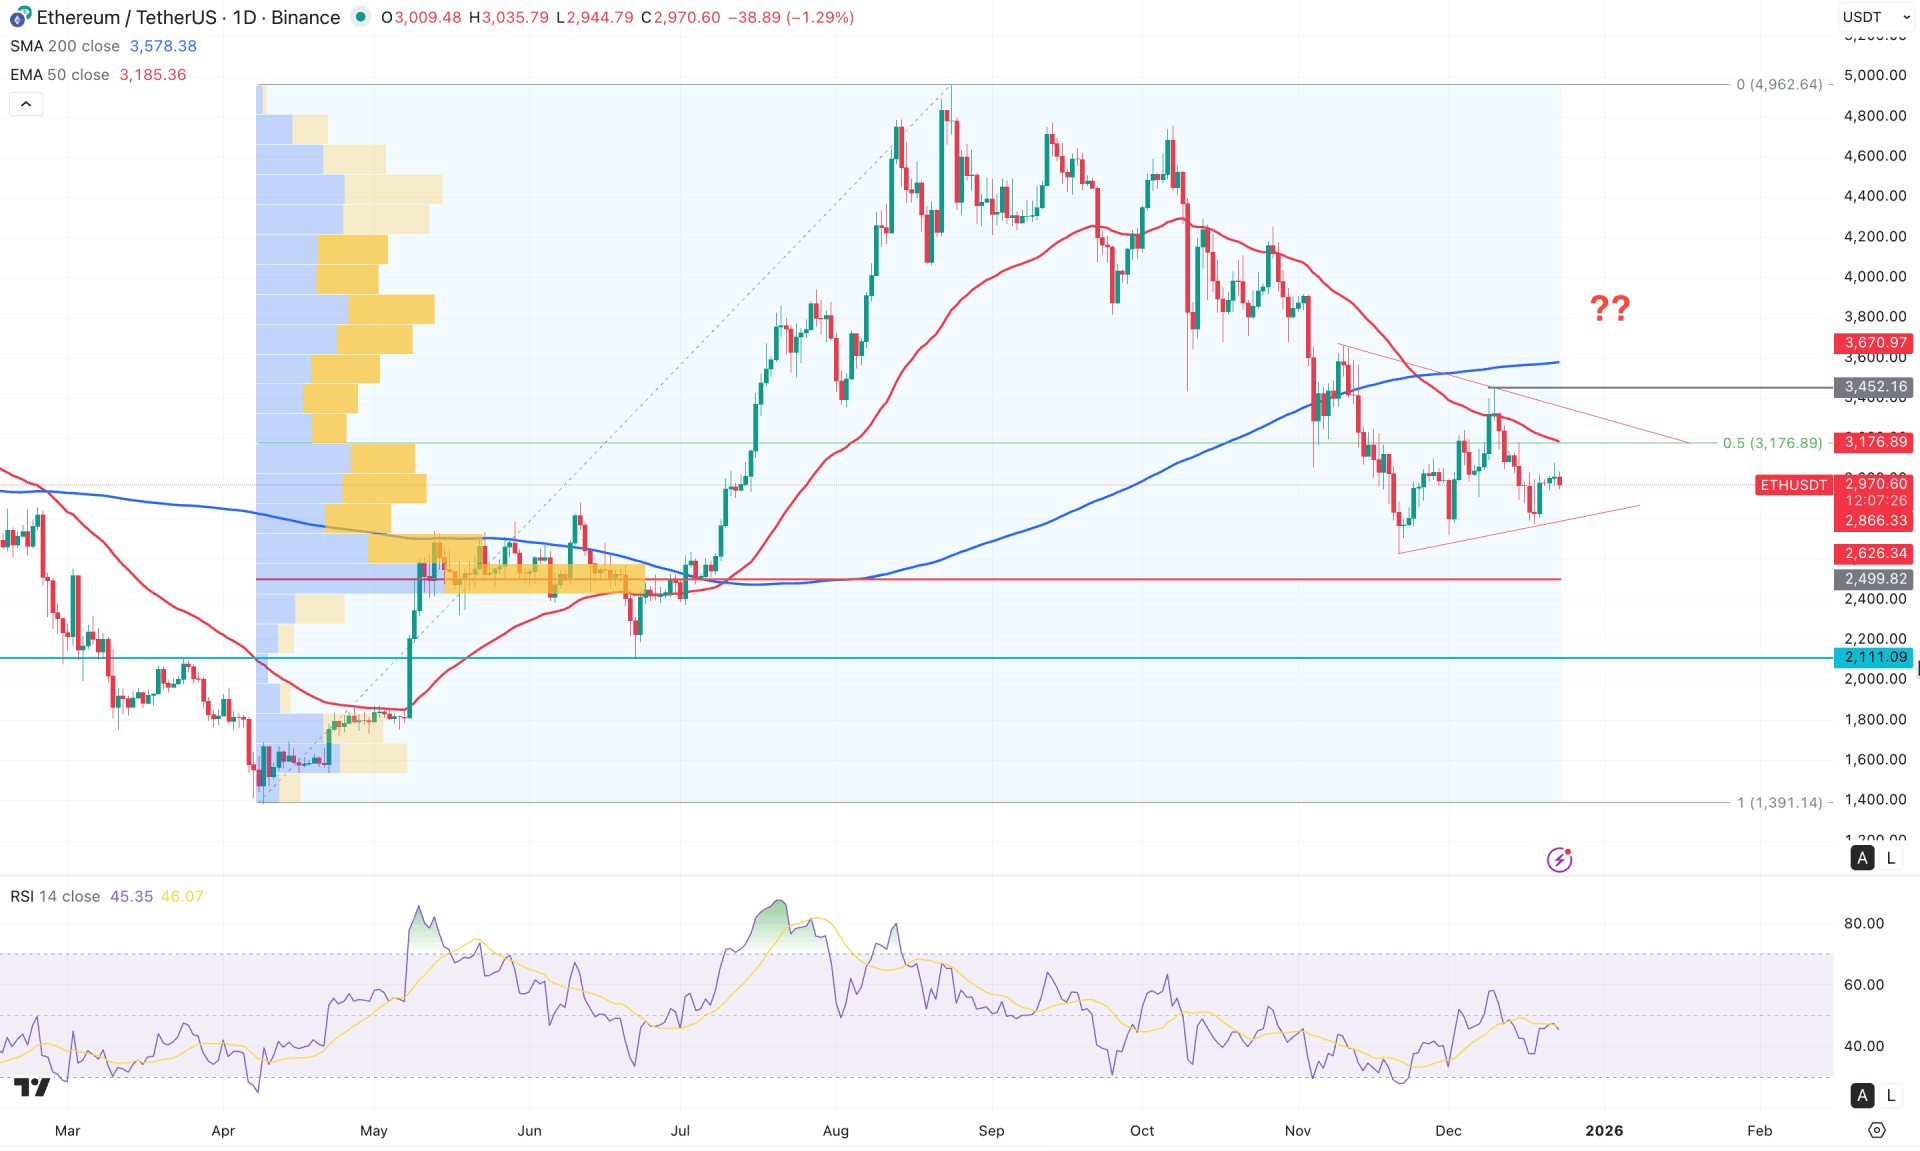
In the daily chart of ETH/USDT, the major market momentum is bullish, even though a considerable downside correction is seen from the all-time high area. Investors should closely monitor how the price reacts in the near-term trading zone, as a valid break below the trendline support could be a bearish trend continuation signal.
In the monthly timeframe, a strong bearish momentum is visible as four consecutive bearish months are clear with no valid bottom formation. In the weekly timeframe, some volatility is seen in the near-term price action, from where a downside continuation is possible.
In the volume structure, the largest activity level since April 2025 is below the current market price and is working as a major support. Primarily, the main market momentum would be bullish as long as the high volume line is protected.
On the other hand, the dynamic 200-day SMA and 50-day EMA formed a bearish crossover, signalling a Death Cross formation. Based on the dynamic lines' position, more downside pressure could come even if the major market trend is bullish.
In the indicator window, the RSI shows a sideways momentum as the current line is hovering at the 50.00 neutral line. Moreover, the recent dip and bullish rebound from the 30.00 oversold line signals a pending bullish continuation above the 70.00 line.
Based on the overall market structure, the ETH/USDT market momentum is bullish, where the current price has reached the crucial discounted zone below the 3176.29 Fibonacci level. As no valid bottom is seen, the price is likely to extend the downside pressure soon. In that case, bearish pressure from the 50-day EMA could be a potential short opportunity, targeting the 2499.82 high-volume line.
On the other hand, an immediate bullish recovery with a valid daily close above the 3452.16 level could validate a bullish break. In that case, the price could move beyond the 4600.00 level after having a minor downside correction.
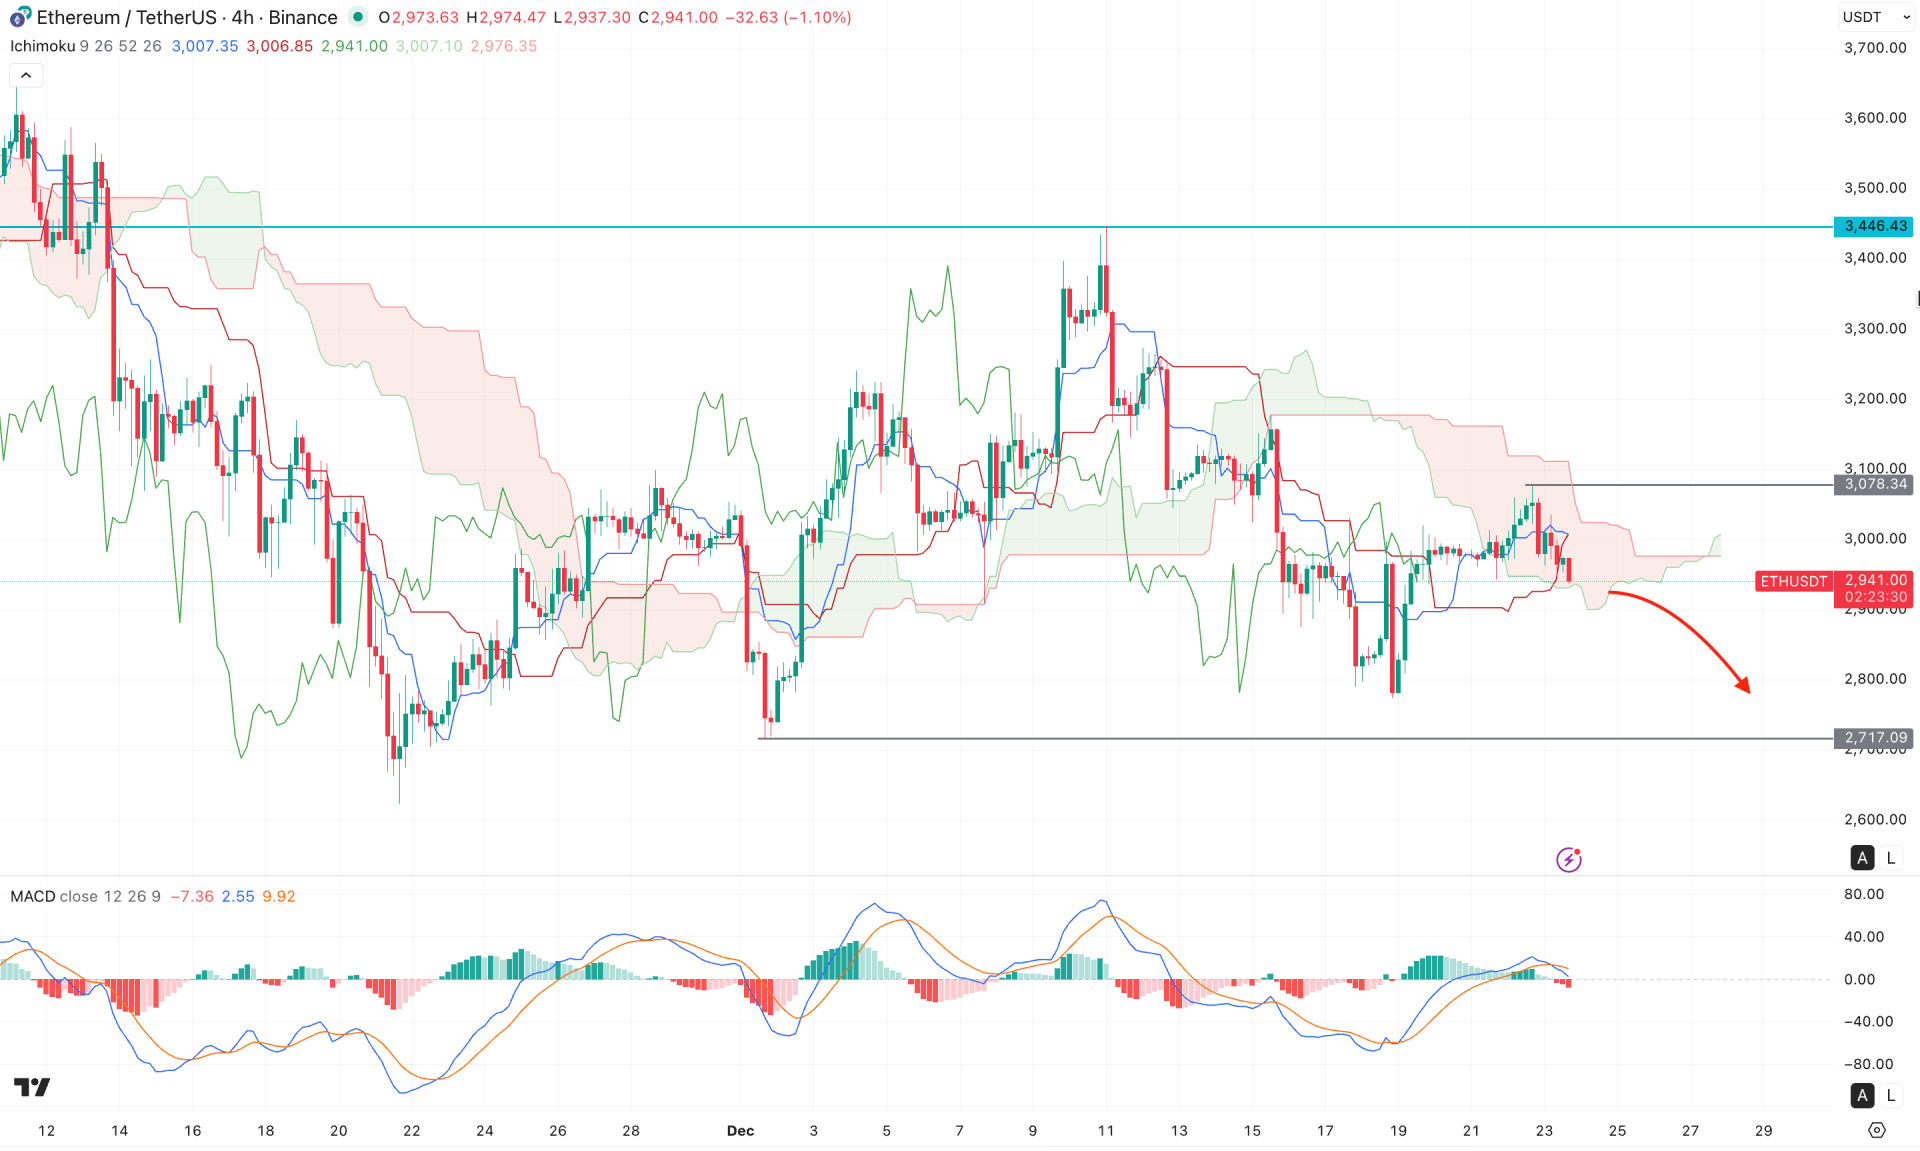
In the H4 timeframe, the ETH/USDT price is trading within a volatile structure, where multiple violations are seen at the Ichimoku Cloud area. In the most recent chart, a bearish break below the cloud area with a bullish recovery to the cloud zone signals a bullish recovery.
In the future cloud, both lines have flipped position, signaling bullish momentum, even though sideways momentum is visible in the dynamic line.
In the secondary indicator window, the MACD histogram has formed multiple bearish bars, accompanied by a crossover in the signal line.
Based on this outlook, the most recent bar shows the candle trading below the dynamic level, which signals a potential downside continuation. In this scenario, the initial target would be a retest of the 2717.09 support level. A decisive break below this level could extend downside pressure toward the 2621.81 support zone.
On the other hand, a failure to sustain downside pressure below the cloud area could challenge sellers. In that case, a bullish recovery with an H4 close above the 3100.00 psychological level may open a long opportunity, targeting the 3400.00 level.
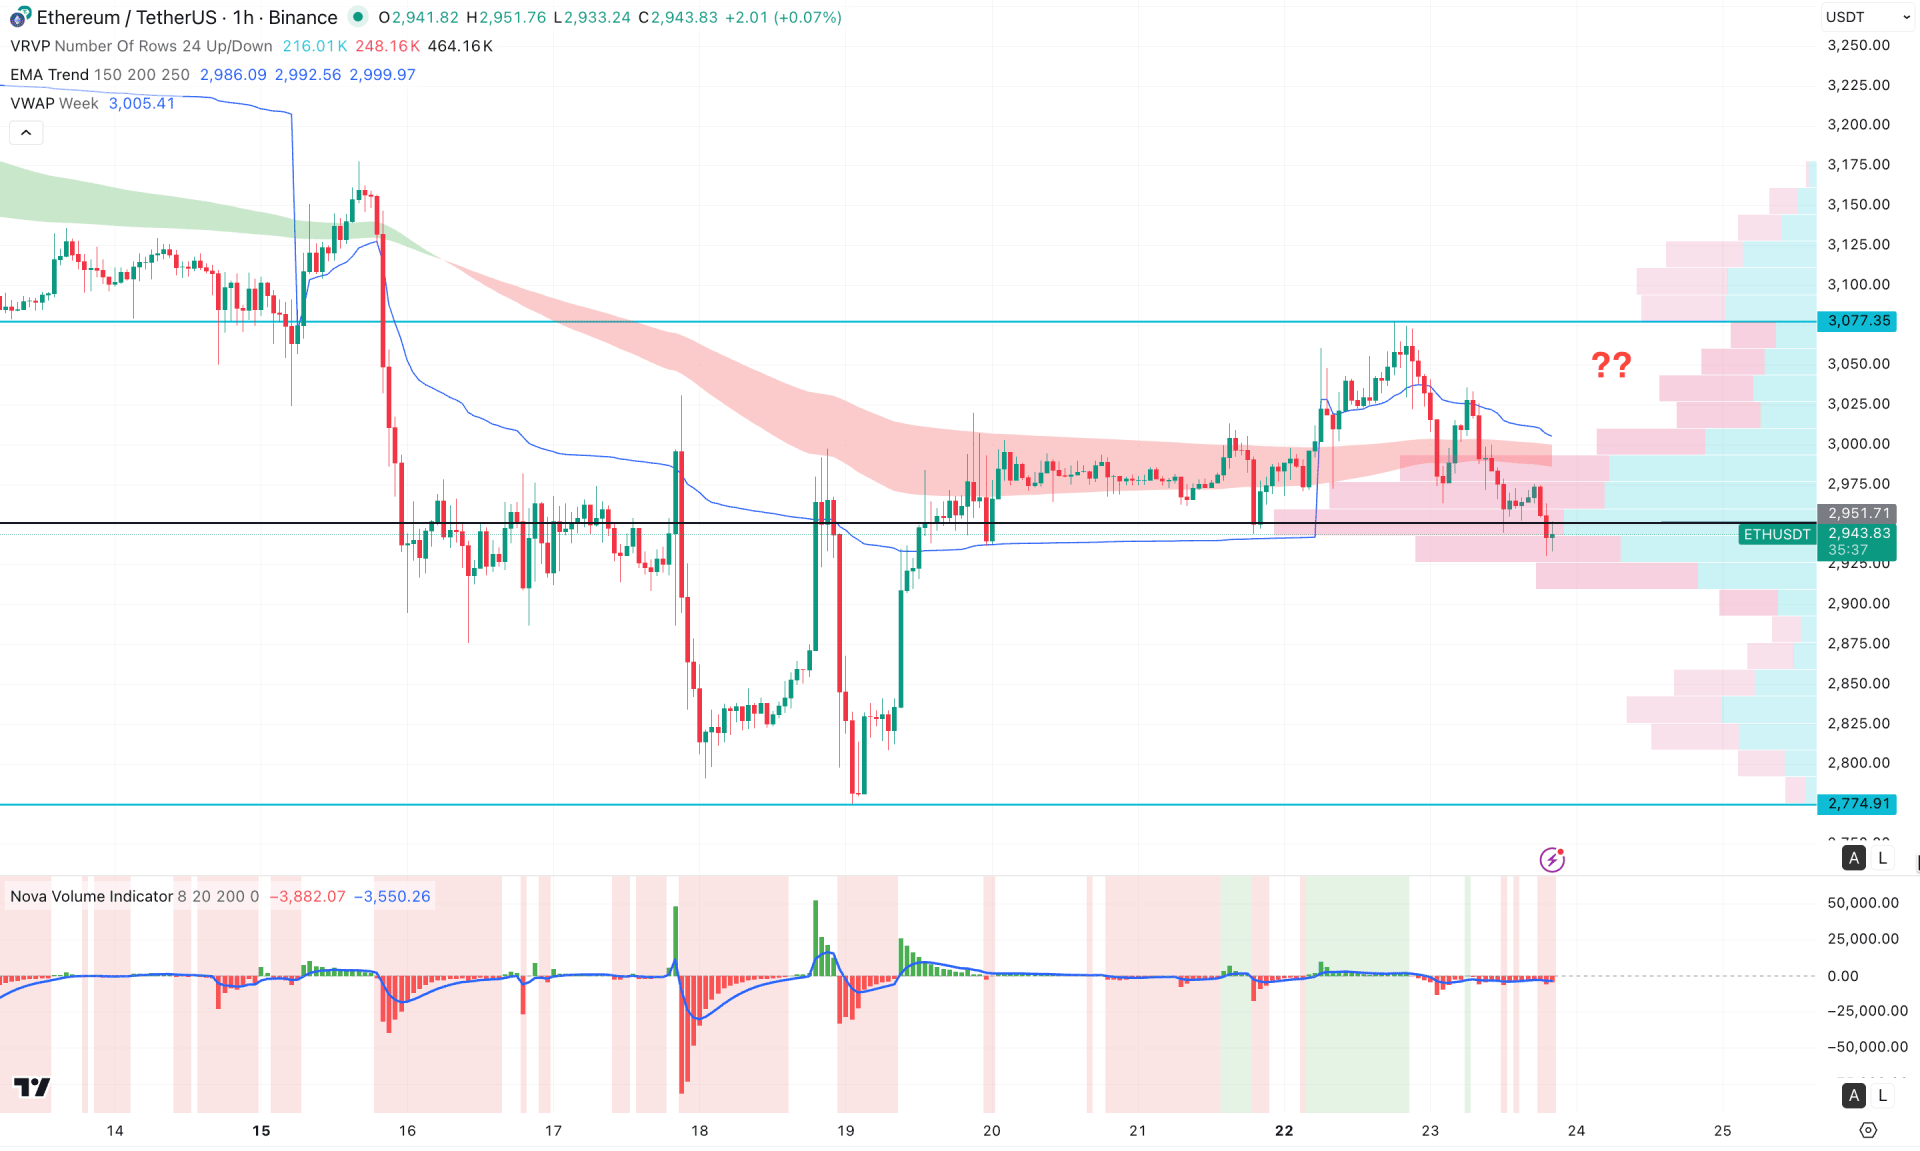
On the hourly chart of ETH/USDT, corrective momentum is visible as the price has failed to sustain buying pressure above key dynamic levels. The weekly VWAP is hovering above the current price with a downward slope, signaling a potential bearish continuation. Moreover, the most recent hourly candle closed below the high line, which is also a strong bearish signal.
In the secondary indicator window, the volume histogram suggests reduced trading activity in recent sessions, with bears remaining in control since the start of the day.
Based on this outlook, further downside pressure may emerge as long as the price remains below the 2951.71 high line. However, strong liquidity from a prior bullish recovery remains in play, and a decisive close above the VWAP line could invalidate the current bearish structure at any time.
From a broader market perspective, ETH/USDT is still trading within a bullish structure, even though the price is currently trading below its all-time high. Investors should closely monitor price action for a bottoming formation, as a strong recovery could resume the prevailing uptrend at any time.


