
Published: March 24th, 2022
Ethereum Classic (ETC) ignored the death cross in the weekly chart and showed intense buying pressure this week. The bullish sentiment came from traders’ betting to consider the ETC network a haven for miners than the rival Ethereum blockchain.
The ETC has a close positive correlation with BTC, where in some cases, the ETC follows the 98% movement of Bitcoin. However, the current 80% gain of the last eight trading days outperformed Bitcoin’s 16% gain for the same period. Therefore, it is a sign that miners might consider it an attractive space to mine from its origin, Ethereum. However, investors should keep in mind some threats to miners before choosing ETC as an investment opportunity- like leaving the network to a few miners created a double-spend attack on Coinbase in 2019.
Last year, Ethereum’s move to proof of state resulted in a disruption in the community, especially to those who still prefer the proof of work mechanism. As a result, Ethereum Classic might be the solid alternative to Ethereum. However, the recent 80% weekly gain did not come with an increased hash rate, which is a sign that the buying pressure went without any significant involvement of miners. If miners join, the price of ETC/USDT will soar, beating near-term highs of 65.25.
Let’s see the upcoming price direction from the ETC/USDT technical analysis:
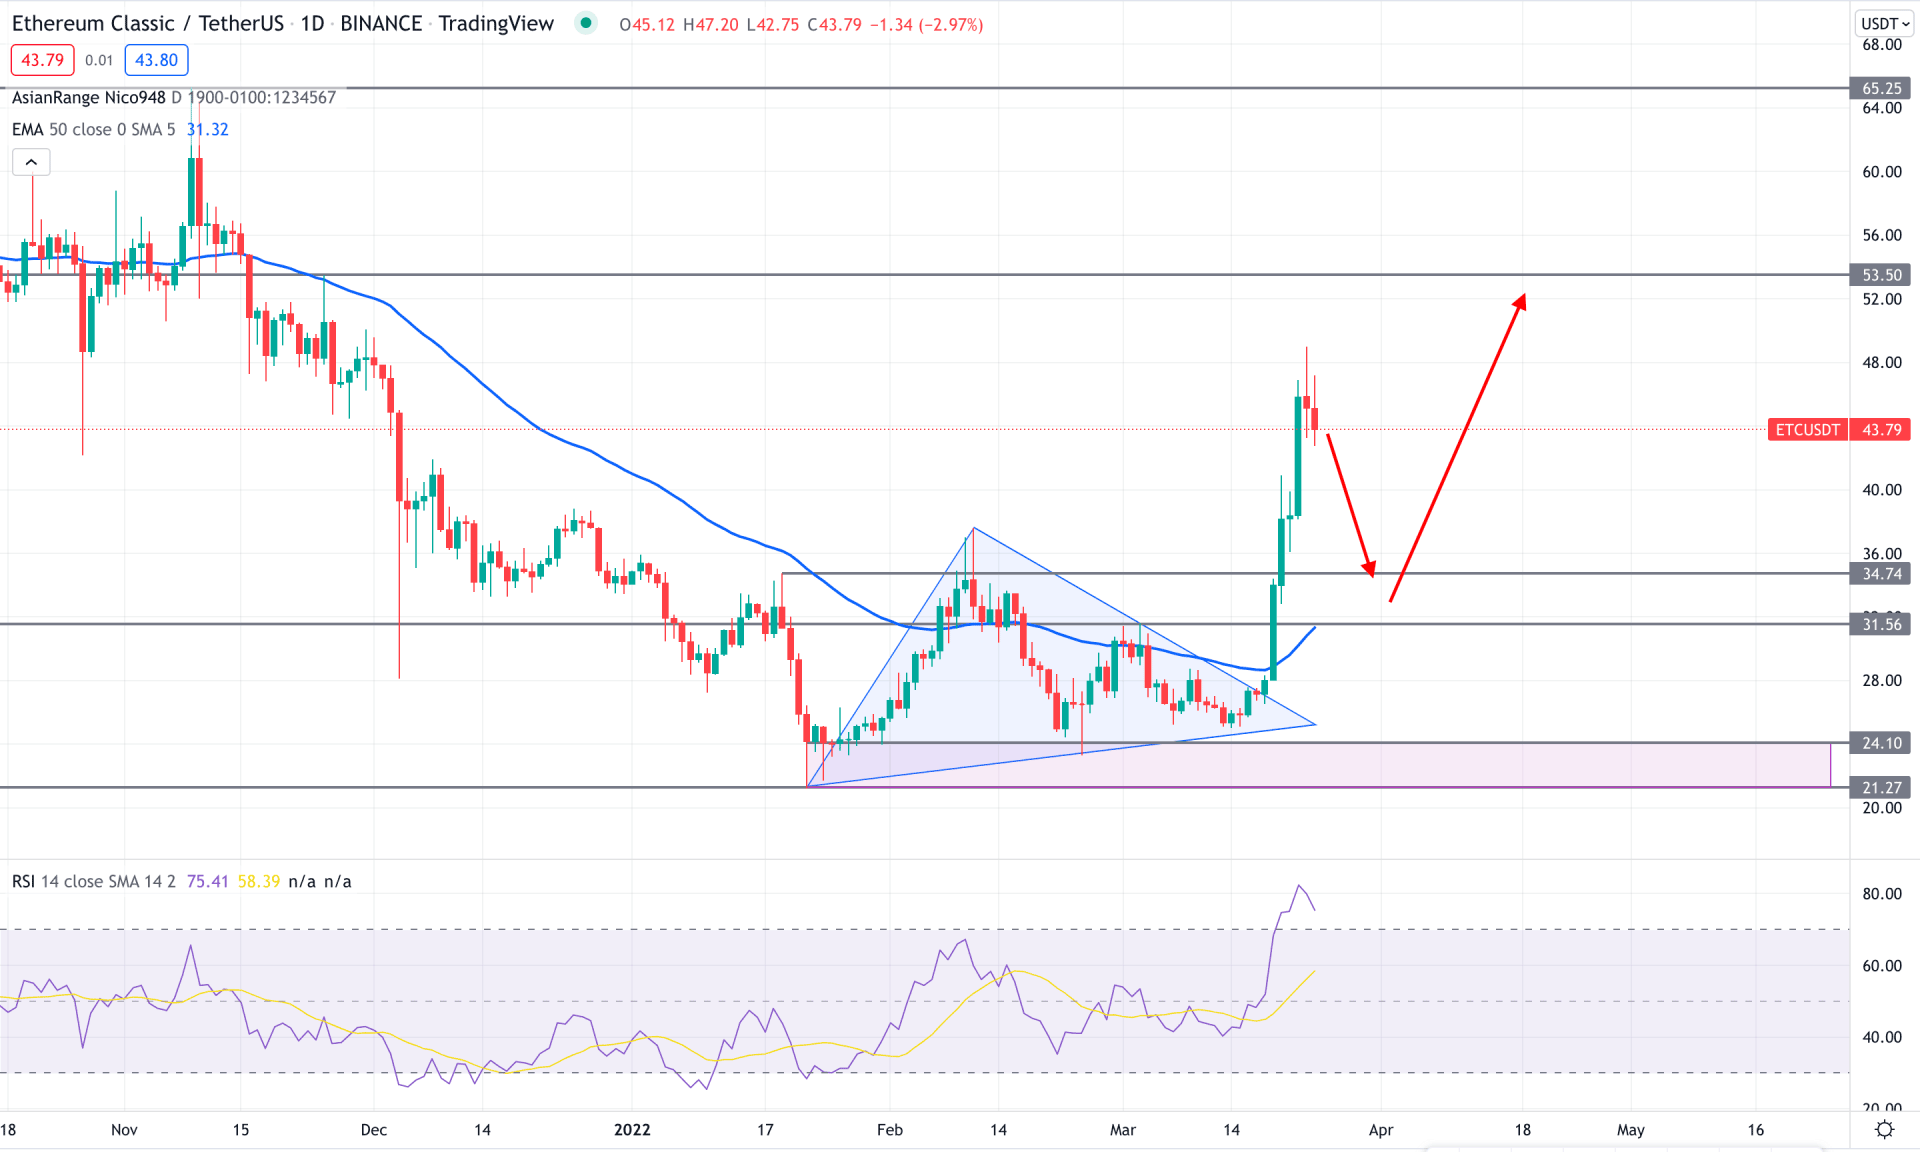
In the ETC/USDT daily chart, the price shows a long-selling momentum from 65.75 to 21.27 level with an impulsive bearish pressure. However, the selling pressure became weaker as soon as the bulls made the first breakout of the structure of this year by taking the above 34.74 swings shown. Moreover, the extreme buying pressure of last week came with a bullish symmetrical triangle breakout with an impulsive counter momentum. Therefore, as the price showed a stable price action above the 50 EMA, we can expect another buying leg after a considerable correction.
The above image shows that the RSI is above the 70 levels while the gap between the price and dynamic 50 EMA is extended. These indicators offer an overbought price where a corrective bearish trend after the profit-taking would be a bullish opportunity.
Based on the current price action, investors should closely monitor how the price corrects lower where any bullish opportunity from 37.00 to 31.00 would be a potential buying opportunity. However, a closer look at the intraday price is mandatory while taking the trading decision.
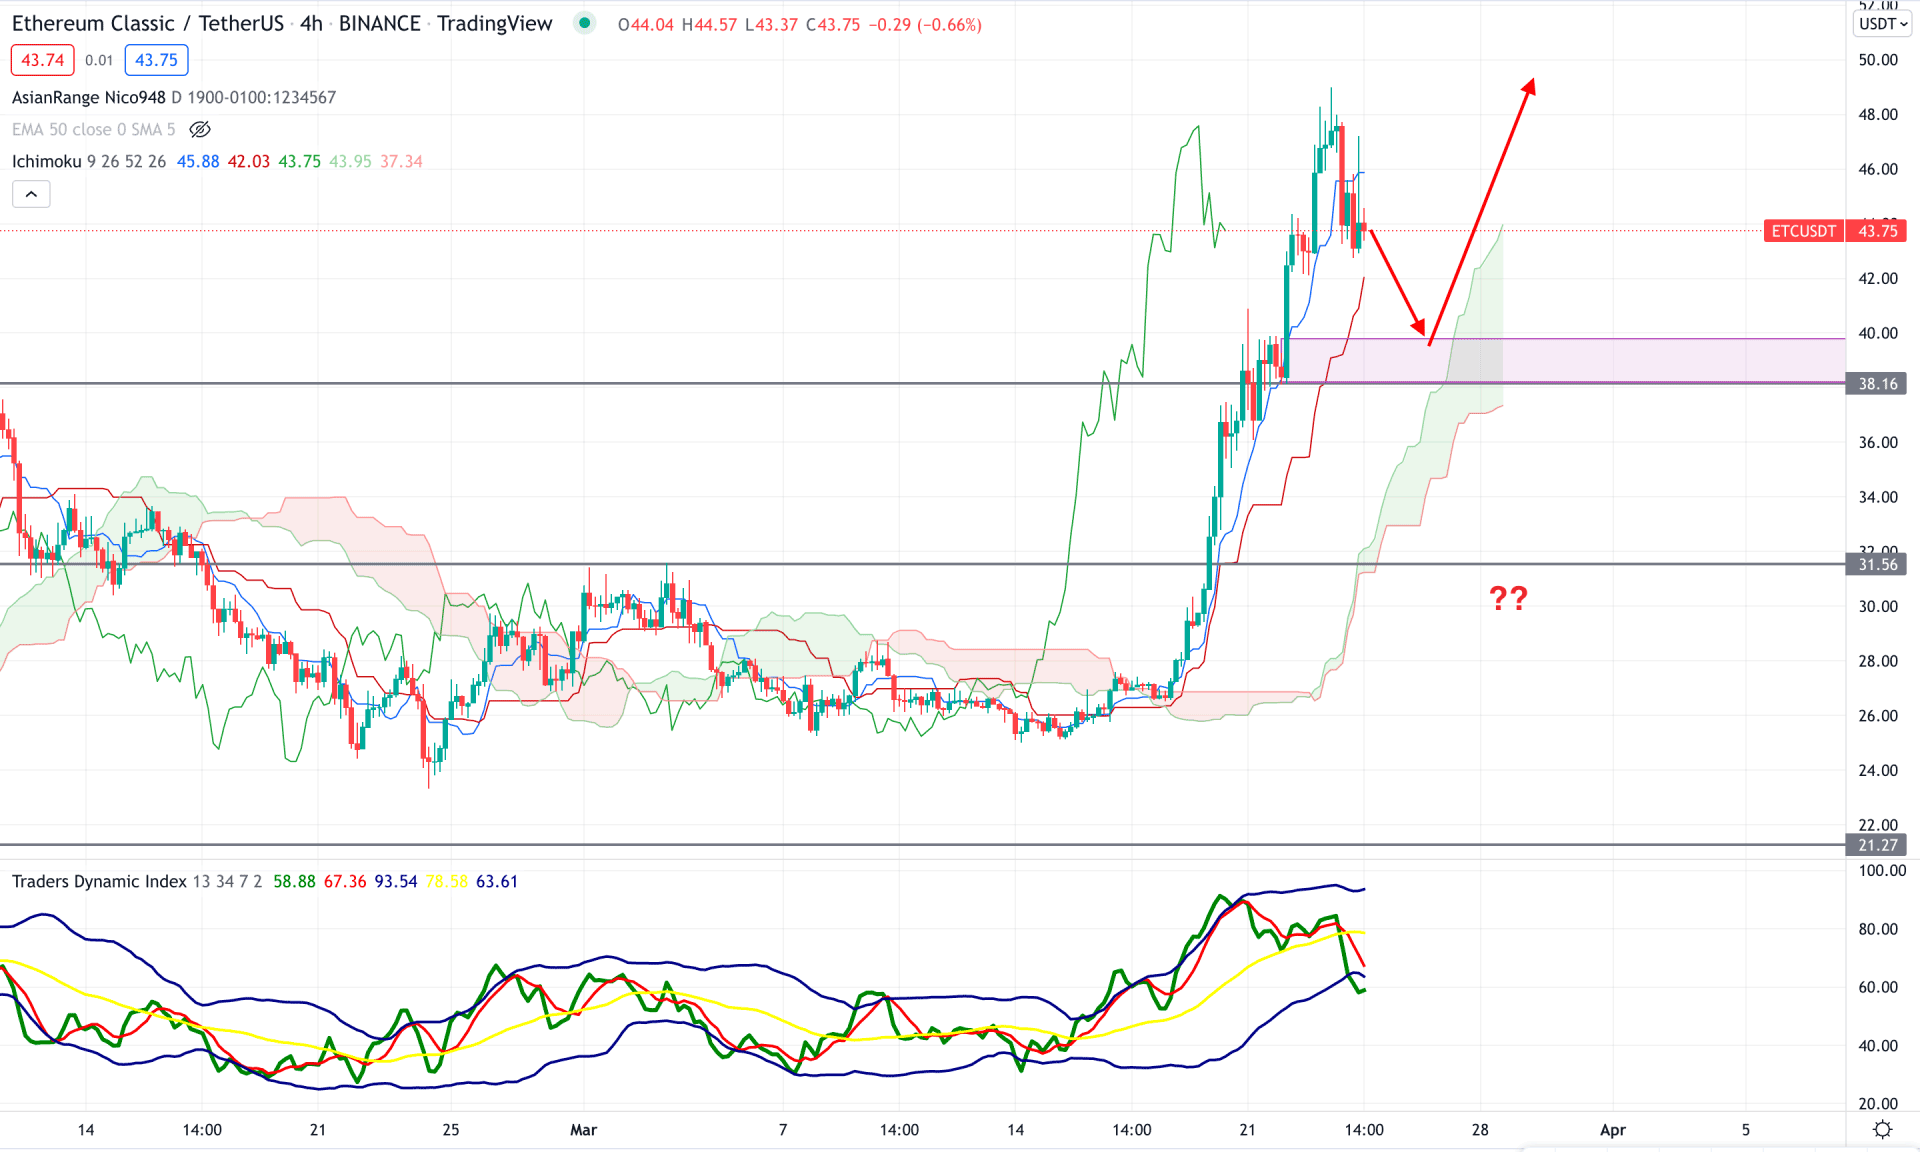
According to the Ichimoku Cloud analysis, the ETC/USDT price is trading within a strong bullish momentum as the bullish swing from 26.58 level shoots higher above the Kumo cloud. However, the bullish momentum from 25.58 to 49.00 level came without a considerable correction. However, the intense buying pressure changed the future cloud direction from bearish to bullish, with an open opportunity to join the trend after a correction.
The above image shows that the price moved below the dynamic Tenkan Sen, which is the first violation of the near-term support. However, the current price is still above the Kijun Sen line while the near-term demand zone is at the 40.00 level. On the other hand, the trader's dynamic index showed a selling pressure from the TDI line below the lower band, which signifies a rebound in the price.
Therefore, as long as the price trades above the 38.00 level, we can expect bulls to appear again to create a new swing high. If any bullish rejection occurs from 40.00 to 38.00 are within, we can consider it a buying opportunity. On the other hand, the break below the 31.56 level with a bearish daily close might alter the current market structure with a bearish chance towards the 21.27 level.
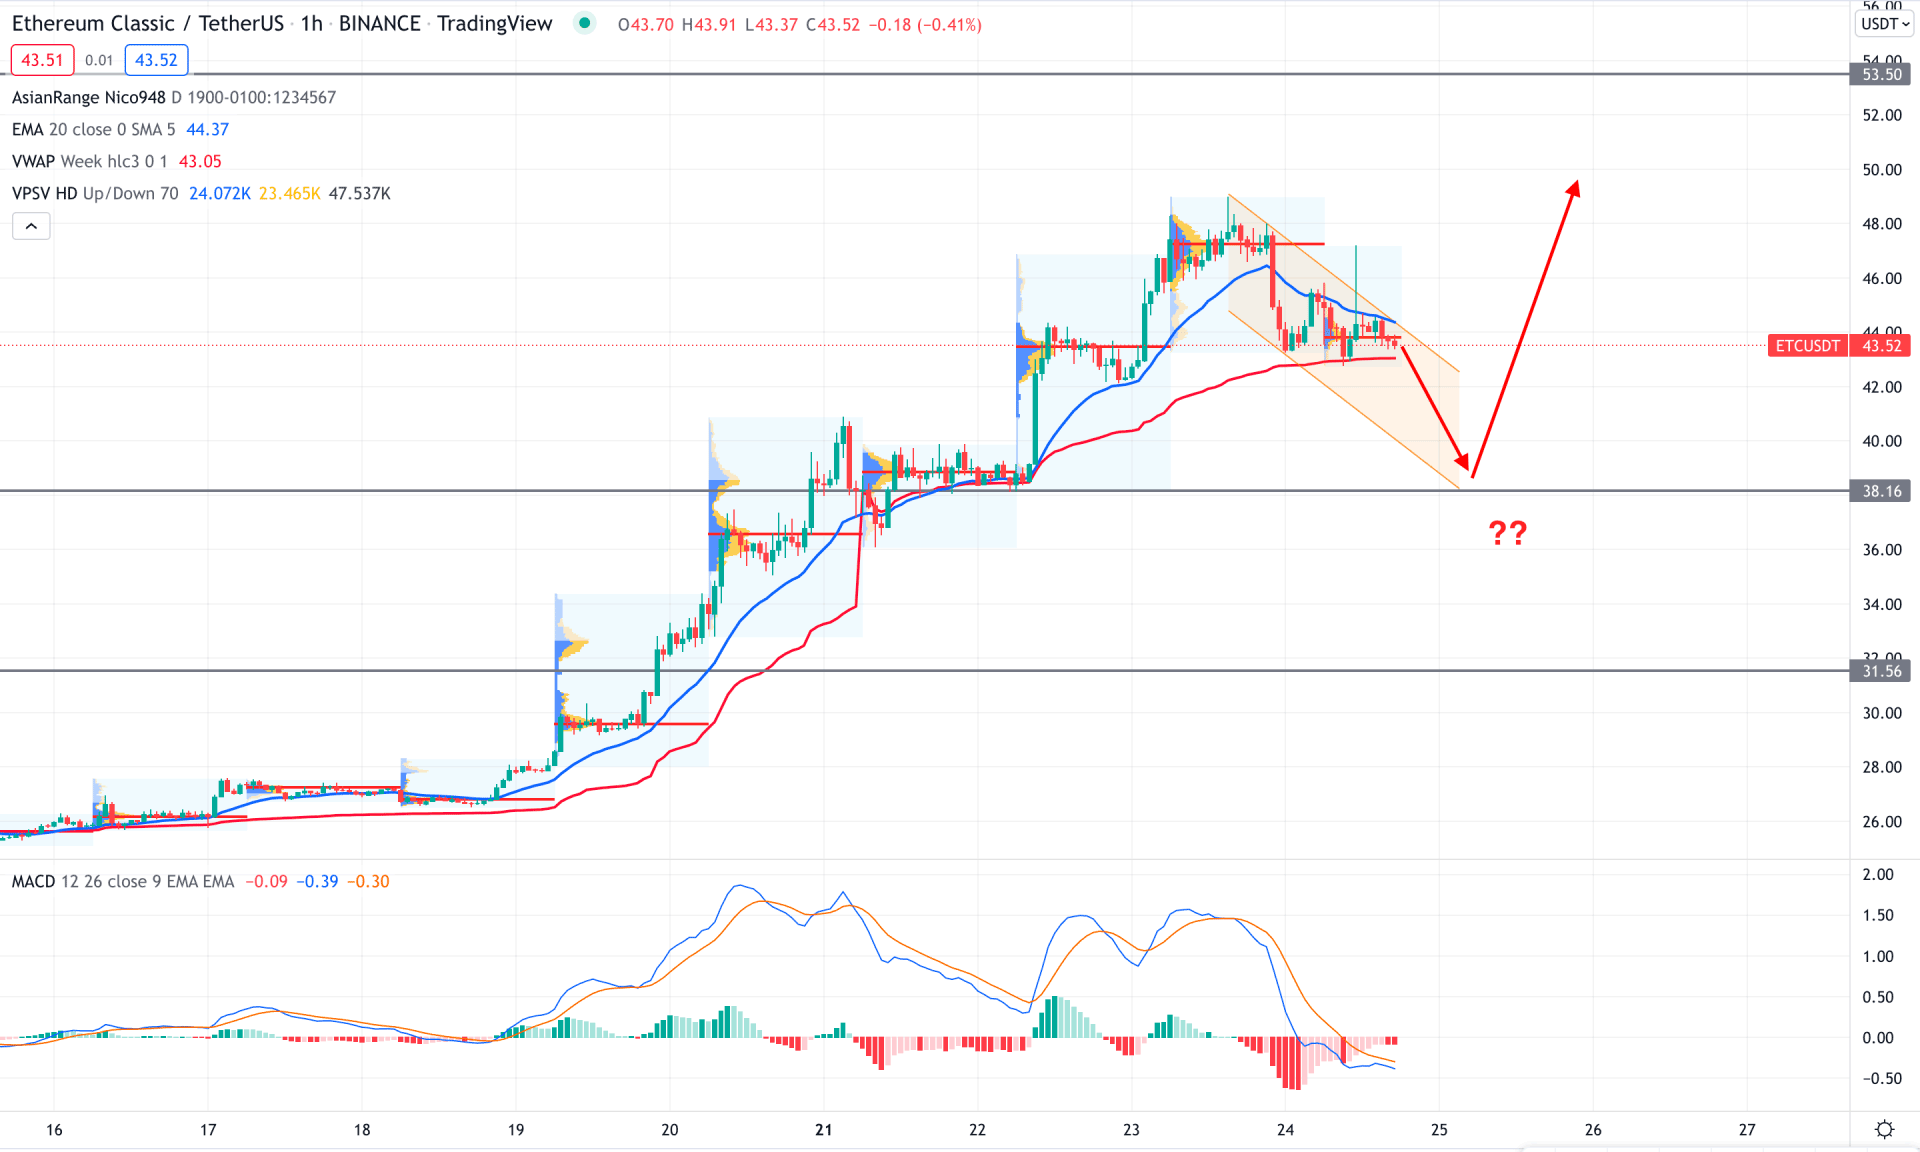
In the intraday chart, we can see that the strength of new higher highs is losing momentum. Moreover, the most recent price moved below the dynamic 20 EMA and showed multiple bearish rejection candles. In that case, investors should wait for a bullish price action above the dynamic 20 EMA before considering taking buys in this pair.
The above image shows how the MACD Histogram moves to the neutral zone, indicating that bears are losing momentum. On the other hand, the most recent high volume level remains near the current price while the dynamic weekly VWAP is below the price.
Based on the intraday price structure, the emerging bearish channel may extend the selling pressure towards the 38.16 level if the H1 candle closes below the dynamic weekly VWAP. On the other hand, a sharp rebound with an H1 candle above the dynamic 20 EMA would be a buying opportunity where the primary target would be 53.50 levels.
Based on the current multi-timeframe analysis, ETC/USDT is likely to move higher as the daily chart showed multiple bullish structure breaks. In that case, investors should closely monitor the intraday price action where any buying opportunity from H4 demand would make another swing high in the chart.


