Published: January 5th, 2023
There is no clear view regarding the recent bullish momentum in the Ethereum Classic price. However, experts believe that the regulatory crackdown on the ETH network influences investors in this token. The Ethereum merge shifted the PoW protocol to POS in 2022, which was a significant change in the network validation system.
The Marge was an essential part of the transition for Ethereum. For instance, it set up further upgradation over the forthcoming future. It is expected that all these upgrades will make Ethereum a much faster and better platform. Anyway, this feature of staking signifies that the platform Ethereum will be expressed to regulatory observation, particularly in the U.S.
Hence, Ethereum Classic's price more reasonably surges upside for these challenges anticipation. Some financial analysts confide that it might be an advantage since the creation in 2017 of the ETH hard fork.
Another possible cause for the price surge is that it could be a short squeeze, which occurs when investors drive up an overmuch shorted financial element. The recent data revealed the asset ETC is massively shorted due to investors' concerns about the fragile ecosystem of the platform.
Should you invest in Ethereum Classic now? Let’s see the complete outlook from the Ethereum Classic (ETC) technical analysis:
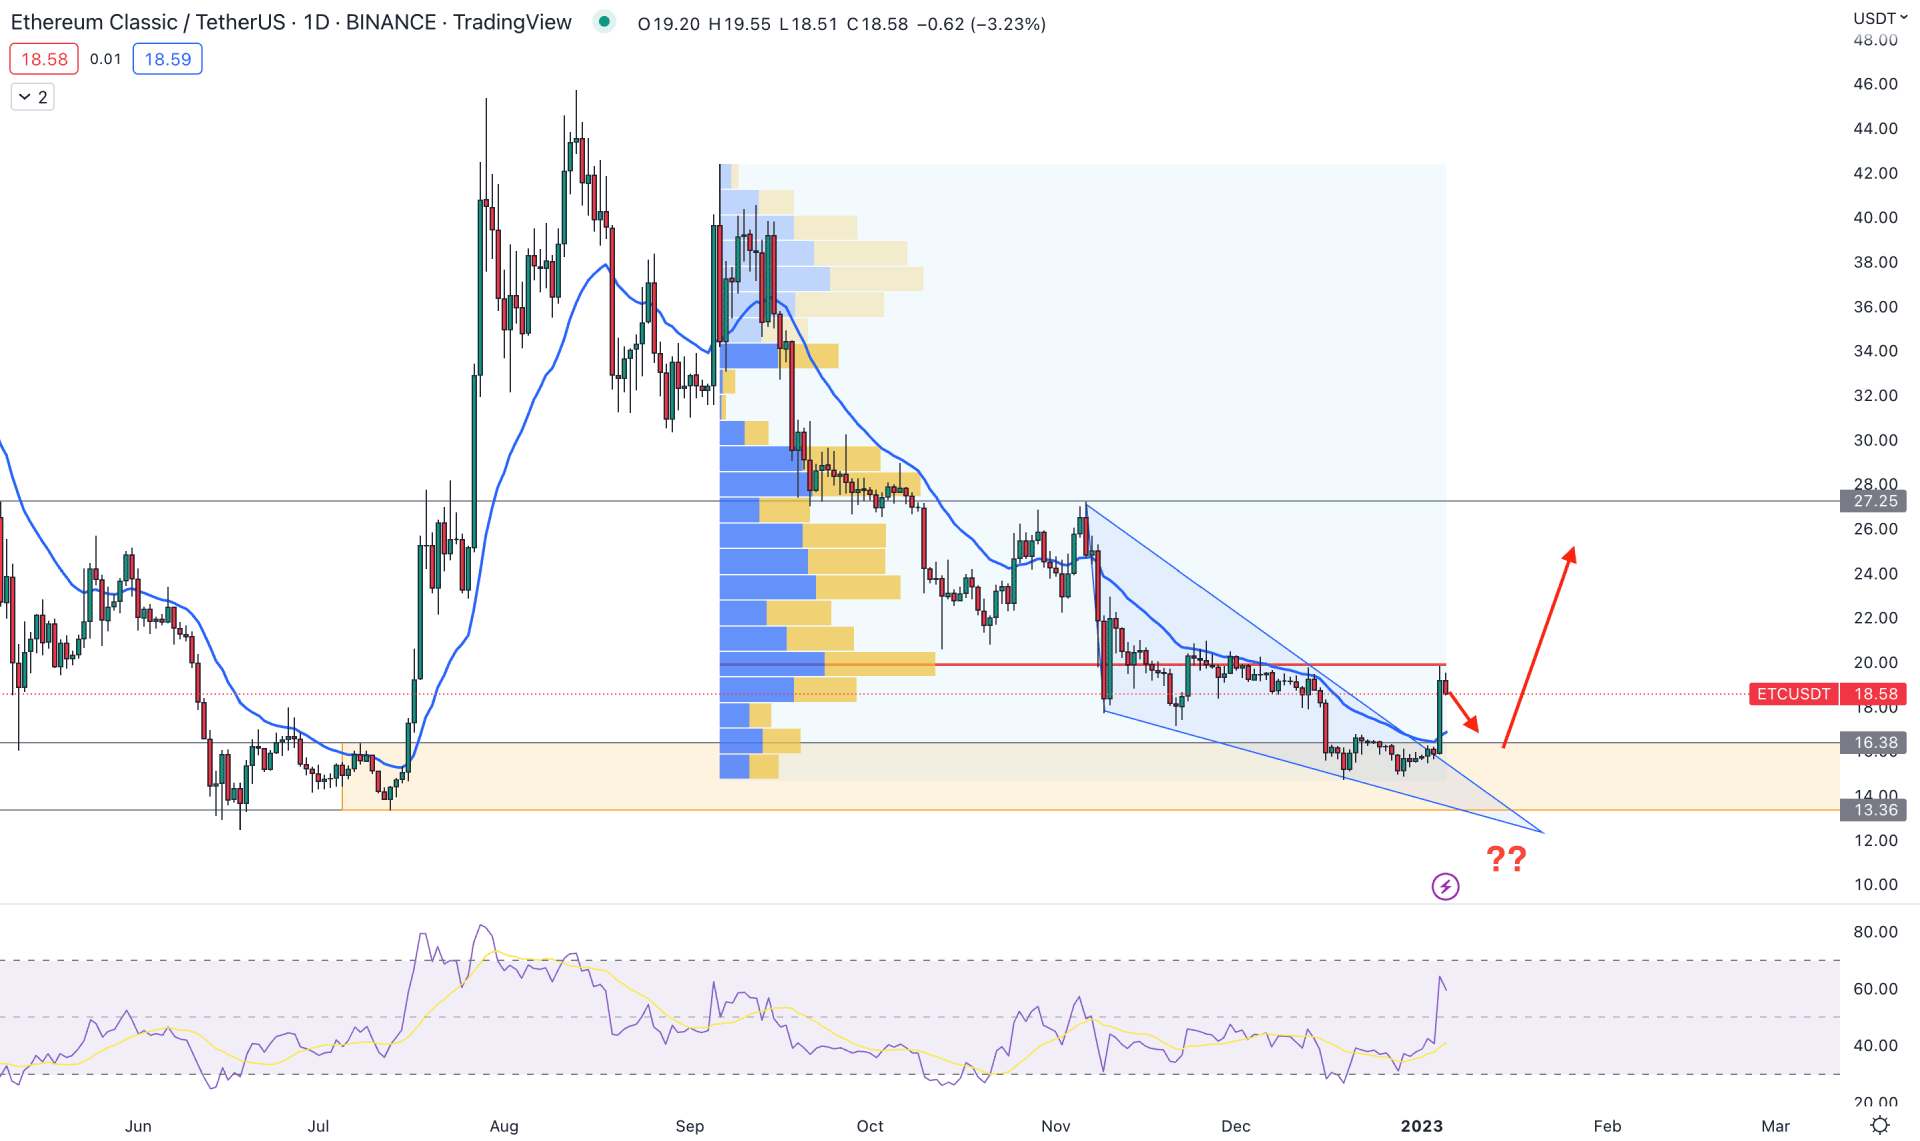
The daily price of Ethereum Classic (ETC) offers a recent buying opportunity as its technical outlook is solid as per the current supply and demand zone.
The existing buying pressure in July 2022 came with an impulsive momentum that created a 167% surge from the bottom. The buying pressure at that time left the 16.38- 13.36 area as a valid demand zone. As the current price came to that zone again and formed a bullish rejection, it would be a valid buying opportunity.
The highest trading volume level from September 2022 high to December 2022 low is at 19.88 level, which is above the current price. Therefore, the conservative buying approach is to wait for the price to move above the 19.88 level with a daily candle close.
The bullish breakout from the symmetrical triangle pattern is visible, where a daily candle moved above the 20-day Moving Average after 2 months.
In the indicator window, the Relative Strength Index (RSI) moved above the 50% level, which is a sign of increased buying pressure in the market.
Based on the current daily outlook of ETC, the bullish possibility is solid and the aggressive approach is looking for a long opportunity from the 16.50 to 14.00 area. On the other hand, a break below the 13.36 level with a bearish daily candle could eliminate the bullish possibility, and lower the price toward the 10.00 level.
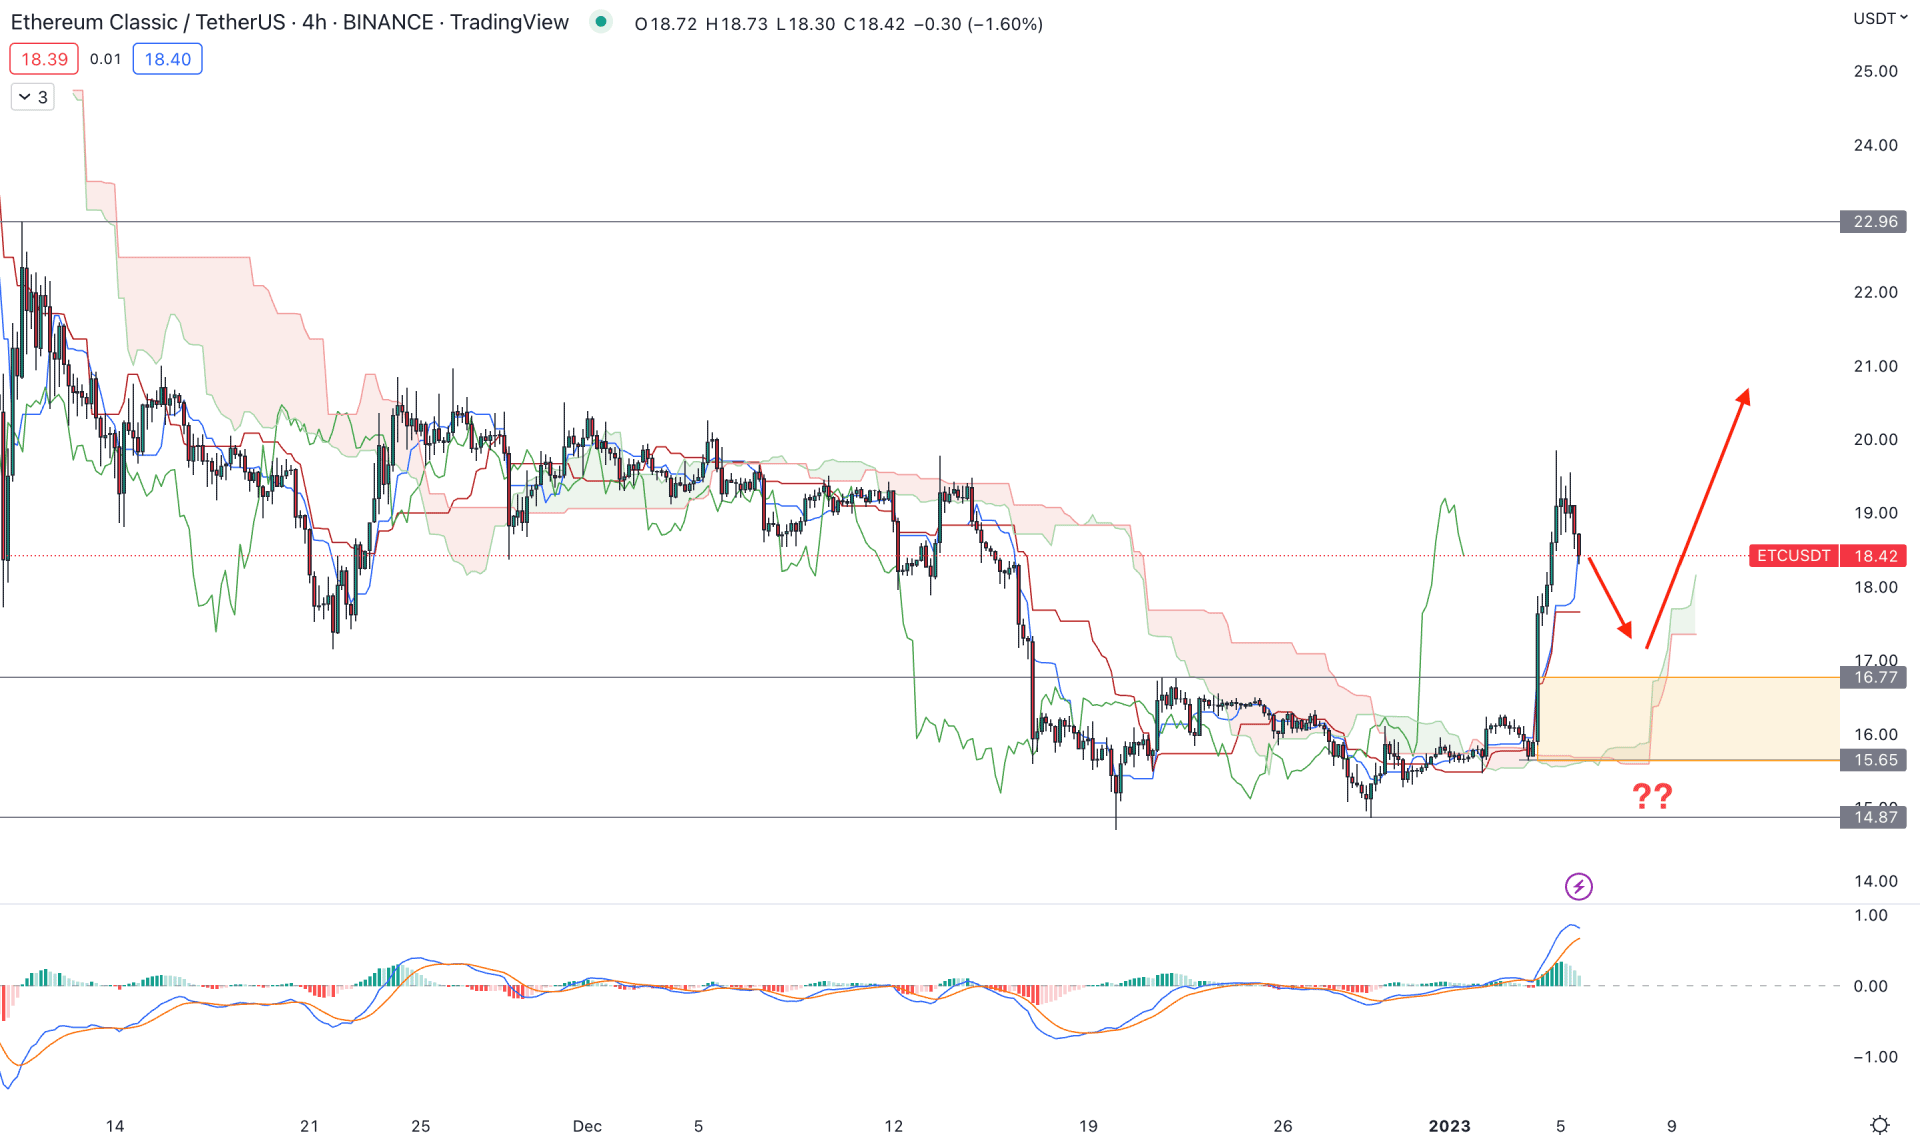
In the H4 timeframe, the broader outlook of the ETC price is bullish as there is a strong impulsive movement above the dynamic Cloud zone. The valid breakout from the cloud support is a sign that bulls are interested in this token and can increase bullishness in the coming days.
In the future cloud, the Senkou Span A is above B, while the MACD EMA reaches the upper boundary. It is a sign that bulls initiated a primary wave, where a minor bearish correction is still pending.
Based on the H4 outlook, a valid correction and a bullish rejection from the 16.77 to 15.65 level could offer a long opportunity toward the 22.96 resistance level. However, breaking below the 14.96 level could eliminate the bullish structure and initiate a new bearish trend toward the 10.00 area.
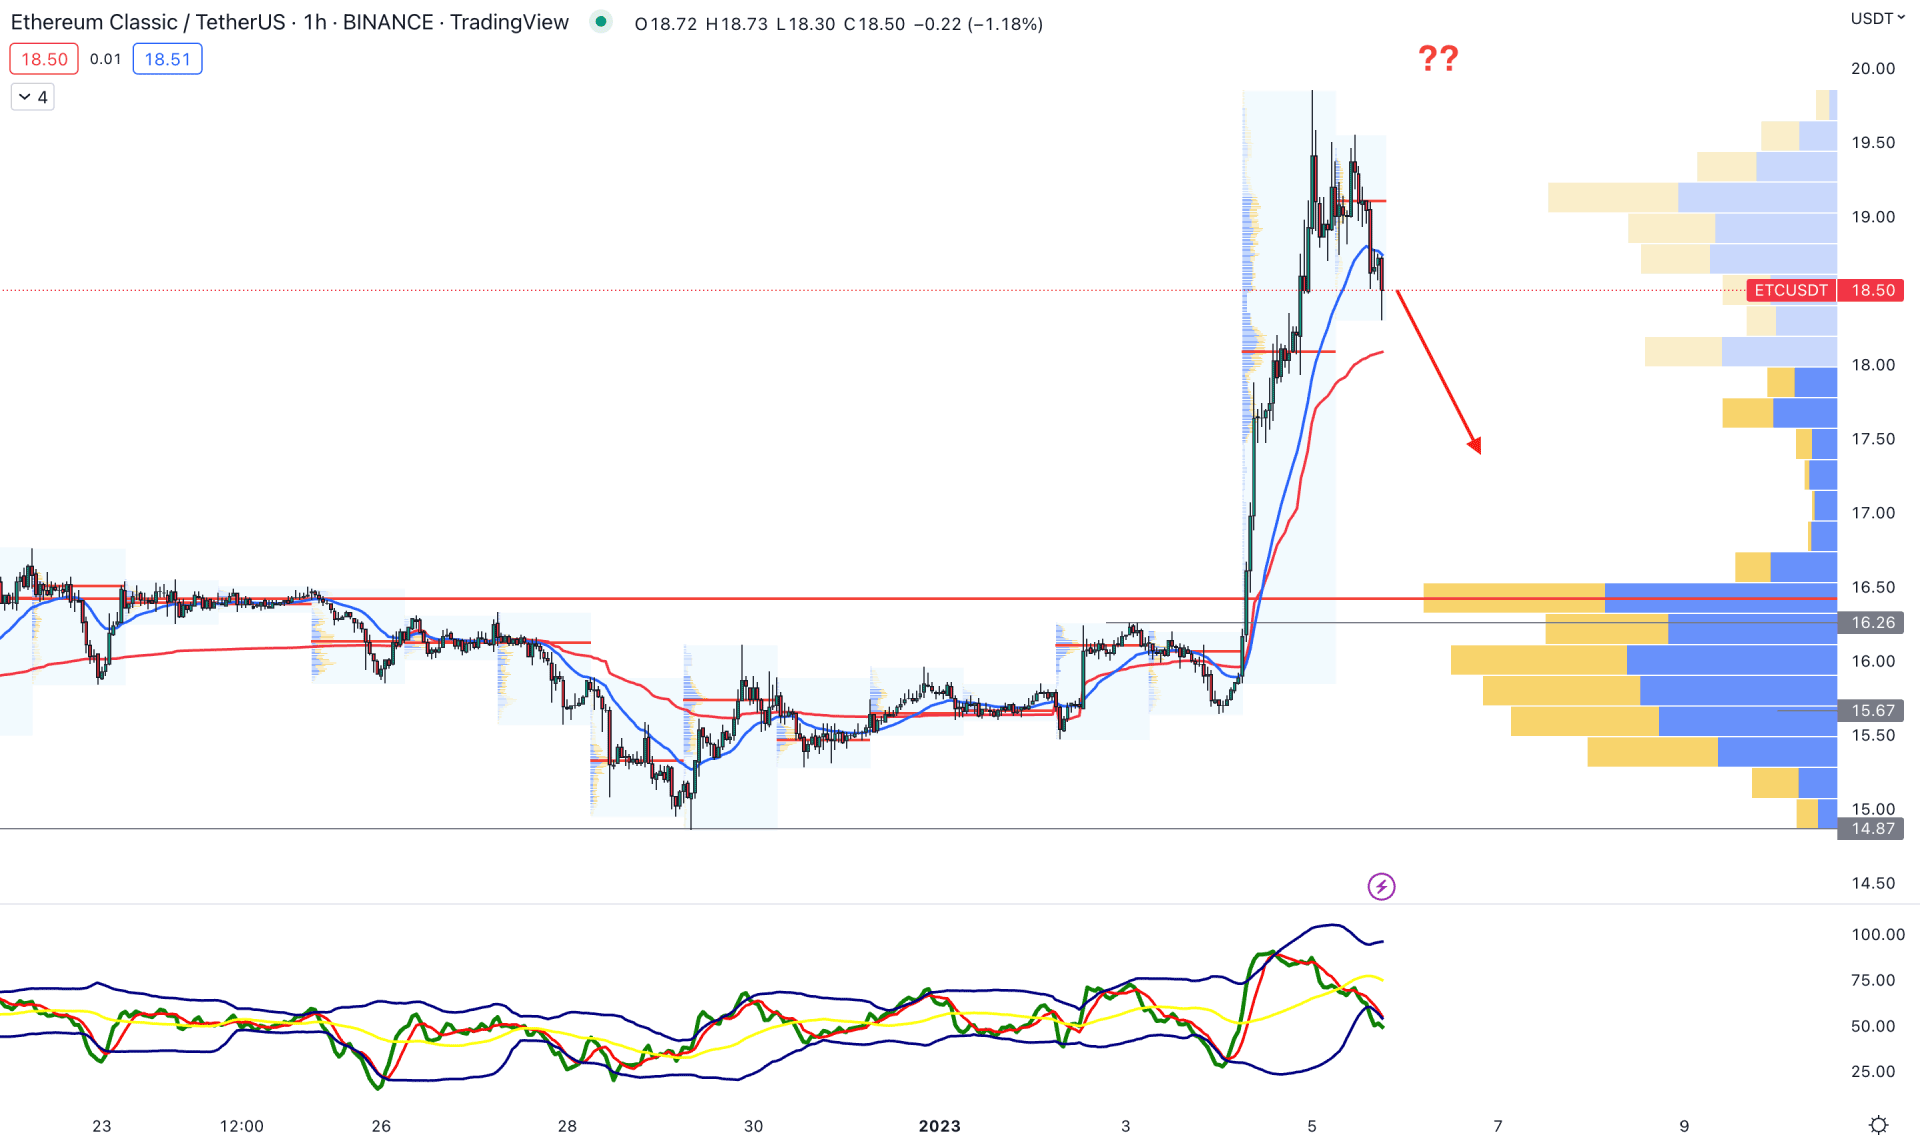
In the hourly chart, the bullish trend continuation opportunity is visible where the current price is trading 13.54% higher from the breakout point. Moreover, the visible range high volume level is below the current price, where a bearish correction is pending.
The selling pressure from the 19.85 top is visible with a lower low formation in the intraday high volume level. Moreover, the recent H1 candle moved below the dynamic 20 EMA, while the Traders Dynamic Index reached the lower band.
Based on the H1 price action, the buying possibility in the ETC price is valid, where a bearish correction is pending. In that case, a new H1 candle below the dynamic VWAP could lower the price in the coming hours toward the 16.26 high volume level.
Based on the current multi-timeframe analysis, the bullish possibility is potent in this token, where a proper validation is needed from the intraday chart. Investors should observe the H4 correction and wait for a solid bullish rejection before opening a long position.


