
Published: June 28th, 2023
In the past week, Ethereum Classic (ETC) has experienced a surge in favourable volume, resulting in a significant price increase. The token has experienced an extraordinary increase of over 22%, surpassing the $15.79 resistance level in the latest week.
As the global market capitalization rises and Bitcoin approaches the $31,000 mark, favorable indicators suggest that Ethereum Classic may experience further gains. A growing momentum could propel the token past the $20 threshold in the coming days.
Ethereum Classic emerged in July 2016 due to a hard fork of Ethereum, which is predominantly a smart contract network that supports decentralized applications (DApps). ETC is its native token.
The initial objective of Ethereum Classic was to preserve the integrity of the original Ethereum blockchain after a significant hacking incident resulted in the seizure of 3.6 million ETH. Another objective was to preserve the Ethereum blockchain in its original state without artificially mitigating the effects of the DAO breach.
As a nonprofit organization, ETC's developers have no intention of turning the network into a for-profit enterprise. Using the proof-of-work (PoW) mining algorithm, users pay transaction fees comparable to Ethereum's, and miners are compensated for the work they contribute.
Let’s see the upcoming price direction of Ethereum Classic from the ETC/USDT technical analysis:
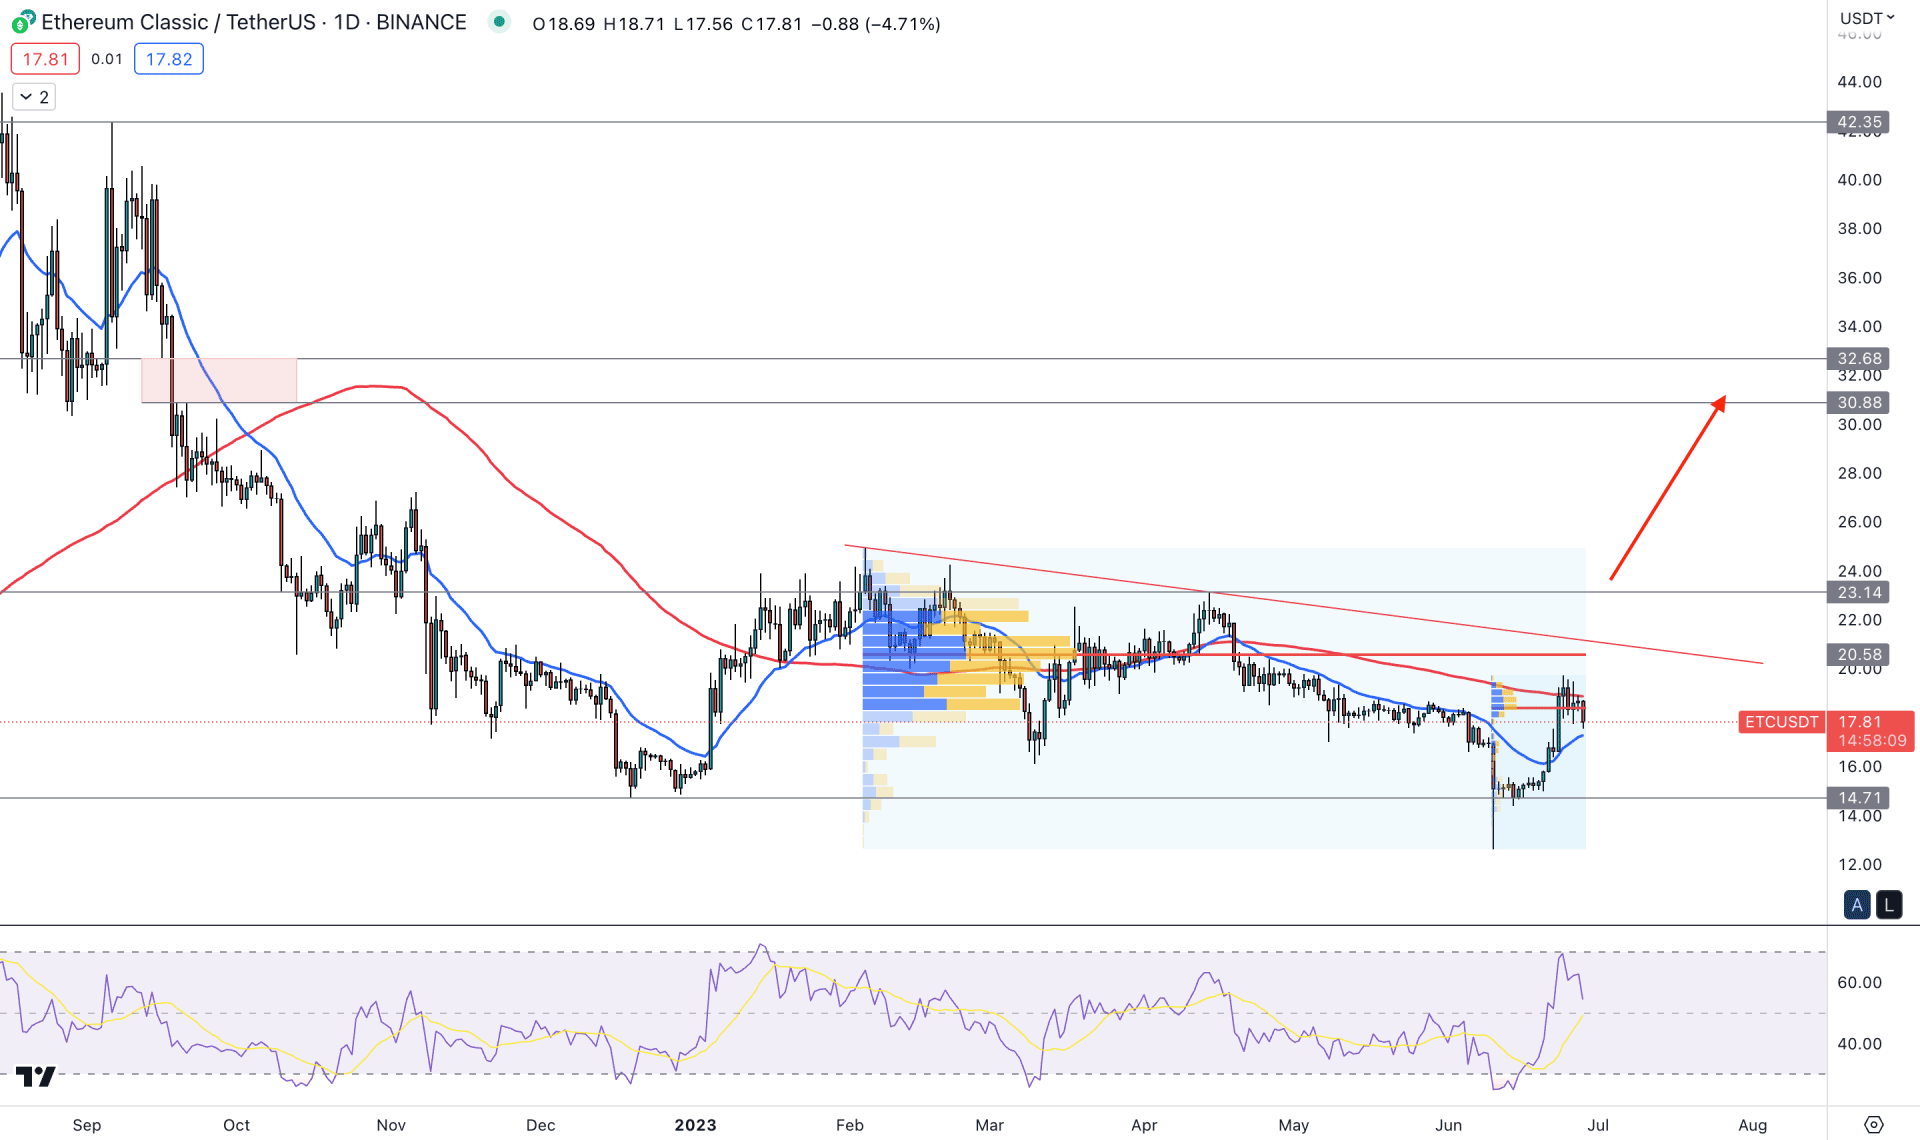
According to the daily price of ETC/USDT, the past few months were negative for the coin. While the current BTC price is above $31K, ETC is trading 27% down from the current yearly high. However, the recent chart shows a bullish break above the 20-day EMA and 50-day SMA levels, which may alter the existing downside momentum.
The monthly closing is coming, and the current running candle shows a clear-sell side liquidity sweep on the 1-month chart. Also, the weekly candle validated the buying pressure, which formed a U-shape recovery with a bullish reversal possibility.
Coming to the daily chart- the bearish exhaustion at the 14.71 swing low came with a 100% recovery from the 17.19 supply level, which is a strong sign of a bullish reversal. The immediate bullish recovery with a high swing formation above the 18.17 level signalled the primary indication of the bullish pressure. However, a sufficient downside correction is pending after the bullish break of structure, which may signal sellers’ presence in the intraday chart.
At the main chart window, the 100-day Simple Moving Average level is working as an immediate resistance from where a bearish D1 candle appeared. Moreover, the current Fixed Range Volume profile shows that bulls must overcome the 20.58 level before forming a stable bullish trend.
The indicator window shows the buying pressure as valid, where the current 14-period RSI is above the 50.00 line.
Based on the daily price outlook of ETC/USDT, the broader market outlook is the potential to form a bullish trend, but a strong breakout above the 20.60 level is needed before aiming for a conservative bullish approach.
As the current price shows a bearish rejection from the 100 SMA and high volume level, we may expect the bearish correction to extend towards the 16.60 support level.
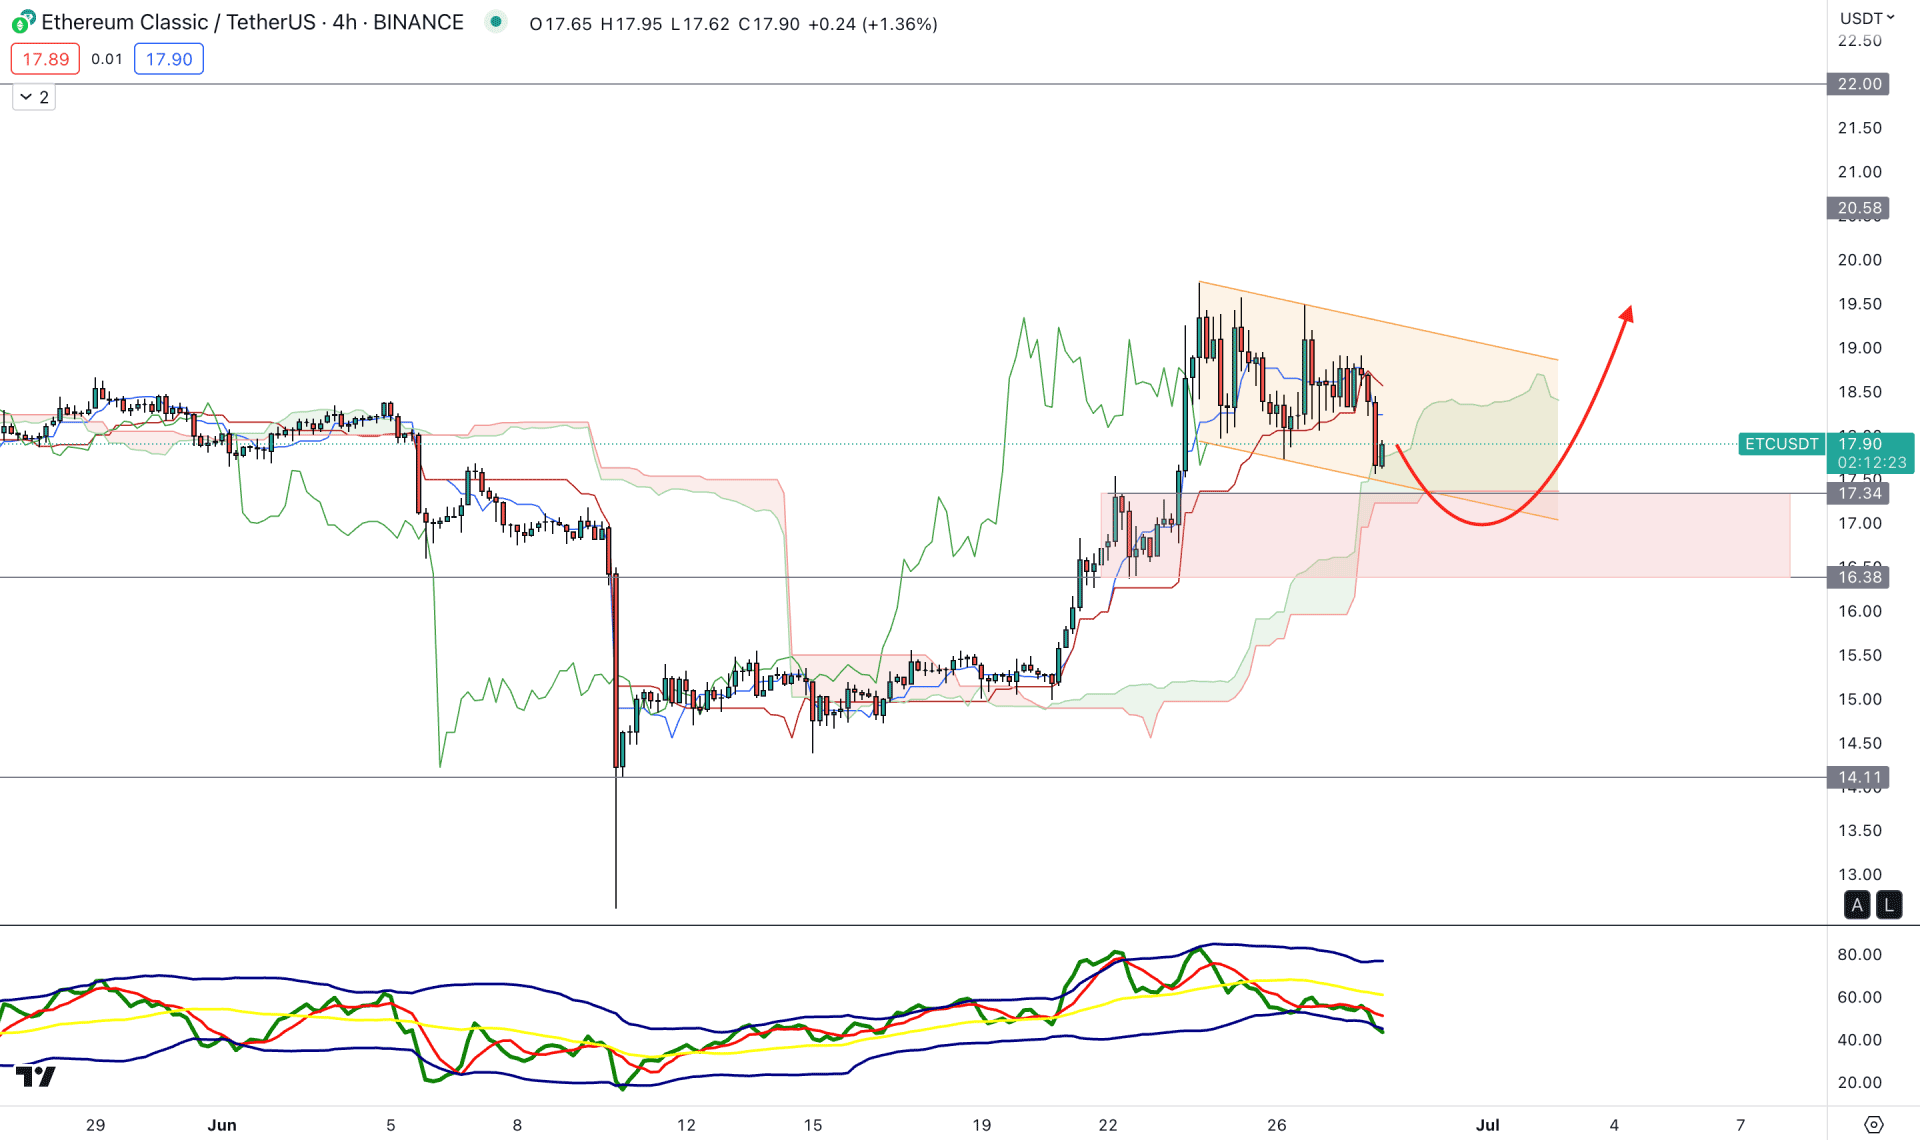
In the H4 chart, the current market trend is strongly bullish as a stable momentum is visible above the Ichimoku Cloud support level. Moreover, the price went sideways after the breakout and started to stall within a descending channel. It is a sign that no significant selling pressure is seen after the breakout, which may create a new impulsive bullish leg.
In the future cloud, the thickness supports bulls while the Senkou Span A is above B. However, a minor downward pressure is visible from the dynamic Kijun Sen support, which may lower the price at the near-term demand zone before forming a buy signal.
Based on the current Ichimoku Cloud analysis, any bullish rejection from the 17.50 to 16.30 zone could offer a long opportunity, targeting the 22.00 level.
The alternative approach is to look for sell signals after finding the H4 candle below the 16.00 psychological level.
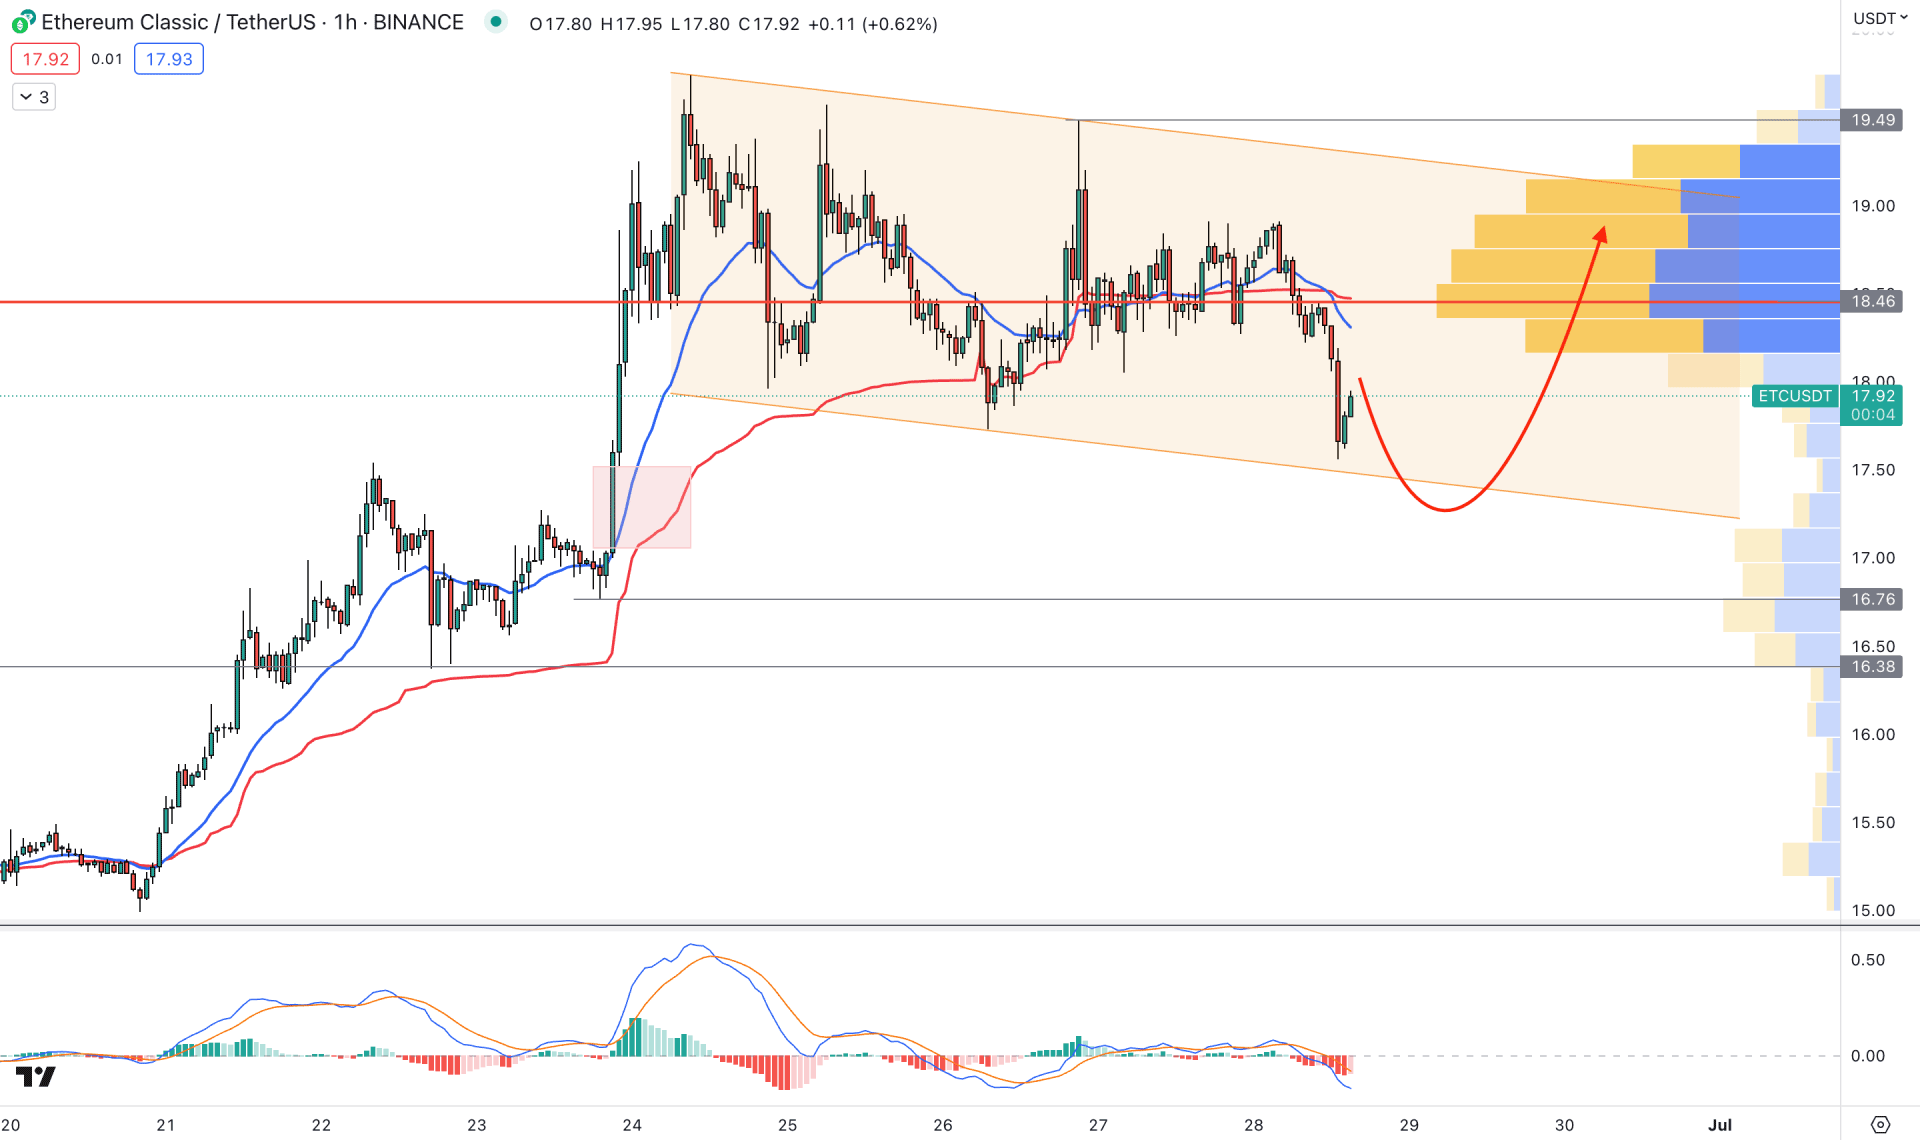
In the hourly chart, the current buying pressure left some areas untested, which increased the possibility of testing the 17.50 to 17.00 imbalance area. Moreover, the visible range high volume level is above the price, which signals intraday selling pressure in this instrument.
Based on this outlook, we may expect the selling pressure to extend, as shown in the price and MACD indicator. However, a bullish recovery from the existing imbalance area with an H1 candle above the 20 EMA could be a bullish signal.
On the other hand, breaking below the 16.30 low could eliminate the buying possibility, which may lower the price towards the 15.00 area.
Based on the current multi-timeframe outlook, ETC/USDT could offer a strong bullish signal if bulls can overcome the 20.00 line. As of the current findings, the bearish correction is activated, and an early buying opportunity is present from any intraday support level.


