Published: November 24th, 2022
Microeconomic factors are the primary reason for the remarkable crypto price shifting, and there is no exception for the Ethereum Classic (ETC).
The significant adoption of the parent blockchain also supported the project as it builds from the ETH blockchain. However, ETH itself is currently under bearish pressure and the POS mitigation doesn’t put a significant impact on the price, since it has been declining.
On the other hand, Ethereum Classic currently has no plan to switch to POS and still can be mined. Miners profit motivation supported its cause and even in 2020 market of downward continuation.
Nayib Bukele, the El Salvador president's announcement of buying 1BTC everyday also helped the market to rise.
Can Ethereum Classic initiate a bull run? Let’s see the future price of Ethereum Classic (ETC) from the ETC/USDT technical analysis:

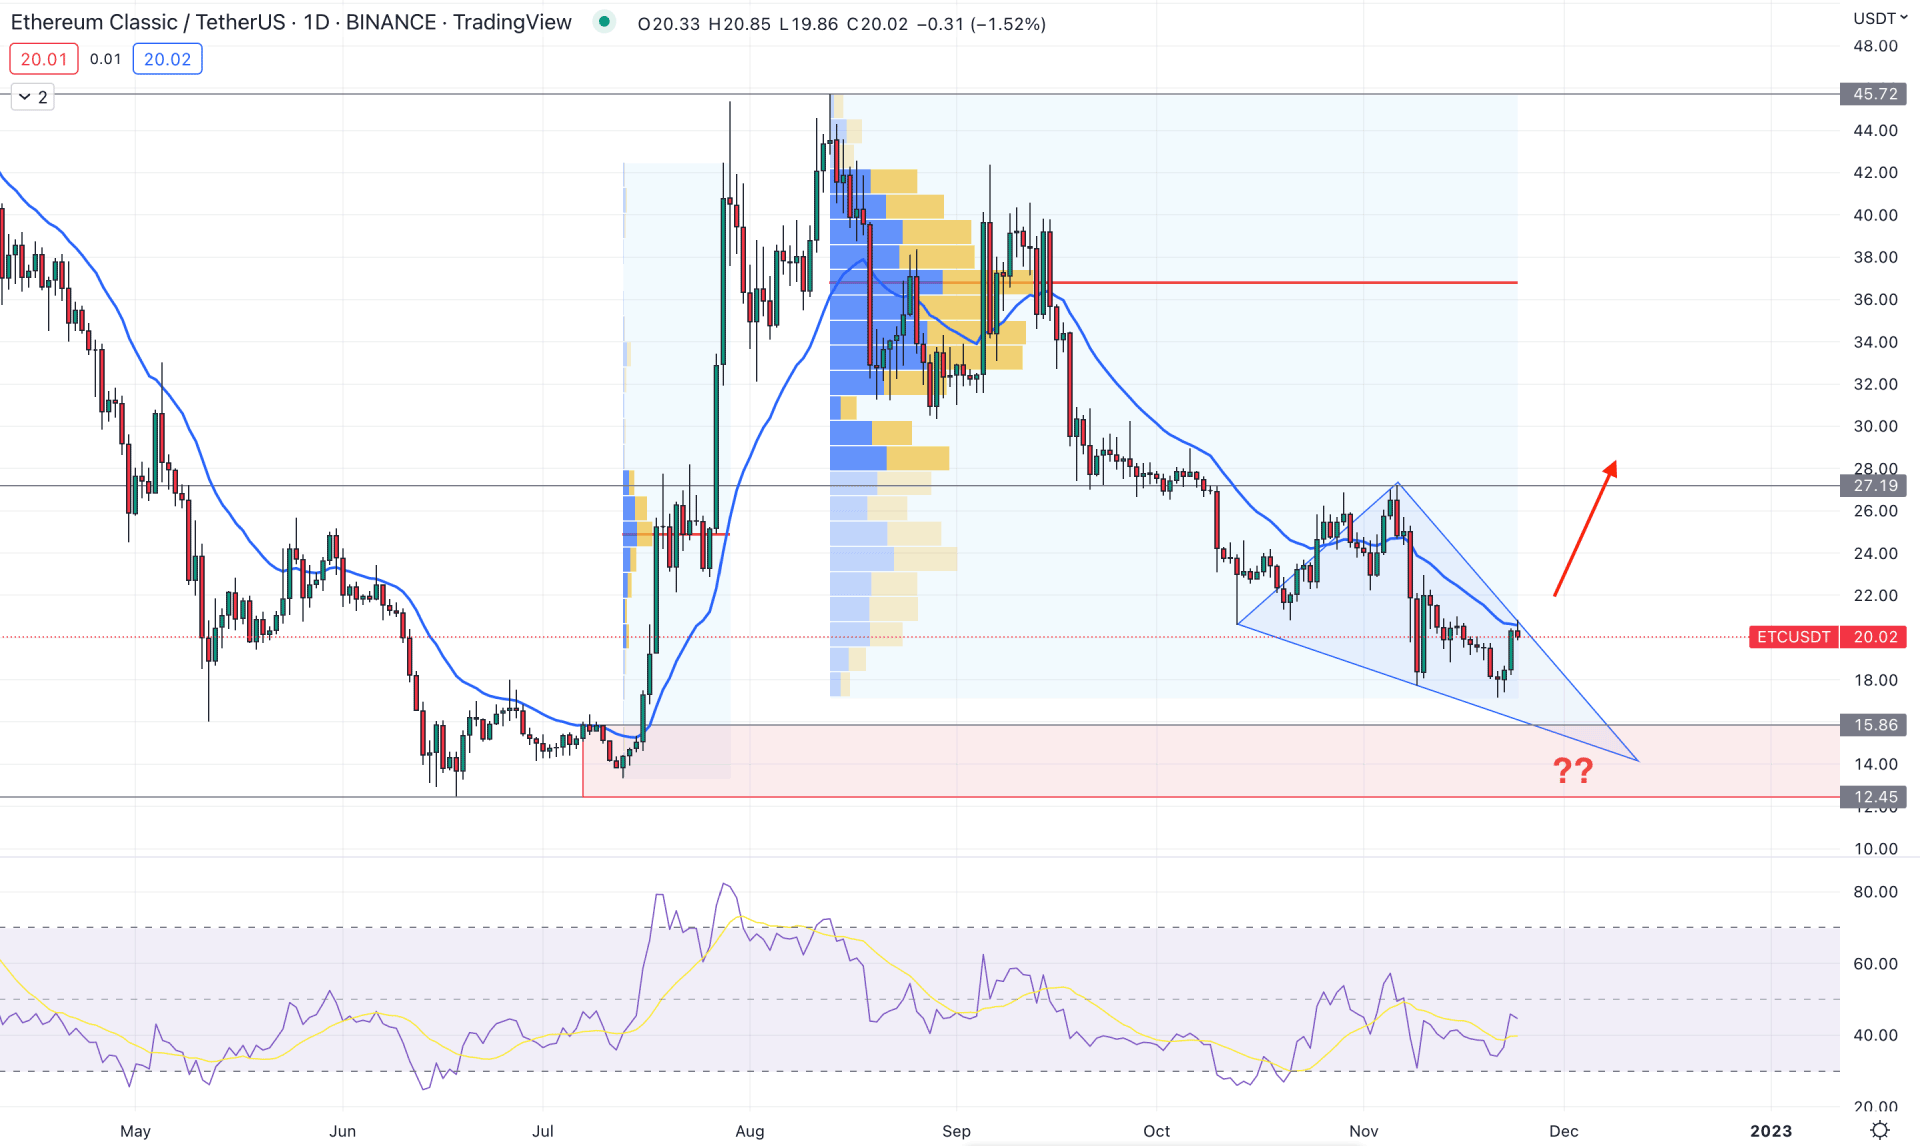
In the daily price of ETC/USDT, the current trading range is limited from the 45.72 high to the 12.45 low. As the current price is trading below the 50% retracement level of this zone, we can rely on any bullish opportunity with a discounted price.
The current price is trading within a correction of the July 2022 bull run, where the buying pressure is solid as the price trades above the 15.86 to 12.46 demand zone. Moreover, the bearish correction is solid as the price trades within a symmetrical triangle formation, from where a bullish breakout could offer a decent long opportunity.
On the other hand, the fixed range high volume level shows a different story, where the July 2022 bull run did not come with a higher volume. Therefore, it is a sign that institutional traders were not backing that buying pressure, which could be an alarming sign to bulls. Moreover, from the August 2022 high to November 2022 low, there is no new high volume level below the price.
The dynamic 20-day EMA is working as immediate resistance to the price, while the RSI shifted its direction to the neutral zone.
Based on the current daily structure of ETC/USDT, there is no sign of buyers’ activity in the price. Therefore, traders need a strong high volume level below the price with a daily candle above the symmetrical triangle resistance. In that case, the primary aim would be to test the 27.19 resistance level.
On the other hand, any strong bearish rejection from the dynamic 20-day EMA would offer a short opportunity, where the main aim is to test the 15.86 support level.

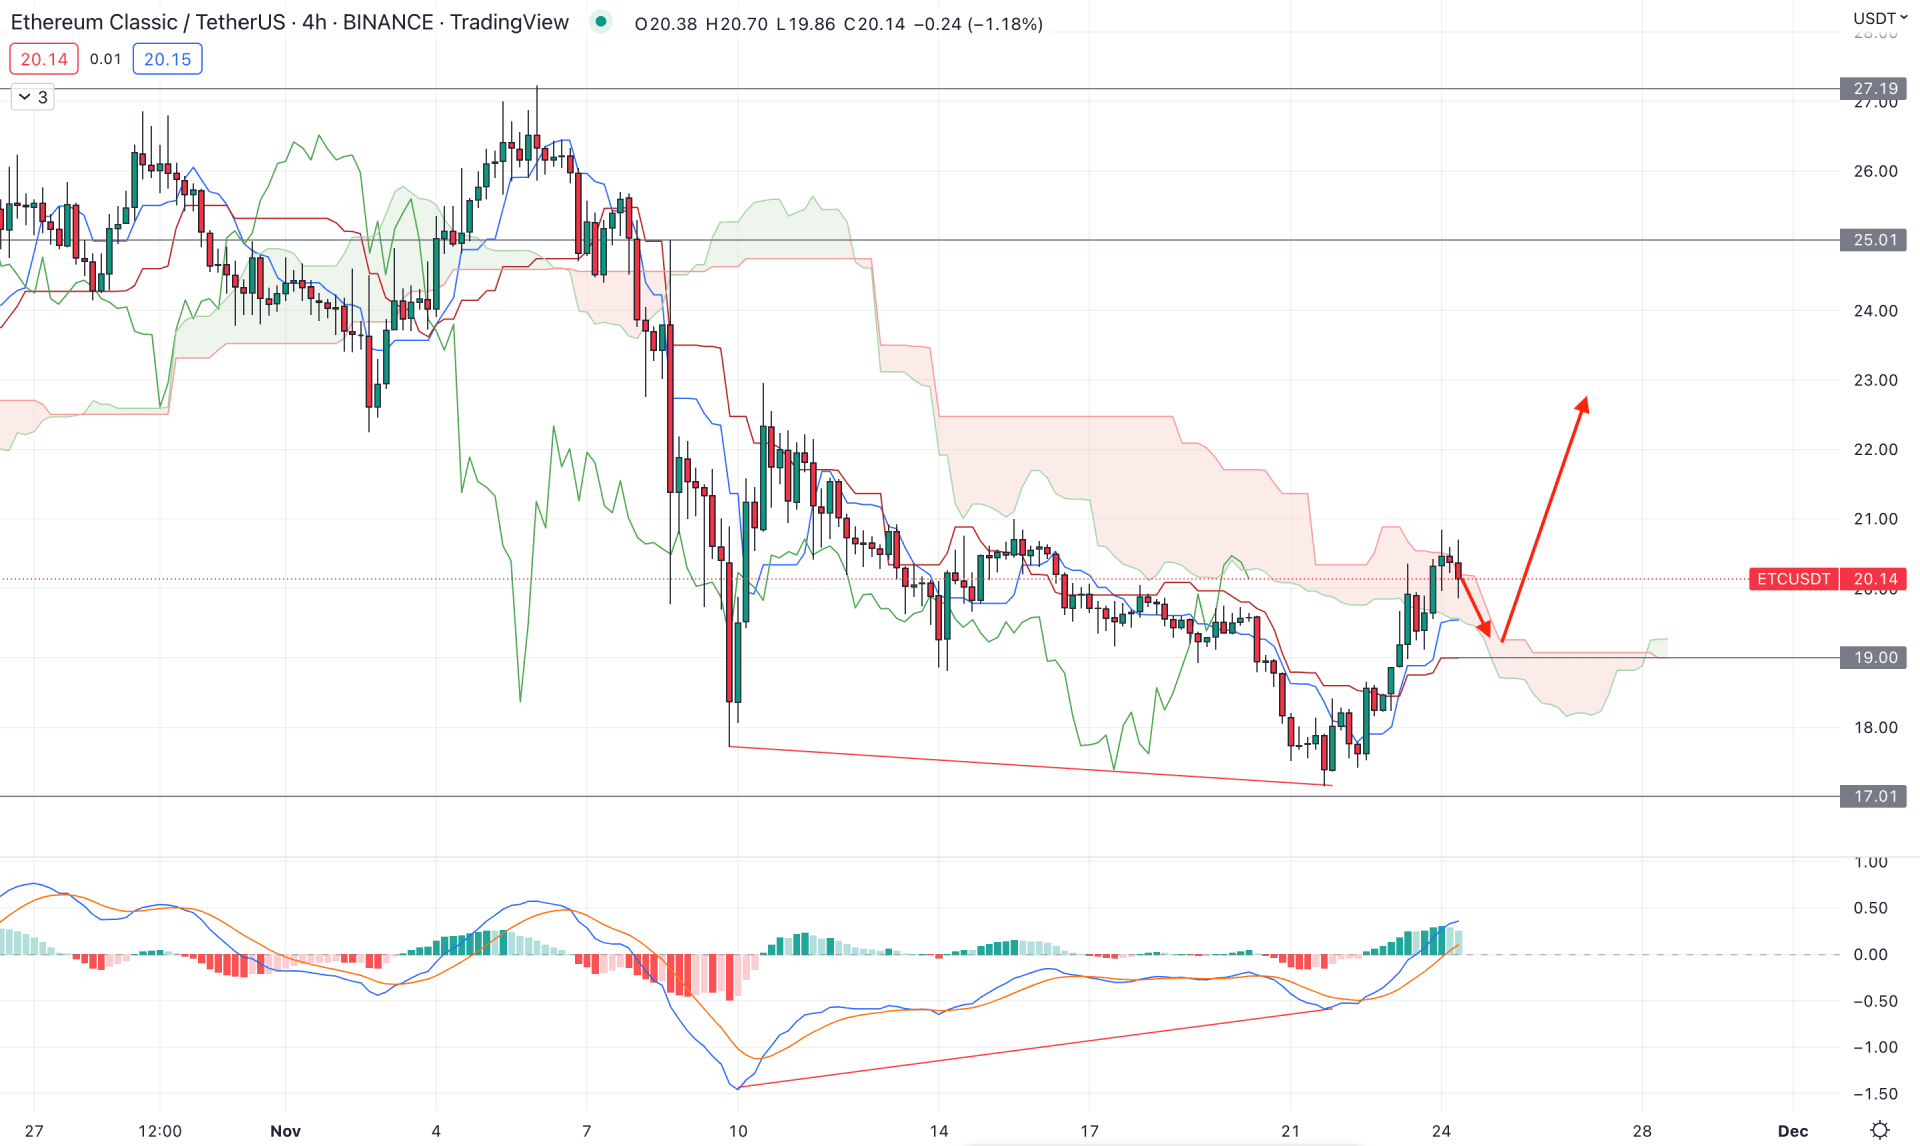
In the H4 timeframe, the broader outlook for the ETC price is critical for sellers as bulls formed a breakout above the Kumo Cloud, backed by a MACD Divergence.
However, the buying pressure above the Kumo Cloud is not solid as multiple indecision candles are formed there, which is not a healthy breakout sign. In the future cloud, the Senkou Span A changed its position above the Senkou Span B, while the Lagging Span is above the price.
In the indicator window, divergence is clearly visible while the MACD Histogram is above the neutral line. The dynamic Tenkan Sen is below the price and working at support levels.
Based on the current H4 outlook, the bearish possibility is valid if there is a breakdown below the dynamic Kijun Sen level with an H4 close.
On the other hand, any bullish recovery from the dynamic support with a new higher high above the Kumo Cloud would be a sign of buyers' presence in the market. In that case, the bullish possibility will be valid towards the 25.00 resistance level.

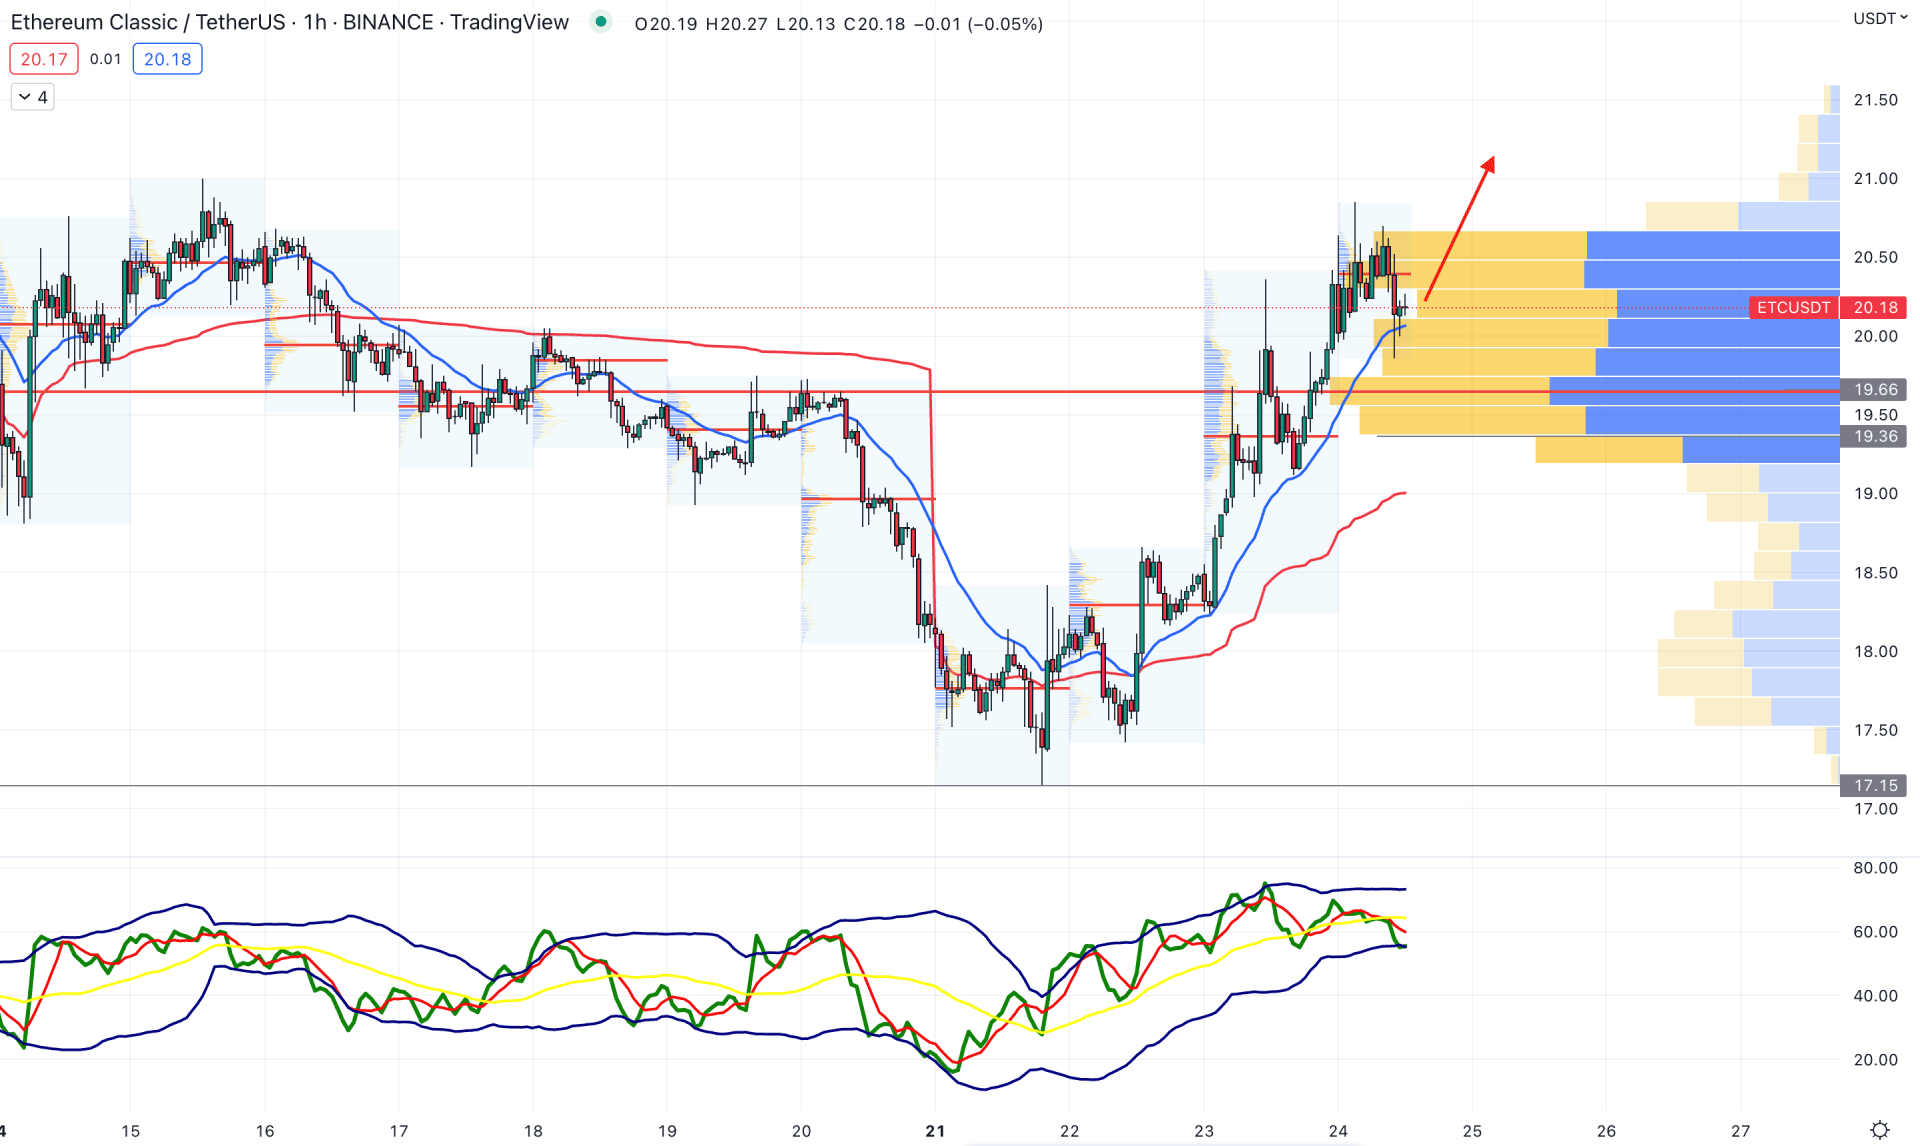
In the hourly chart, the broader outlook of the ETC price is bullish as it trades above the visible range high volume level of 19.66.
The dynamic 20 EMA is below the price, working as an immediate support level. Moreover, the weekly VWAP is also below the current price, which is a sign of active buying pressure in the market.
The Traders Dynamic Index shows a different story, where the current TDI line is at a discounted zone although the main chart shows buying pressure.
Based on the H1 outlook, the buying possibility in this pair is valid but any bearish recovery with a H1 candle close below the 19.36 level could be an alarming sign to bulls. In that case, bears may join the market, targeting the 17.15 support level.
Based on the current multi-timeframe outlook, the bullish possibility in this pair is valid once there is a strong breakout in the daily timeframe. Otherwise, the upside pressure in the intraday chart could be a minor correction to the broader bearish trend.