
Published: May 13th, 2021
Ethereum Classic (ETC) is the sibling of Ether, the native cryptocurrency of the Ethereum blockchain. According to some prominent crypto enthusiasts, investors may see steady demand in ETC from the third quarter of 2021. Until then, the price may remain corrective or recover from the recent upside pressure that almost doubled the price.
During the past week, the ETC price doubled while Bitcoin and other altcoin remained lagged. However, the price showed a nasty crash on Wednesday’s trading session and moved below the $100 level with a daily close at $84.19. The bearish daily close was very impulsive that may influence traders to consider that the ETC will continue moving down in the coming trading sessions. Let’s see the price direction from the Ethereum Classic technical analysis:
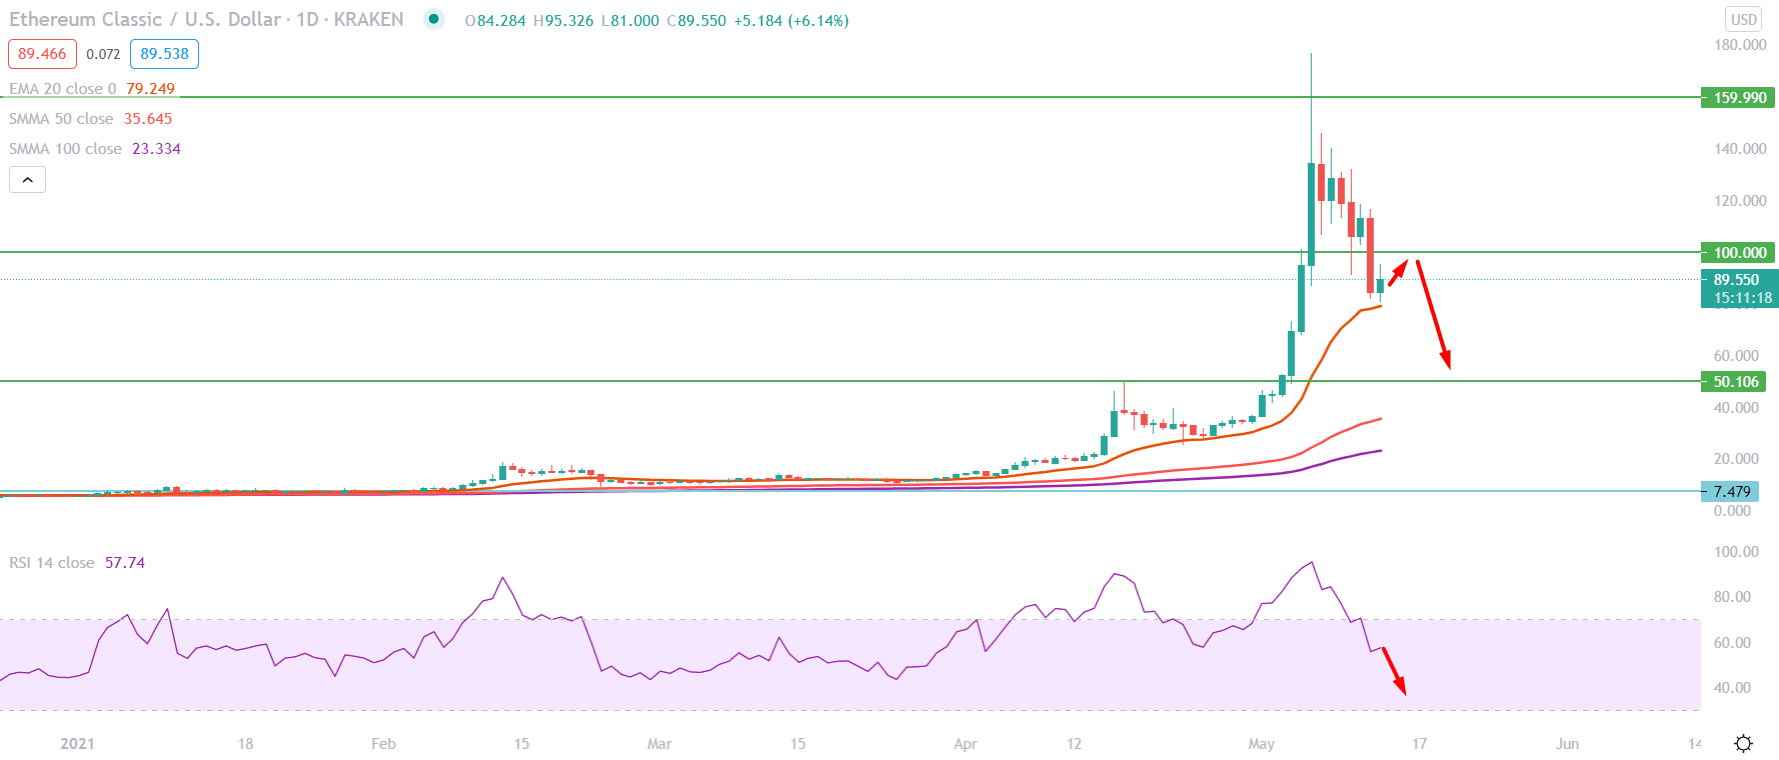
Ethereum Classic moved up since the beginning of 2021. Moreover, the pressure was boosted as soon as the price moved above the $50.00 level with a bullish daily close. As a result, the price moved aggressively higher and tested the all-time high at $176.91 level. However, the recent crash from the Wednesday trading session makes the bullish possibility questionable.
In the above image, we can see the daily chart of the Ethereum Classic, where the price made a daily close below the $100 psychological support level. Moreover, the recent bearish trend from the all-time high came with a solid lower low with an impulsive pressure that created the further possibility of moving down.
Based on the present condition, the price is getting minor support from the dynamic 20 EMA that may intervene in the most immediate bearish pressure. Therefore, the price may correct higher, but the outlook would remain bearish as long as it is trading below the $100 level.
Below the dynamic 20 EMA, the support is at $50.00, a significant event level. However, if the price moves up and manages to have a daily close above the $112.00 level, the current bearish pressure may become obsolete.
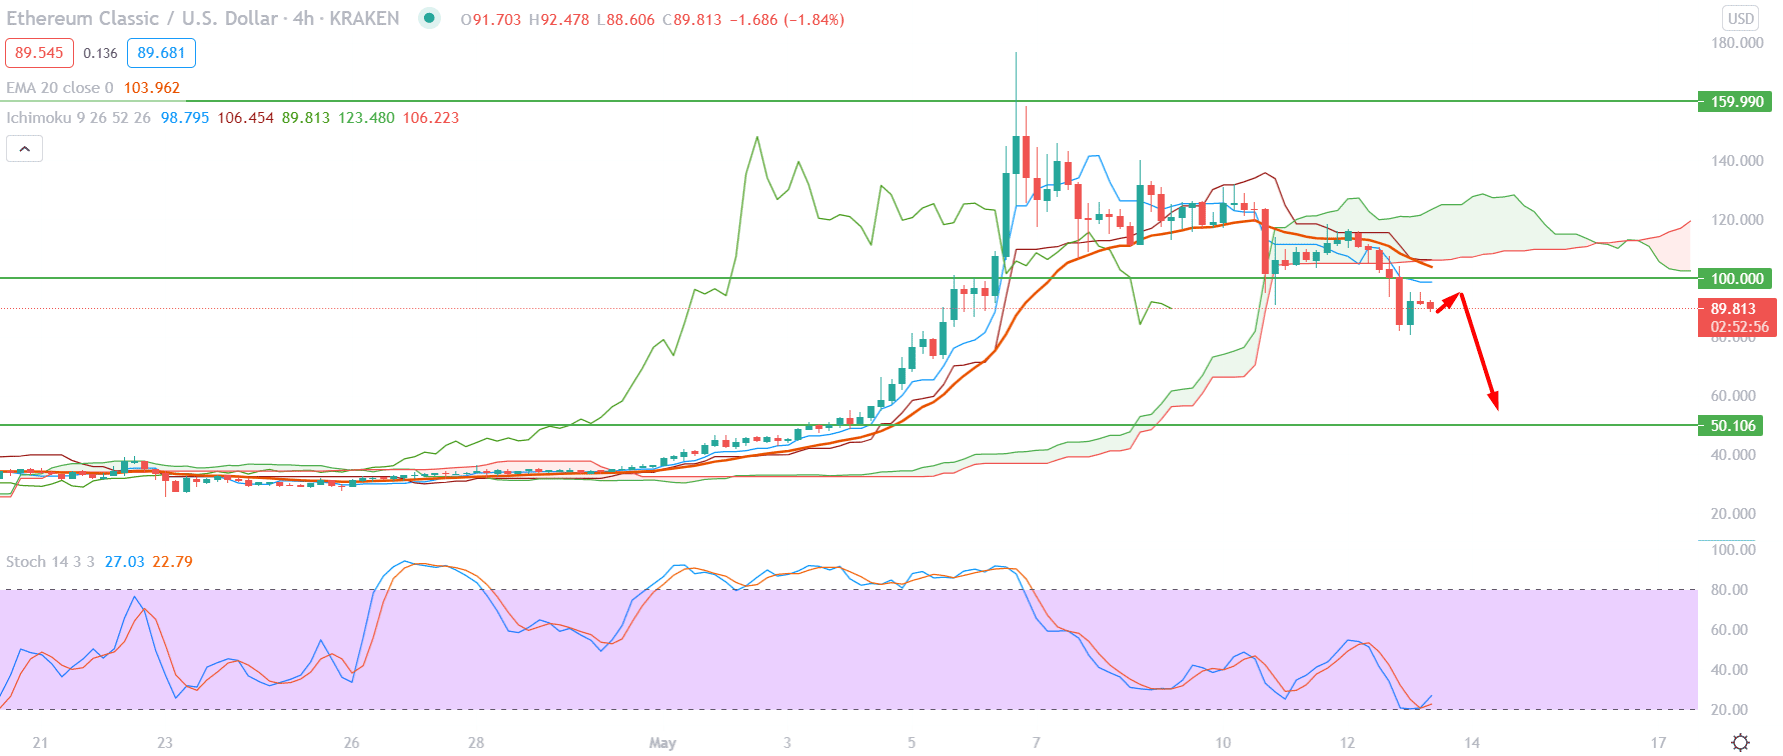
If we plot the Ichimoku Kinko Hyo on the H4 chart, we would see that the price moved below the Kumo Cloud with an impulsive bearish pressure. Moreover, in the future cloud, Senkou Span A is below the Senkou Span B. Therefore, as long as the price is trading below the Kumo cloud, the current outlook is bearish.
In the above image, we can see that the Tenkan Sen and Kijun Sen are above the price and sloping down, which is a major indication of possible bearish pressure. Moreover, the Chikou Span is below the price, and moving down that may increase the bearish possibility in the price.
On the other hand, the Stochastic reached the oversold 20 levels and moved up, indicating a possible correction in the price. Therefore, investors may see a correction in the price towards the $100 level before making a new low below the $80.00 level.
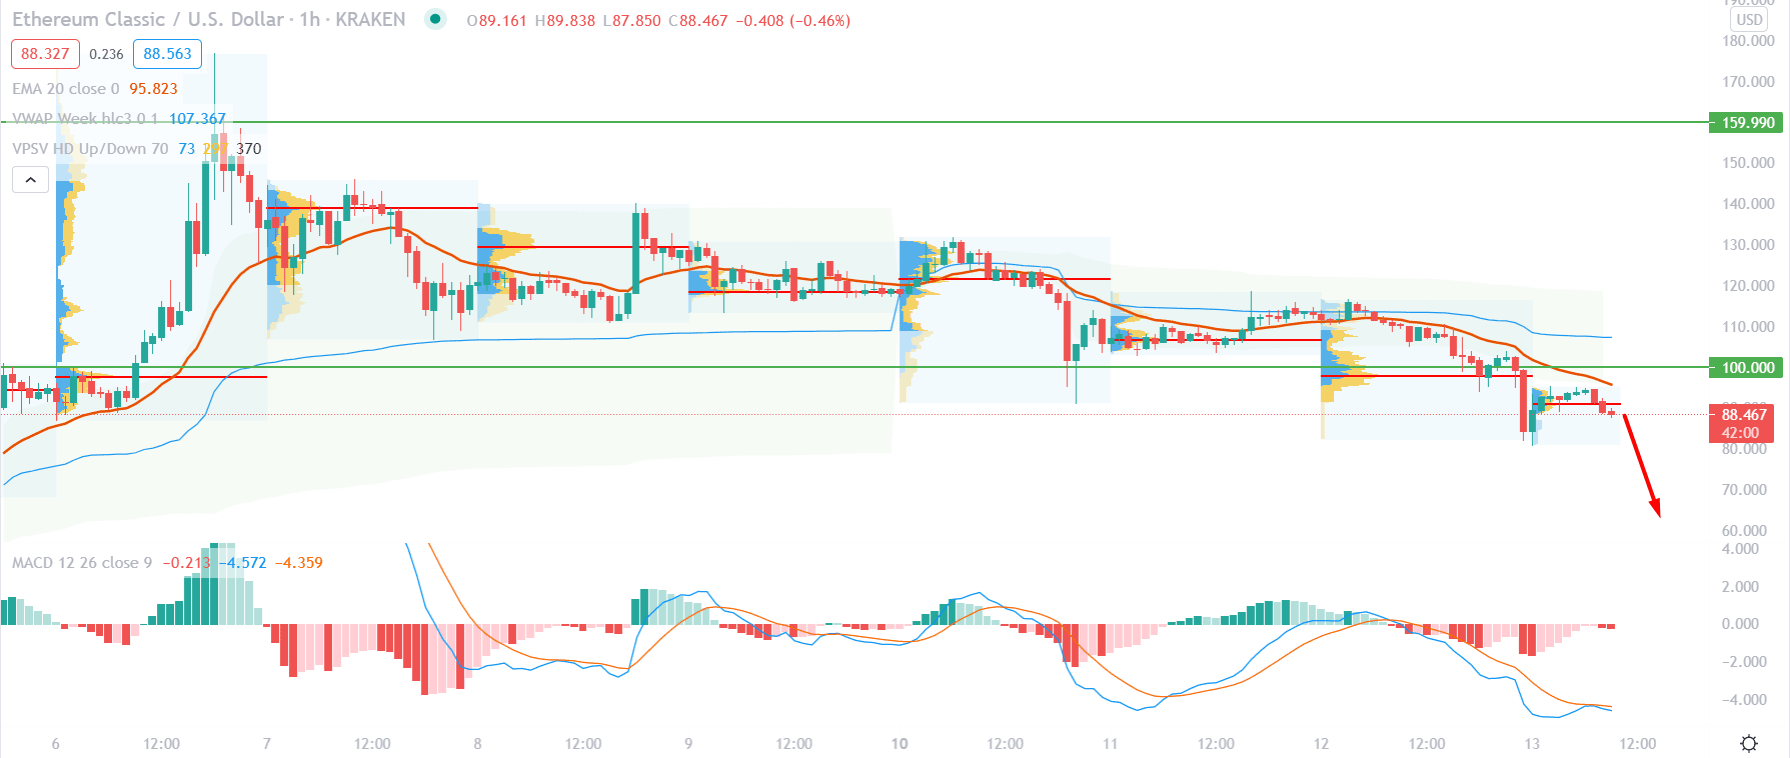
Based on the intraday chart of Ethereum Classic, the intraday high volume level made multiple lower lows, pointing out sellers’ presence in the price. Moreover, the price is trading below the most recent high volume level at $91.22. As a result, it may face more intraday selling pressure in the coming hours.
In the above image, we can see that the price is moving lower by creating lower lows where the dynamic 20 EMA and weekly vwap worked as resistance to the price. Moreover, the dynamic 20 EMA is sloping down and carrying the price below the intraday high volume level.
On the other hand, the MACD is bearish, and the Histogram is becoming bearish from the neutral level. If the MACD Histogram closes down with a new low, it may create more bearishness to the price.
The primary target for the current bearish pressure is $80.20, which is the most recent support, and below this level, $72.00 is another important level.
Despite the bearish possibility, the $100 level will work as a major price driver, where any bullish H4 close above the $100 will see a shift of the current trend from bearish to bullish.
As of the above discussion, we can say that the Ethereum Classic (ETC) has a higher possibility to continue the bearish pressure towards the $50.00 level.
On the other hand, any strong bullish daily close above the $112.00 level may alter the current market structure. In that case, the price may move higher towards the $138.20 level.


