
Published: September 24th, 2025
One notable decentralized staking mechanism for personal ETH staking and key self-custody is Ether.fi (ETHFI). By implementing an unsupervised, delegated staking method, this platform aims to transform the Ethereum staking process.
The platform enables individuals to sign up as a node controller without requiring a significant amount of capital. It is unique that stakers can still take advantage of expert node operation services while keeping complete control of their validator keys.
Ether.fi has partnered with several decentralized finance (DeFi) protocols. Through their automated vault, Liquid, customers can participate in lending, borrowing, yield farming, and other DeFi methods thanks to this partnership. Ether.fi enhances the ecosystem's utility by integrating DeFi with real-world spending.
Let's see the future price direction of this token from ETHFI/USDT:
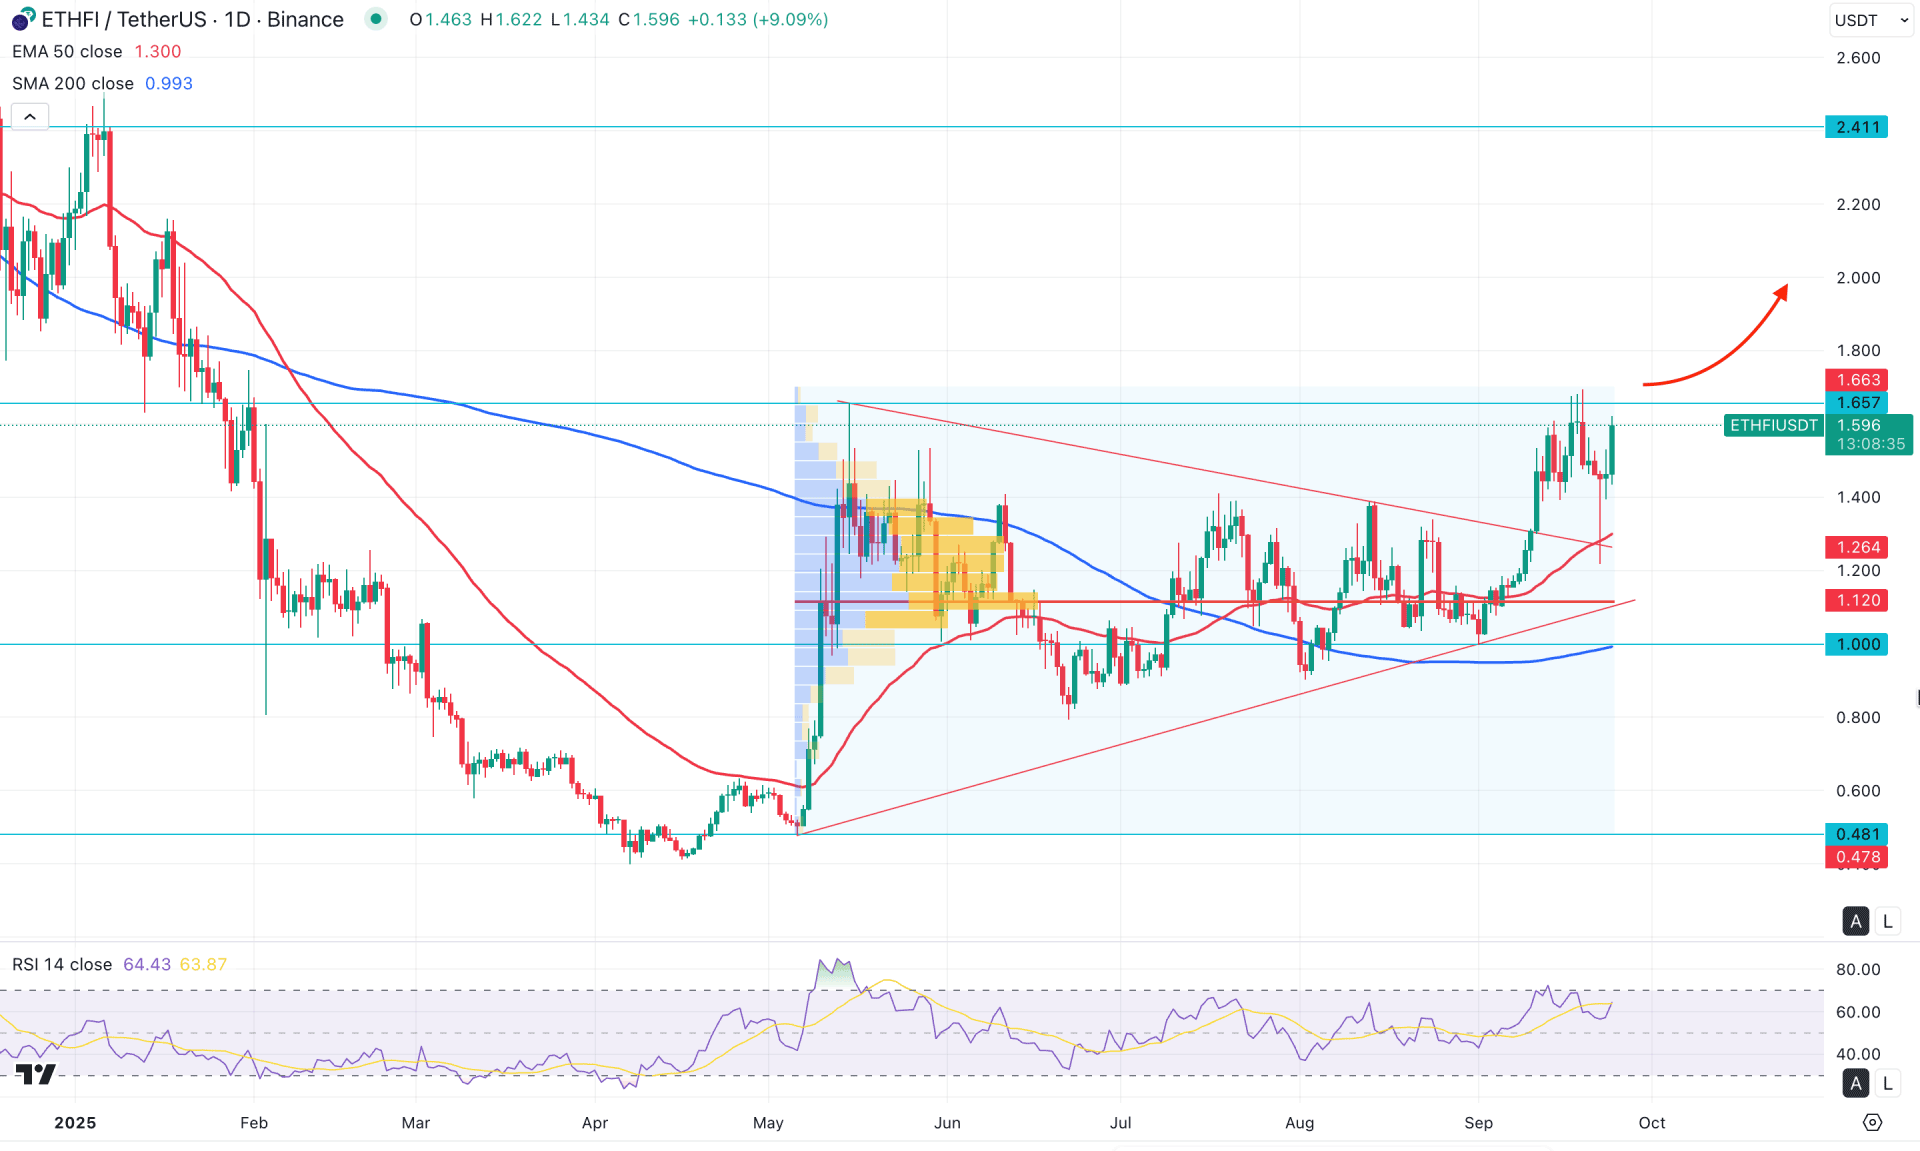
In the daily chart of ETHFI/USDT, a potential bullish breakout appears feasible as the current price is moving higher from a valid retest. Since the downside correction is complete, investors should closely monitor how the price reacts around the near-term resistance area.
In the higher timeframe, the potential bullish breakout is also visible, with the current monthly candle is trading bullish after three consecutive indecisive candles. The primary objective from the monthly perspective is to anticipate a bullish continuation within a rally-base-rally formation. Despite the bullish outlook, the price is still trading at a discounted zone if we consider the current all-time high and low levels.
In terms of volume, the price shows a positive bias, with the largest activity level since May 2025 seen near the 1.1140 level. A potential bullish reversal is visible, as the high-volume line remains below the current price, signalling a decent bullish continuation possibility.
On the daily chart, the immediate support is located at the 50-day Exponential Moving Average, which has already been retested following the triangle breakout. Moreover, the 200-day Simple Moving Average is acting as major support, aligning with the 50-day EMA. As long as the current price hovers above these dynamic support levels, the primary bias for this pair remains bullish, and traders should look for long opportunities.
In the secondary indicator window, the Relative Strength Index (RSI) is holding steadily above the 50.00 neutral mark, with the current line aiming higher toward the 70.00 overbought level. As long as the RSI remains above 50.00, the bullish continuation scenario remains valid.
Based on the overall market structure, ETHFI/USDT is likely to extend its buying pressure and face resistance around the 2.411 level. However, the immediate resistance level to watch is around 1.657, where multiple selling attempts are possible. A successful breakout above this level, followed by consolidation, could pave the way for a move toward the 2.600 psychological level.
On the bearish side, corrective price action might extend if the price fails to surpass the 1.657 resistance. However, this would not be sufficient to trigger a strong short opportunity as long as the key support — the 50-day EMA — remains below the current price. After a corrective bearish phase, investors might look for another long opportunity near the 1.2000–1.000 zone, depending on the price action.
However, a false breakout above the 1.657 level, followed by an immediate sharp sell-off below the 50-day EMA, could serve as an early warning for bulls. In that scenario, a pump-and-dump pattern would be more evident, with the ultimate downside target likely to test the 0.481 support level.
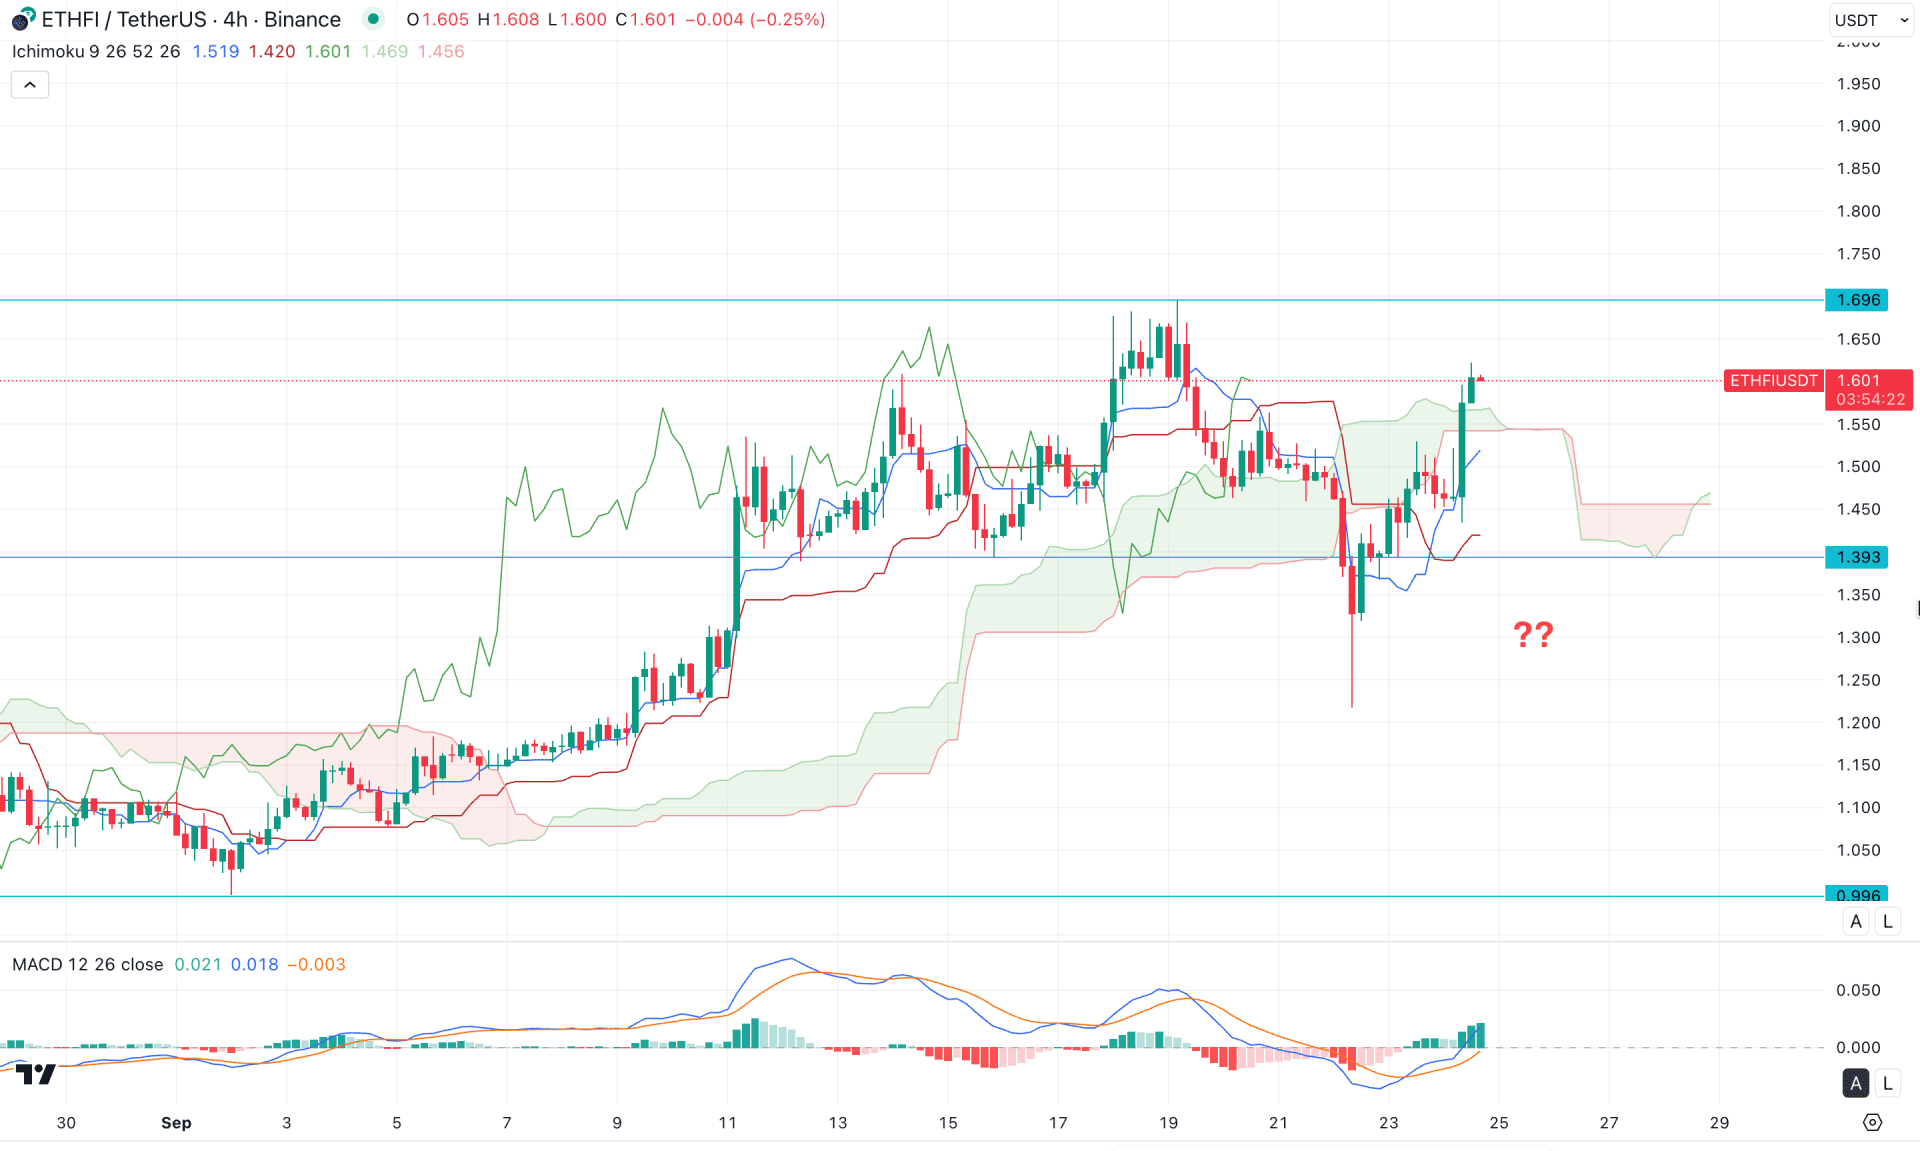
In the four-hour timeframe, the recent price action shows a bearish exhaustion below the Kumo cloud area before forming a valid bullish reversal. As the most recent H4 candle has closed above the cloud, a consolidation above the near-term support level could provide a trend continuation opportunity.
In the future cloud, the Senkou Span A and B lines have flipped, with Span A now above Span B. Moreover, a bullish crossover is visible within the dynamic lines, where the Tenkan-sen is acting as immediate support.
In the secondary indicator window, a solid bottom has formed, while the MACD signal line has flipped upward with a bullish crossover. As a result, the histogram continues to push higher, with multiple vertical bars above the neutral line.
Based on the H4 market structure, a bullish continuation is likely, with immediate support seen at the 1.696 level. As long as the price trades above the dynamic cloud area, the upside target remains valid toward the 1.950 level.
On the bearish side, a failure to hold above the dynamic support level could be an alarming sign for bulls. In that case, an extended bearish correction below 1.393 would be required before anticipating further downside momentum toward the 1.000 psychological level.
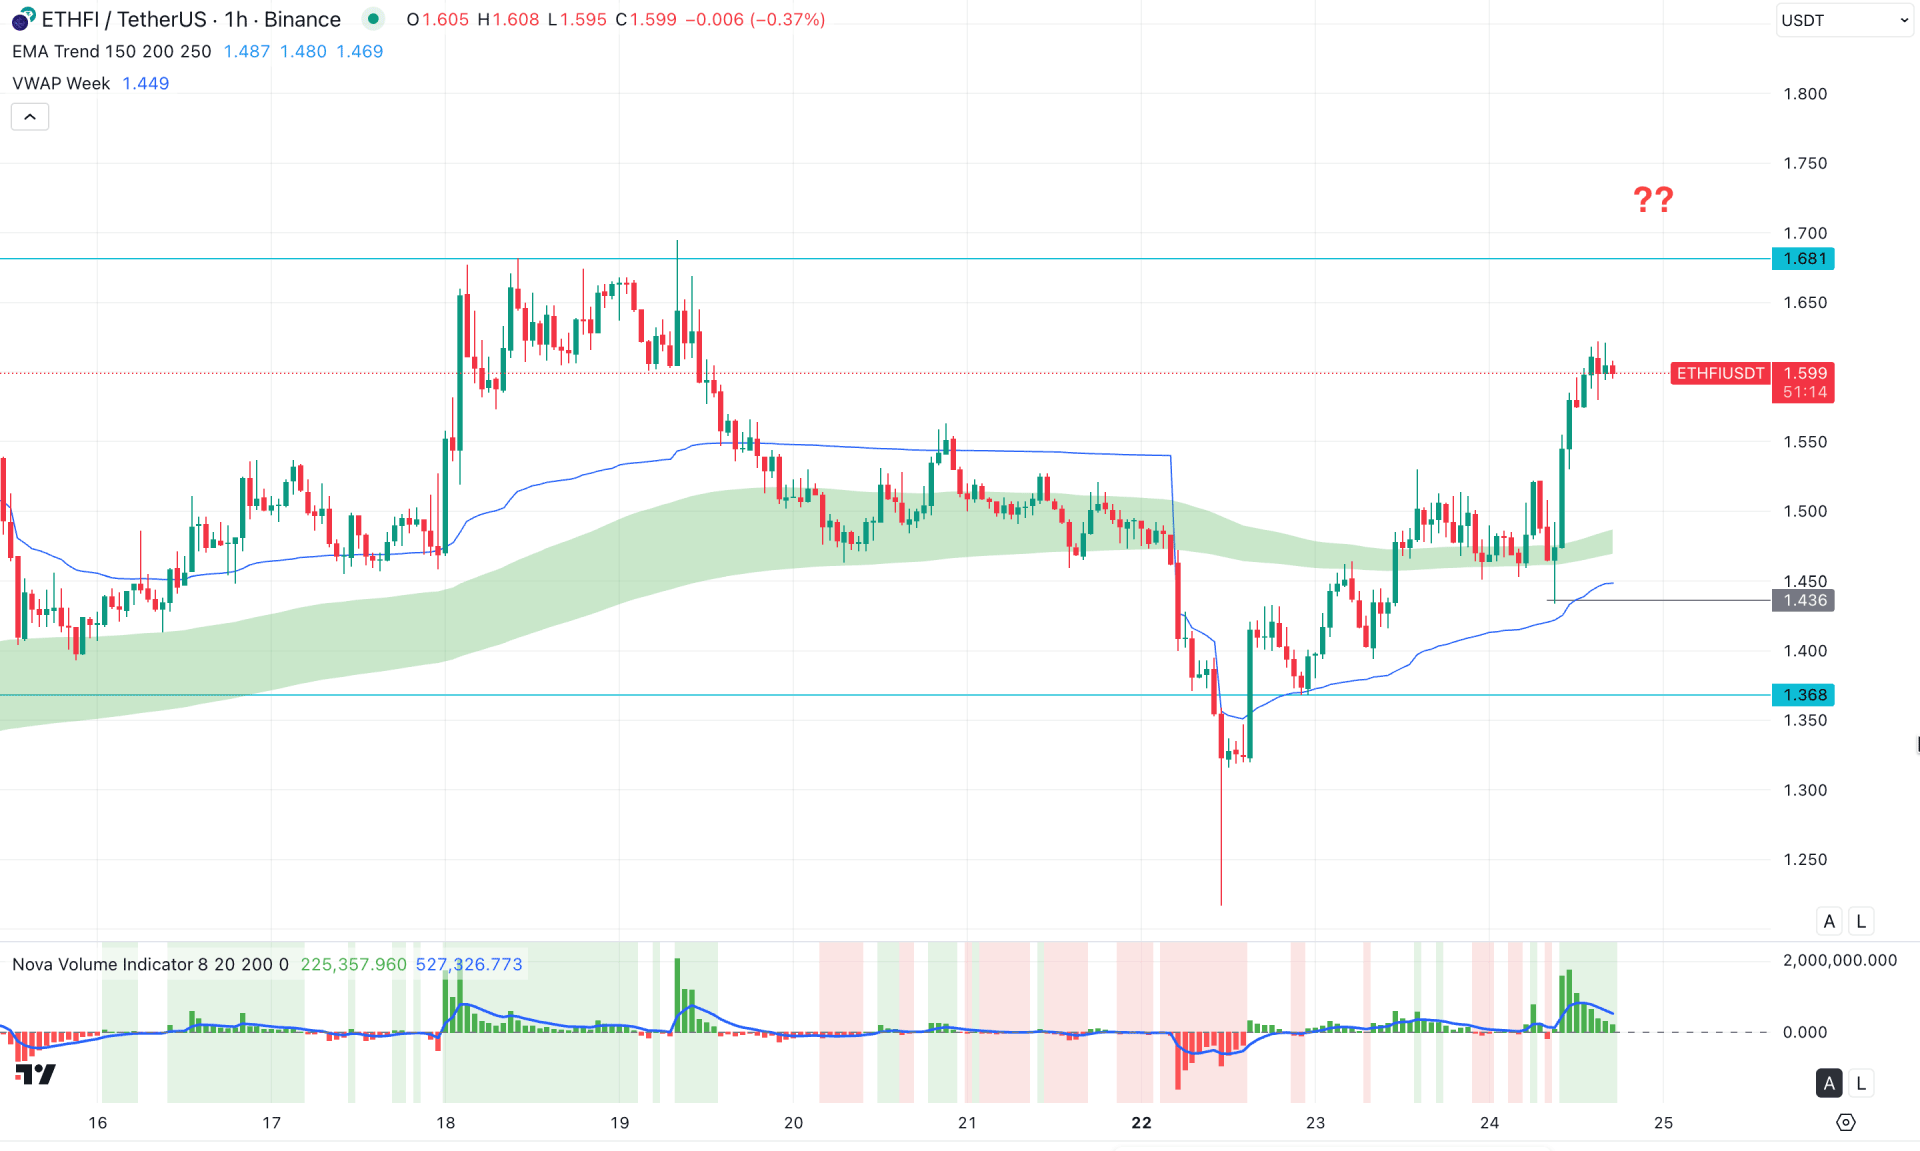
In the hourly timeframe, a bullish continuation is visible as the current price is trading at the highest level in a week. As a result, the gap between the price and the Exponential Moving Average (EMA) wave has widened, creating the possibility of a downside mean reversion. Moreover, the weekly VWAP level is holding solidly below the current price, establishing a strong base near the 1.500 psychological level.
In the indicator window, volume is decreasing as the price reaches its peak. In this case, a downside correction toward the EMA wave area is possible. Since the overall market momentum remains bullish, another bullish reversal from the 1.500 to 1.368 zone could provide a fresh long opportunity from a discounted price.
On the other hand, extended selling pressure below the weekly VWAP line, with consolidation under the 1.400 level, might extend the correction toward the 1.250 area.
Based on the overall market structure, ETHFI/USDT is trading within a valid bullish momentum, supported by a symmetrical triangle breakout on the daily timeframe. As the current intraday price is trading in the premium zone, investors should monitor how it reacts at the near-term resistance area.
A corrective pullback toward the H4 support level, followed by a bullish reversal, could present a long opportunity in line with the major market trend.


