
Published: June 4th, 2024
Ethena (ENA) aims to mint, redeem, and stake the USDe stablecoin, which has experienced a substantial increase in value since its launch.
A significant increase in trading volume to $563 million indicated bullish sentiment. Analysts anticipate that Ethena (ENA) will surmount its all-time high of $1.52 as market optimism and increasing investor interest propel the price.
USDe, a stablecoin developed by Ethena Labs that is occasionally called a "synthetic dollar," has amassed a $3 billion supply in less than four months since its initial public offering. The stablecoin has experienced substantial growth since its inception in February.
The stablecoin's ascent can be ascribed to its distinctive arbitrage mechanisms and profitable cash-and-carry transactions. Presently, it competes with DAI for the preeminent algorithmic or decentralized stablecoin title.
Currently, USDe occupies the fourth position in the stablecoin market, commanding a 3.3% market share. To surpass DAI and its rivals, USDe must sustain its expansion and add functionalities to appeal to a broader spectrum of users.
Ethena Labs aims to create a dependable synthetic dollar, an artificial currency, that can be utilized across various DeFi platforms. The rapid assimilation of this currency signifies robust industry demand. USDe may eventually contend with established stablecoins like DAI and Tether as it expands.
Let's see the further aspect of this crypto from the ENA/USDT technical analysis:
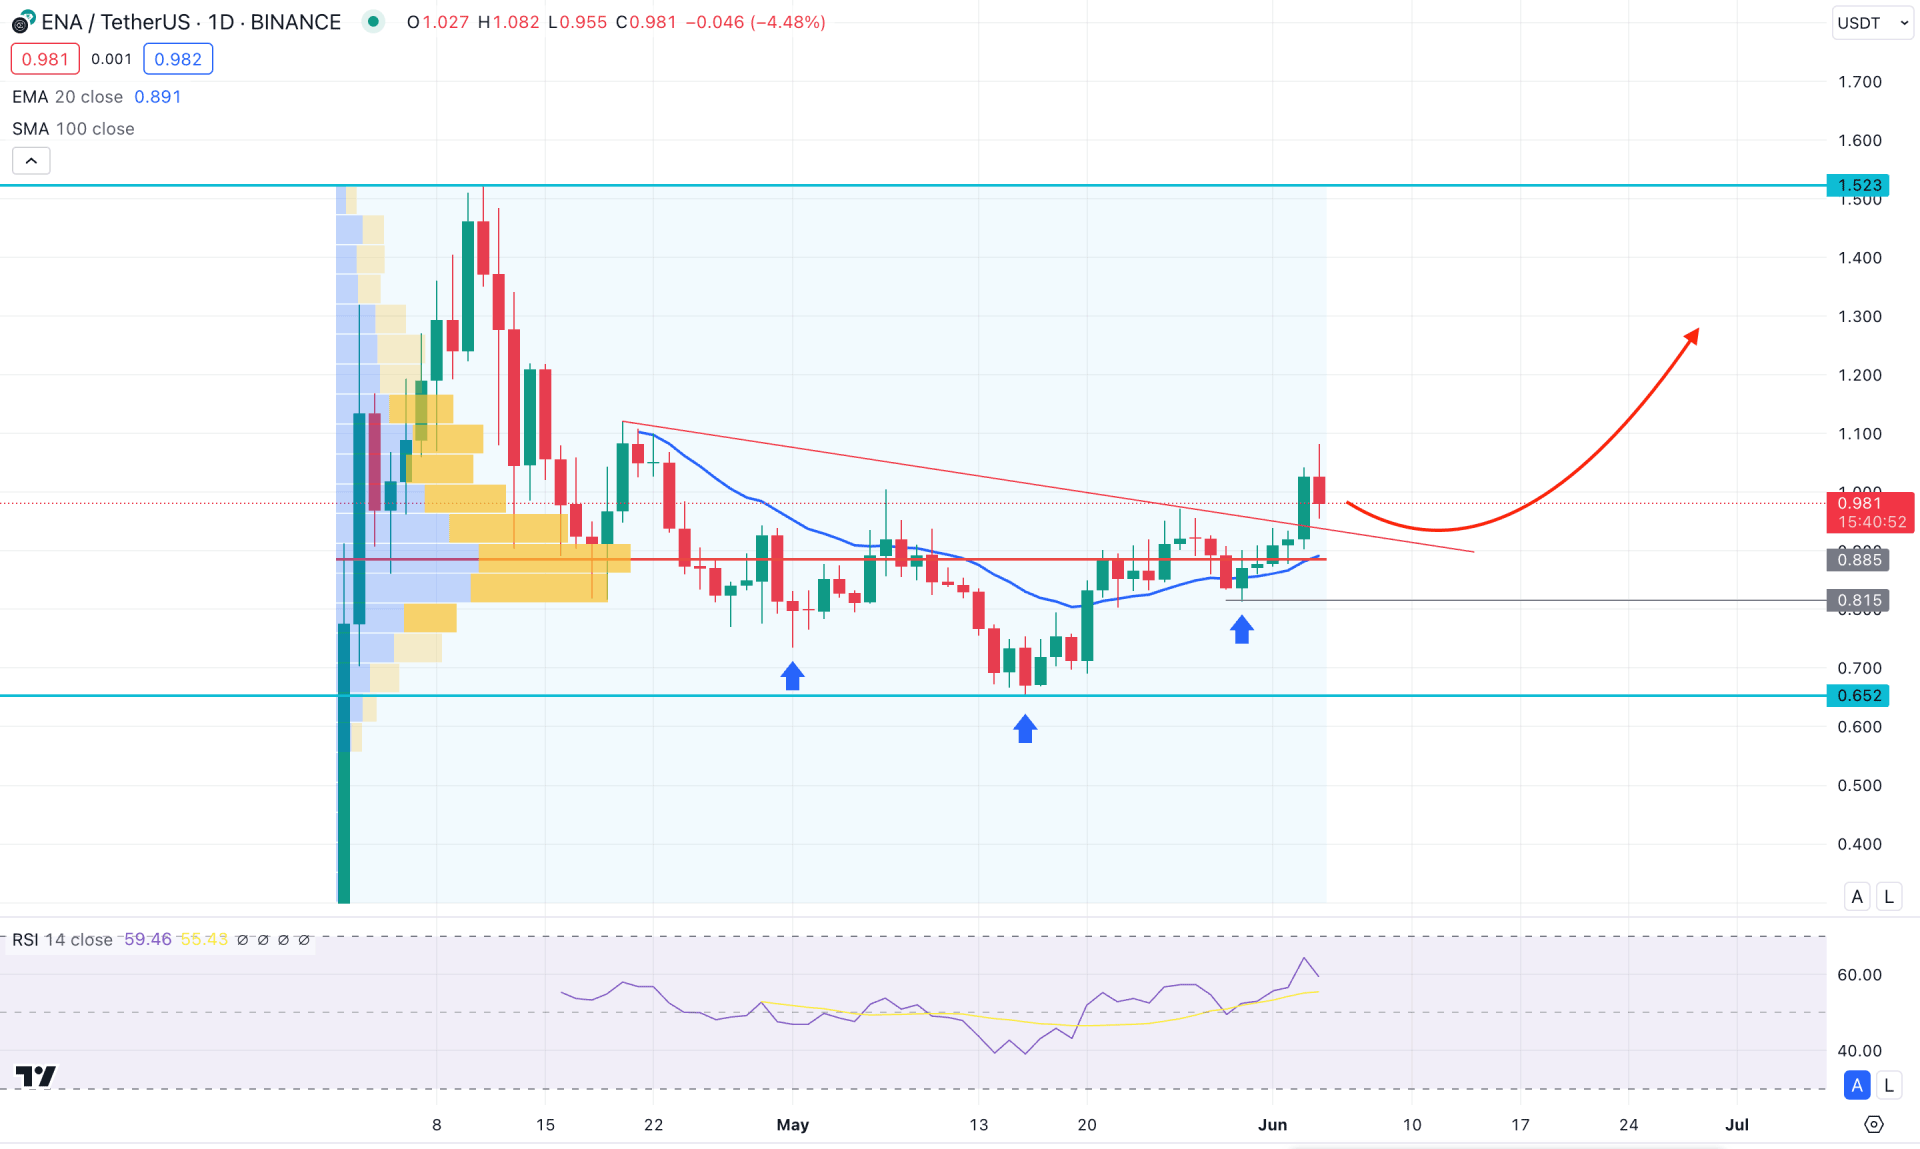
In the daily chart of ENA/USDT, the most recent price action shows corrective momentum, as no significant price surge is seen after forming a top at the 1.523 level. Since the all-time high formation, the price corrected lower below the 50% Fibonacci level and showed buyers' interest in the momentum.
In the higher timeframe, the recent weekly price suggests a bullish continuation as a doji candlestick is seen after a bullish engulfing pattern. In that case, an upward continuation is highly possible as long as the current price trades above the 0.812 low.
In the volume structure, the highest activity level since the Binance launch is at 0.885 level, which is just below the current price. Multiple bullish daily candles are present above this high volume line, which suggests a possible upward continuation in the coming days.
In the daily price, the main price shows a bullish possibility from the valid inverse Head and Shoulders breakout. As the current price trades above the neckline resistance, we may expect the buying pressure to extend in the coming days. However, investors should closely monitor the current trendline resistance to find how bulls hold the price above this line. Any immediate downside reversal could eliminate the buying pressure at any time.
In the secondary window, the 14-day RSI shows buying pressure as it hovers at the highest level. As the current reading is above the 50.00 neutral points with room to visit the 70.00 overbought line, we may expect the buying pressure to extend.
Based on the daily market outlook of ENA/USDT, the ongoing buying pressure is potent, where the current aim is to test the 1.4000 psychological level. However, the current high volume line is the crucial price level to look at, as a strong downside pressure below this line could activate the downside possibility.
In that case, a bearish daily candle below the 0.815 line could validate the bearish signal, where the main aim is to test the 0.652 support level.
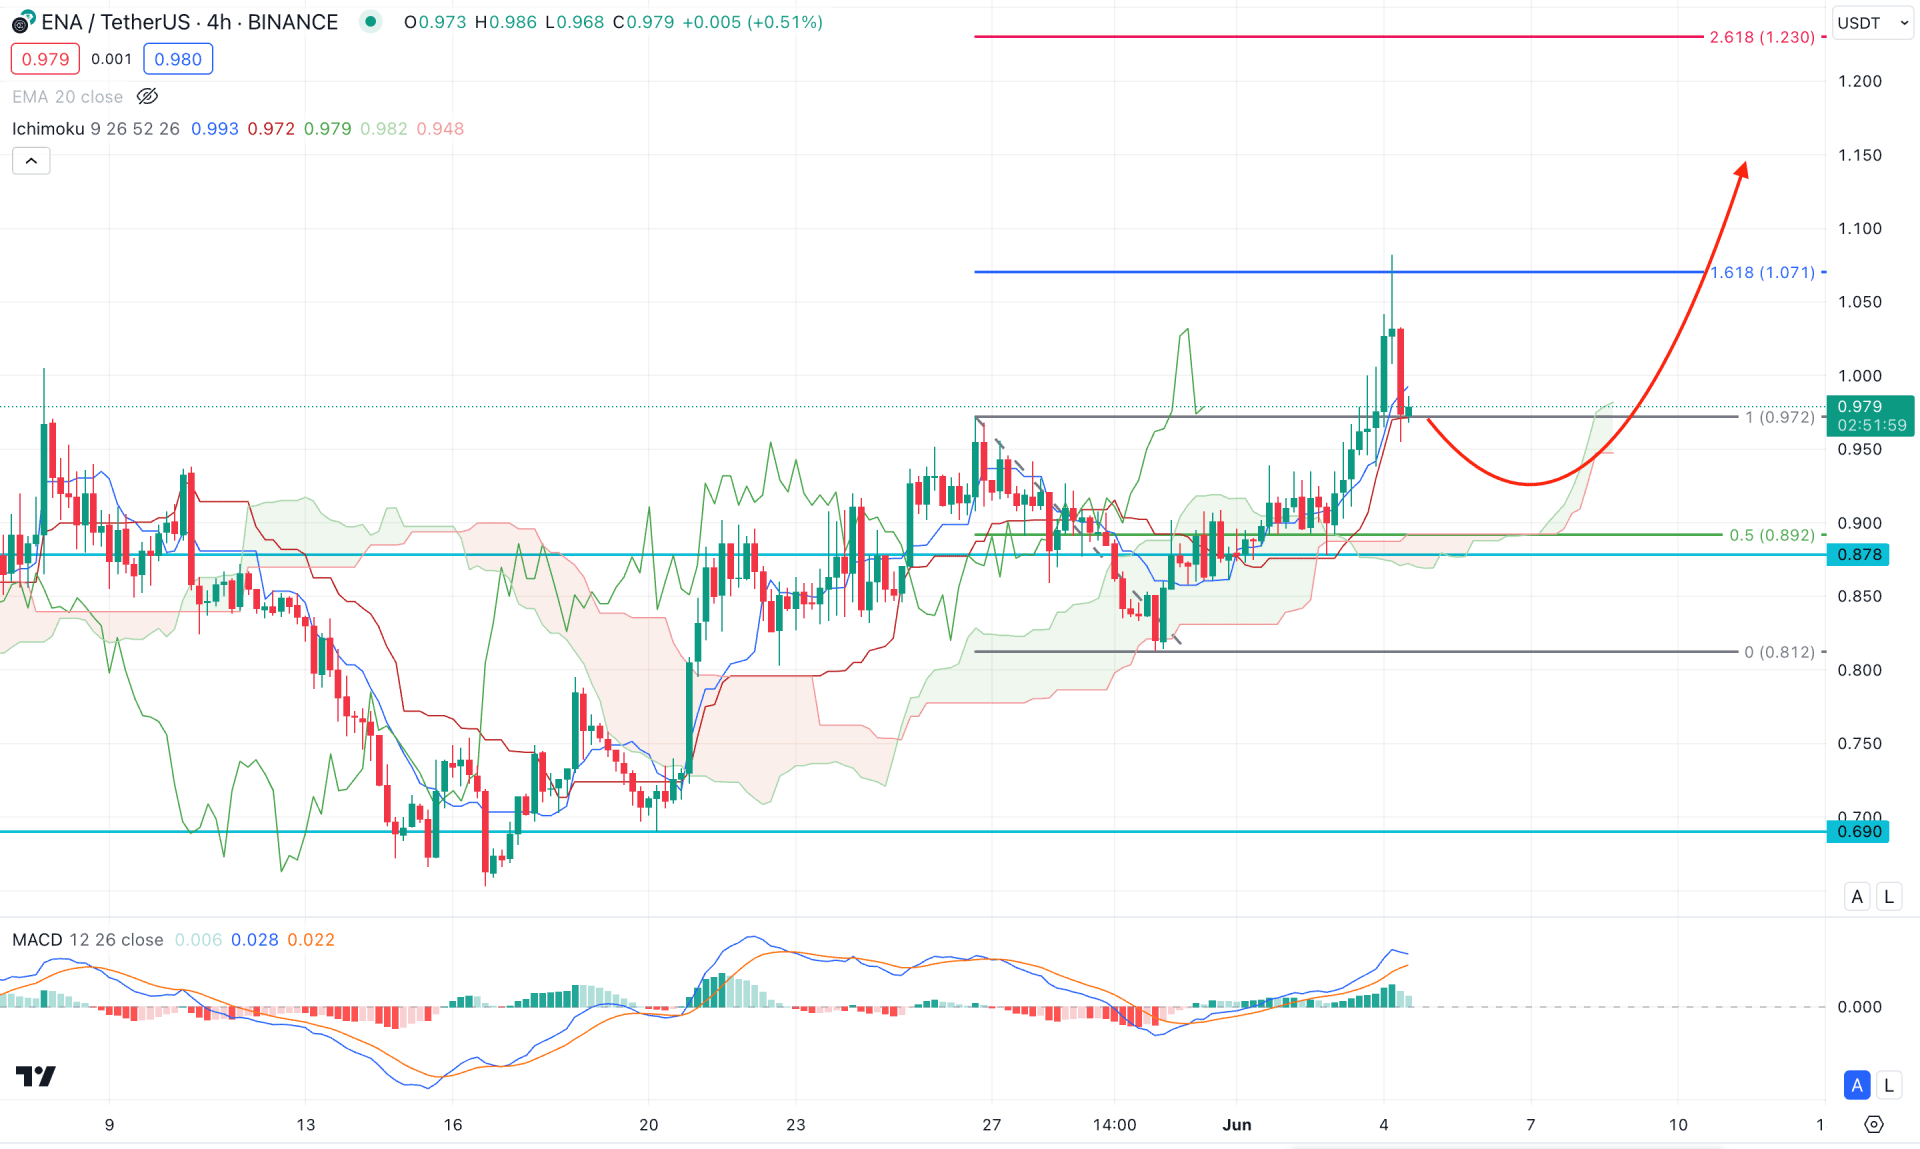
In the H4 timeframe, the ongoing buying pressure is solid for the ENA/USDT price. After having a bullish breakout from the Ichimoku Cloud, a bullish continuation is seen above the 0.979 high. Moreover, the future cloud shows the same story, where the current Senkou Span A is above the Senkou Span B line.
In the indicator window, the MACD Indicator suggests pressure for bulls as the current Histogram aims to reach the neutral point. Moreover, the Signal line is at the overbought level, from which a bearish reversal could signal potential downside pressure in the main chart.
Based on the H4 outlook, the ENAUSD price is pending a sufficient downside correction. A valid bullish rebound from the 0.933 to 0.878 area would be a long opportunity, targeting the 1.230 Fibonacci Extension level.
On the other hand, a failure to hold the price above the Ichimoku Cloud could initiate a short opportunity, towards the 0.690 low.
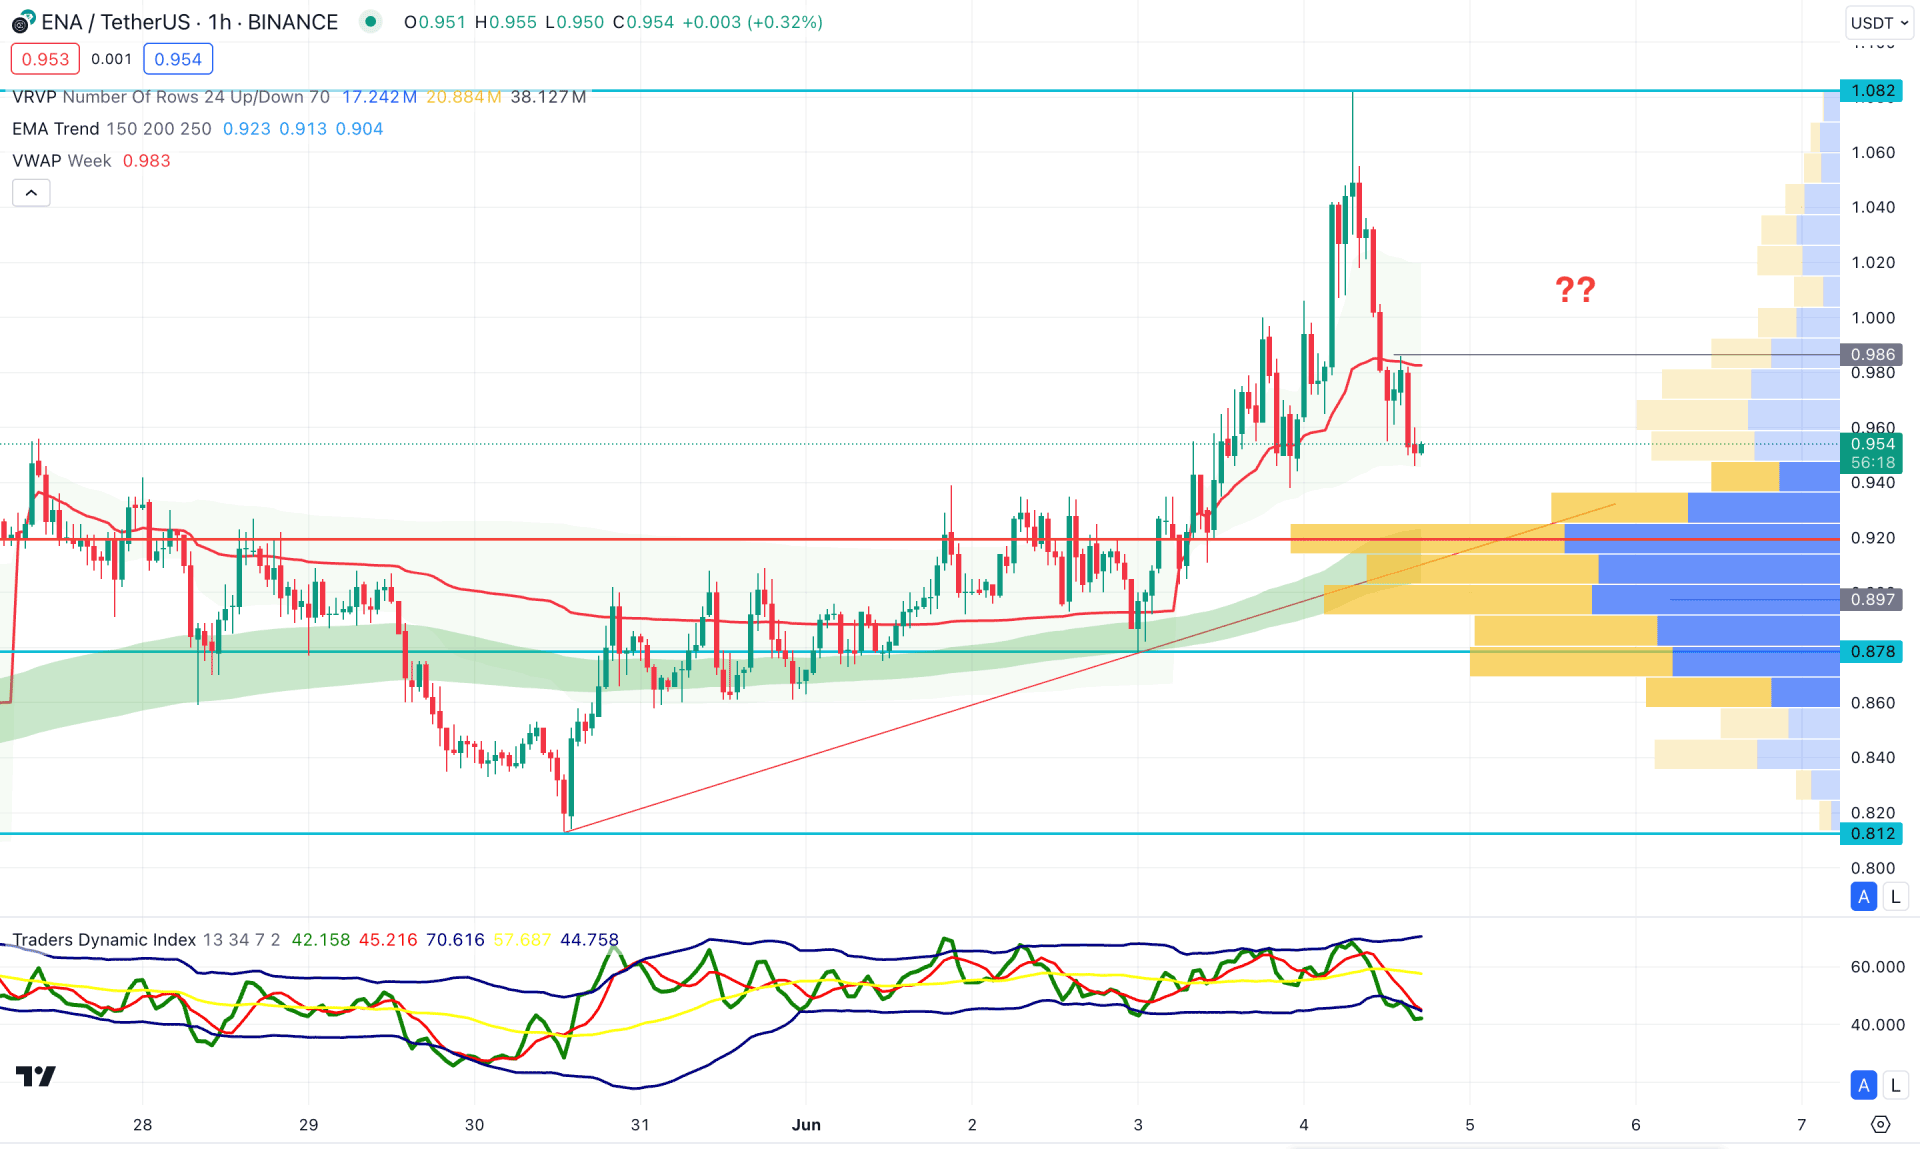
In the hourly time frame, an ongoing selling pressure is visible, which could result in a valid pump and dump scheme. However, the current price trades above the visible range high volume line, which might result in a bullish continuation at any time.
In the secondary indicator window, the Traders Dynamic Index (TDI) is at an oversold zone, suggesting a strong intraday selling pressure. In that case, a bottom formation at the near-term support line could be a potential long opportunity.
Based on the hourly price prediction of ENA/USDT, the Moving Average Wave is acting as a major support, from which a bullish rebound above the 20 EMA could be a potential long signal. However, a prolonged selling pressure below the 0.897 level could lower the price below the 0.812 support level.
Based on the ongoing price prediction of ENA/USDT, a strong bullish continuation might continue from the daily Inverse Head and Shoulders breakout. However, the intraday price is still bearish from where buying pressure is needed to form a long-term bullish signal.


