
Published: April 22nd, 2026
Following evident futures liquidations and a planned release of 18.6M ENA to a single whale address, Ethena (ENA) was under intense selling pressure. Due to overbought technicals and strong long positioning, the coin has recently rallied significantly, making it susceptible to a correction. Technical outlook, market updates, and dealer commentary all emphasize that ENA was overextended before the sell-off.
ENA's underperformance was also influenced by the larger market environment. Yahoo Finance's report offers perspectives on the macro and DeFi backdrop. The rising geopolitical conflicts and DeFi-specific worries, such as significant stablecoin losses from Ethereum and low liquidity, led to a risk-off sentiment.
Let's see the price outlook from the ENA/USDT market analysis:
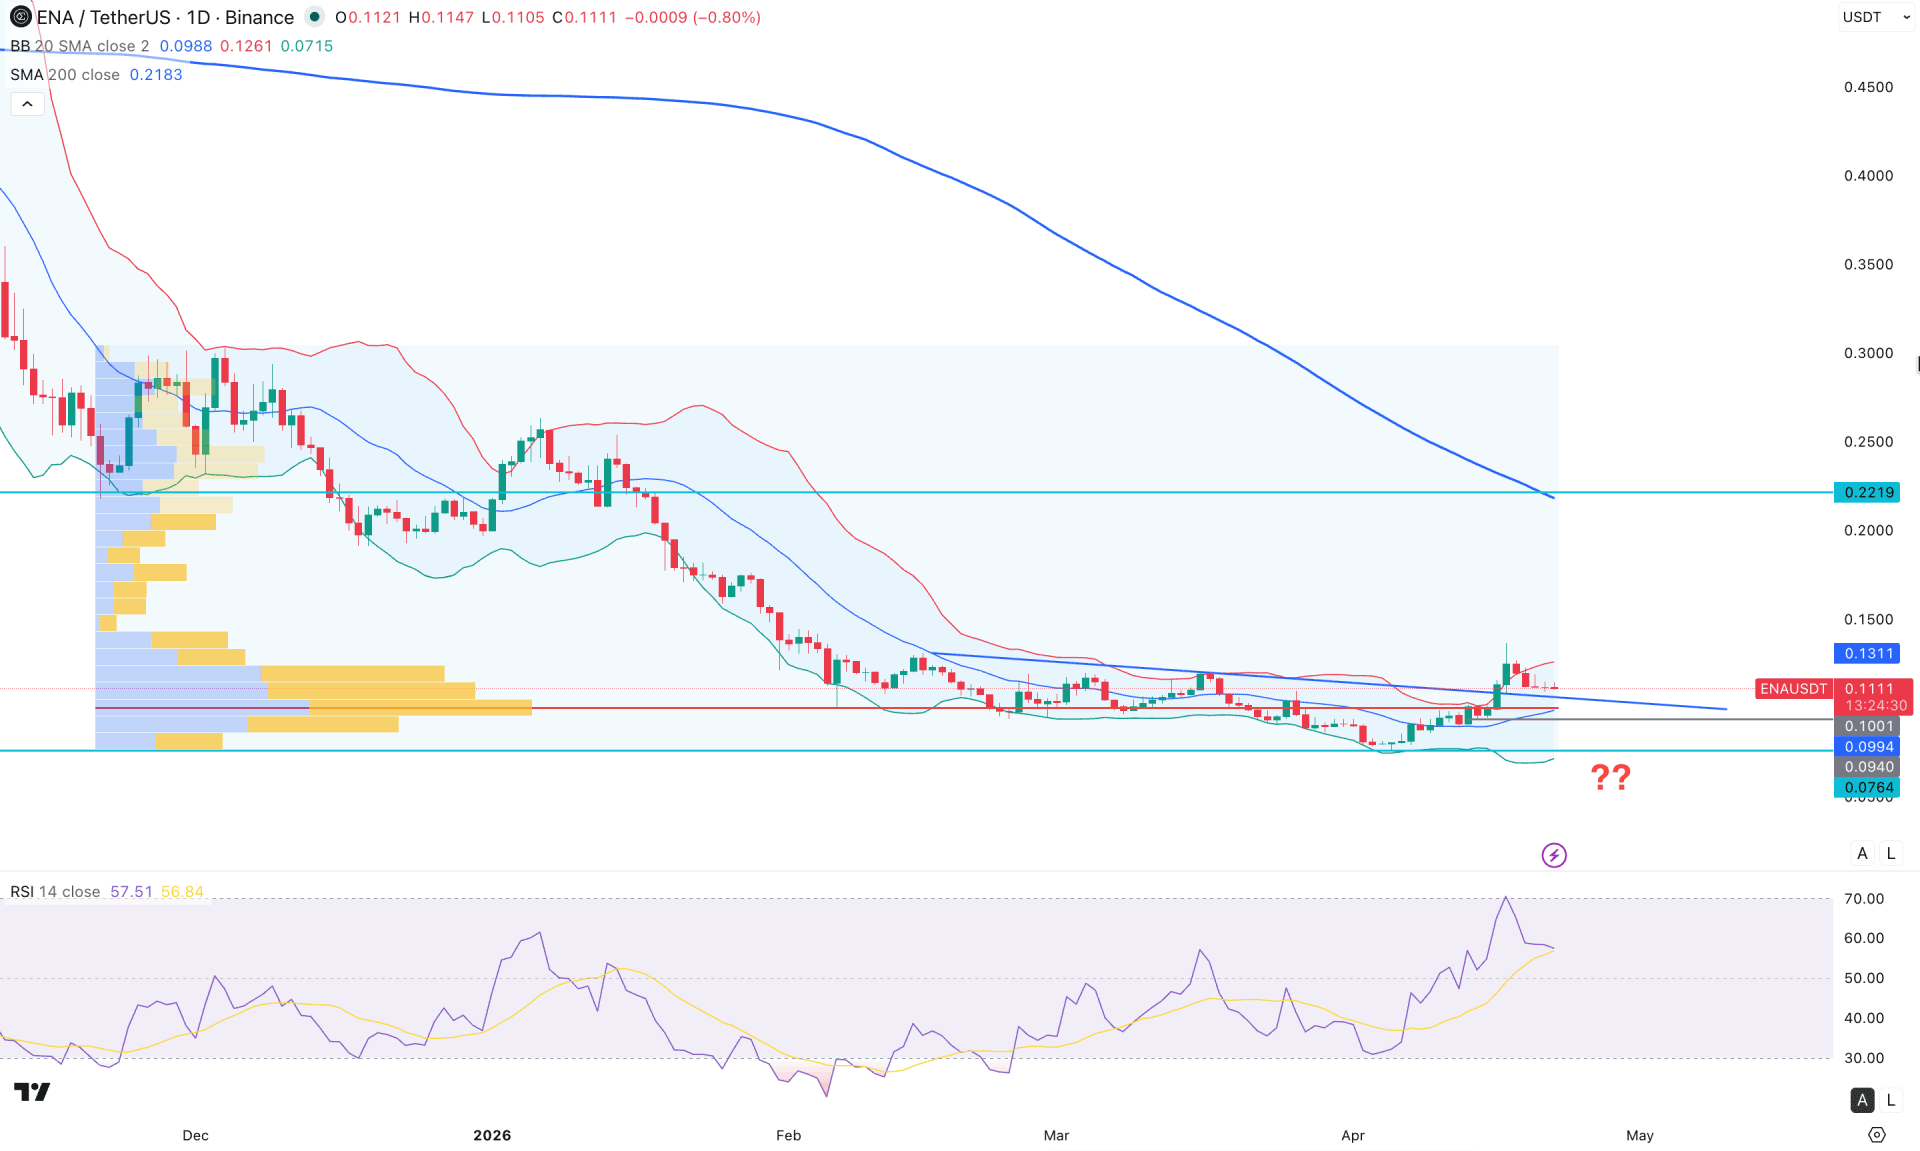
In the daily chart of ENA/USDT, extensive selling pressure has been seen since the beginning of 2026, with no sign of a valid bullish recovery. However, the most recent descending trendline breakout with consolidation above the trendline support signals a minor bullish opportunity.
In the monthly timeframe, the price is trading at the historic low, with the recent candle having a bullish close after seven consecutive bearish months. Looking at the broader structure, the price is trading at an extremely discounted zone, which is an attractive price area for long-term investors. Moreover, the weekly timeframe shows a decent bullish recovery but failed to hold the momentum above the 0.1214 weekly resistance.
By volume, higher activity is seen at the bottom, as the highest activity level since December 2025 is at 0.1000. Primarily, the price is trading above the high-volume line, signaling the presence of early buyers in the market. Investors should observe the price behavior above this high-volume level, as additional bullish signals could offer an early long opportunity.
In the main price chart, a bullish breakout is seen beyond the Bollinger Band line, signaling a valid bullish breakout. Moreover, a sideways market is evident, with the mid Bollinger Band line acting as immediate support, in line with the high-volume level.
On the other hand, the 200-day Simple Moving Average is bearish, but the gap between the current price and the dynamic 200 SMA has expanded.
In the Relative Strength Index, the price has touched the 70.00 overbought level for the first time in the year, signaling a stable buyers' presence in the market.
Based on the current market structure, the price can offer a decent long-term opportunity with a bullish reversal from the high-volume support level. In that case, a bullish break with price stability above the mid Bollinger Band could increase the possibility of testing the 0.2000 psychological level.
On the other hand, the price failed to sustain the buying pressure above the 0.1204 critical resistance level. Moreover, multiple bearish candles are visible below the upper Bollinger Band, signaling further downside possibilities.
In that case, a failure to hold the price above the 0.1000 level could be a challenging factor for buyers, as the price may create a new low below the 0.0994 level.
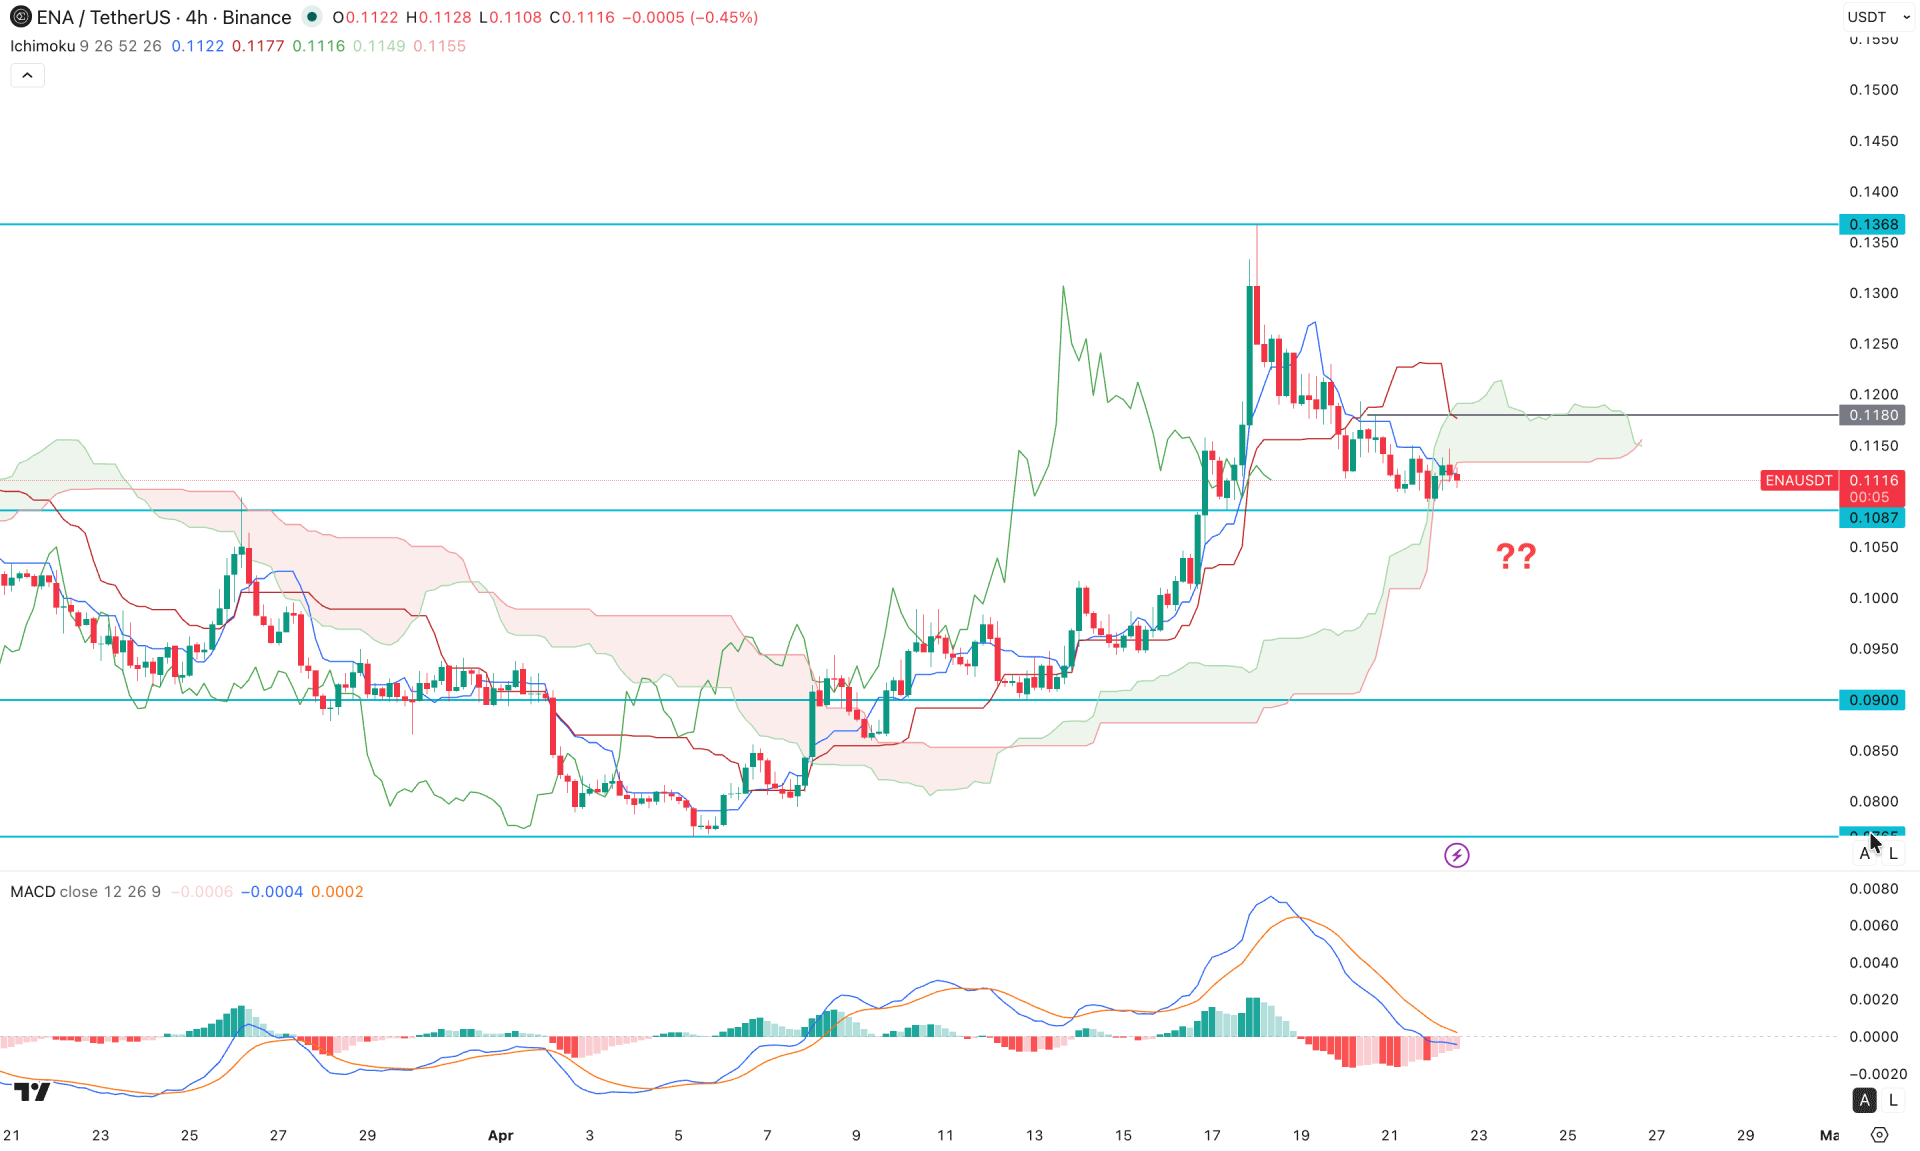
In the four-hour timeframe, the price is trading under pressure after finding a top at the 0.1368 level. Moreover, multiple bearish candles are visible below the Ichimoku cloud area, signaling a minor downside possibility. In the future cloud, mixed market momentum is visible as both lines are flat after a recent crossover.
In the secondary indicator window, the MACD histogram shows downside momentum, with multiple red histograms below the neutral line. Moreover, the signal line has moved toward the neutral level after having a bearish crossover near the top.
Based on the overall market structure, ENA/USDT is trading in a premium zone. Immediate support is at the 0.1087 level. Primarily, the price is facing resistance from the dynamic lines, increasing the downside possibility. In that case, a bearish four-hour candle below the 0.1087 level could open the door to a move to the 0.0900 area.
On the other hand, the price is having minor selling pressure below the cloud area, which could invalidate the downside possibility after an immediate bullish rebound from the 0.1180 level. In that case, the price could test the 0.1368 resistance level again before moving further toward the 0.1500 area.
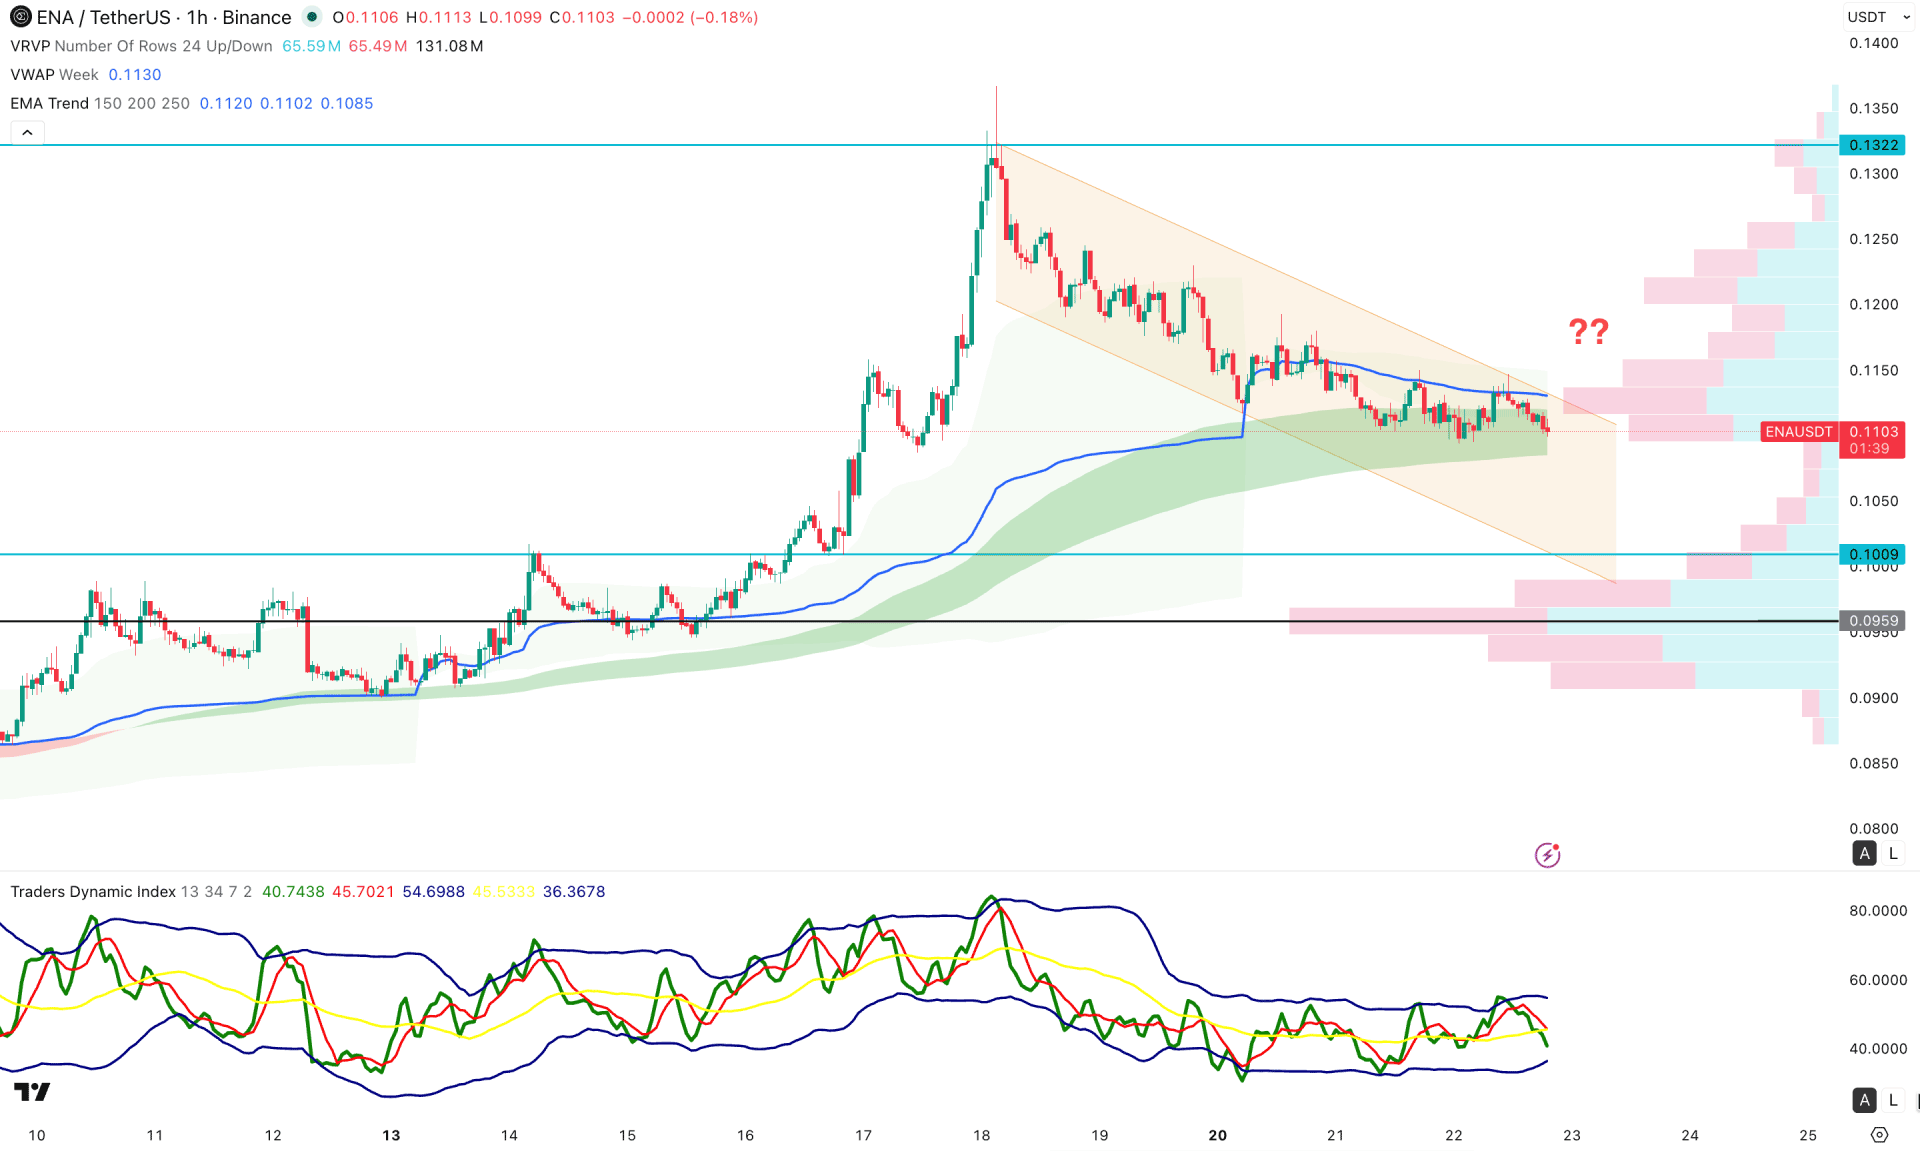
In the lower timeframe, the price is trading within a bearish correction, as the most recent price is creating a ceiling at the trendline resistance. Primarily, selling pressure is coming from the weekly VWAP level, while the gap between the price and the high-volume line signals a possible downside move.
In the secondary indicator window, the Traders Dynamic Index has rebounded from the upper peak area, which signals selling pressure in the market. As the TDI level has not reached the bottom yet, we may consider the downside possibility valid.
Based on this structure, investors should monitor how the price reacts in the current area, as downside momentum is highly possible with a target at the 0.1009 support level.
On the other hand, an immediate bullish break above the 0.1192 swing high could validate the channel breakout and open the room for reaching the 0.1322 resistance level.
Based on the overall market structure, the ENA/USDT price is trading within a possible pump-and-dump structure that requires clear validation from the trendline support. A valid buying pressure with a consolidation above the breakout point could reverse the market momentum and open a long opportunity.


