Published: November 27th, 2024
One of the biggest cryptocurrency derivatives trading platforms in the world, Deribit, intends to accept Ethena's USDe (USDe) artificial dollar as profitable margin assets.
Deribit announced on November 22 that as a role of the cooperation, users will be able to use USDe as a guarantee for derivatives margins in a cross-collateral pool and receive rewards for keeping it.
Deribit claims that subject to regulators' approval, the exchange plans to include USDe in its cross-collateral pool as early as January.
Guy Young, the founder of Ethena Labs, discusses Deribit's intentions to include USDe as lucrative margin collateral.
Ethena claims that in addition to Deribit, other cryptocurrency trading platforms like Bitget and Gate have also been incorporating USDe as margin collateral.
USDe, a synthetic dollar or digital currency replicating the worth of US dollars without being directly supported by actual dollars in reserve, is available through the decentralized stablecoin protocol Ethena, which was introduced in 2023.
Apart from USDe, Ethena manages its individual Ethena (ENA) coin, which is the ecosystem's governance token and has experienced a notable expansion in recent months.
As of this writing, Ethena's ENA is up about 70% over the last 30 days with newly added value. UStb (USTB), an original stablecoin project that Ethena Labs announced in September, will be constructed in partnership with digital security infrastructure Securitize and prominent Bitcoin shareholder BlackRock.
Let's see the future outlook of Ethena coin from the ENA/USDT technical analysis:

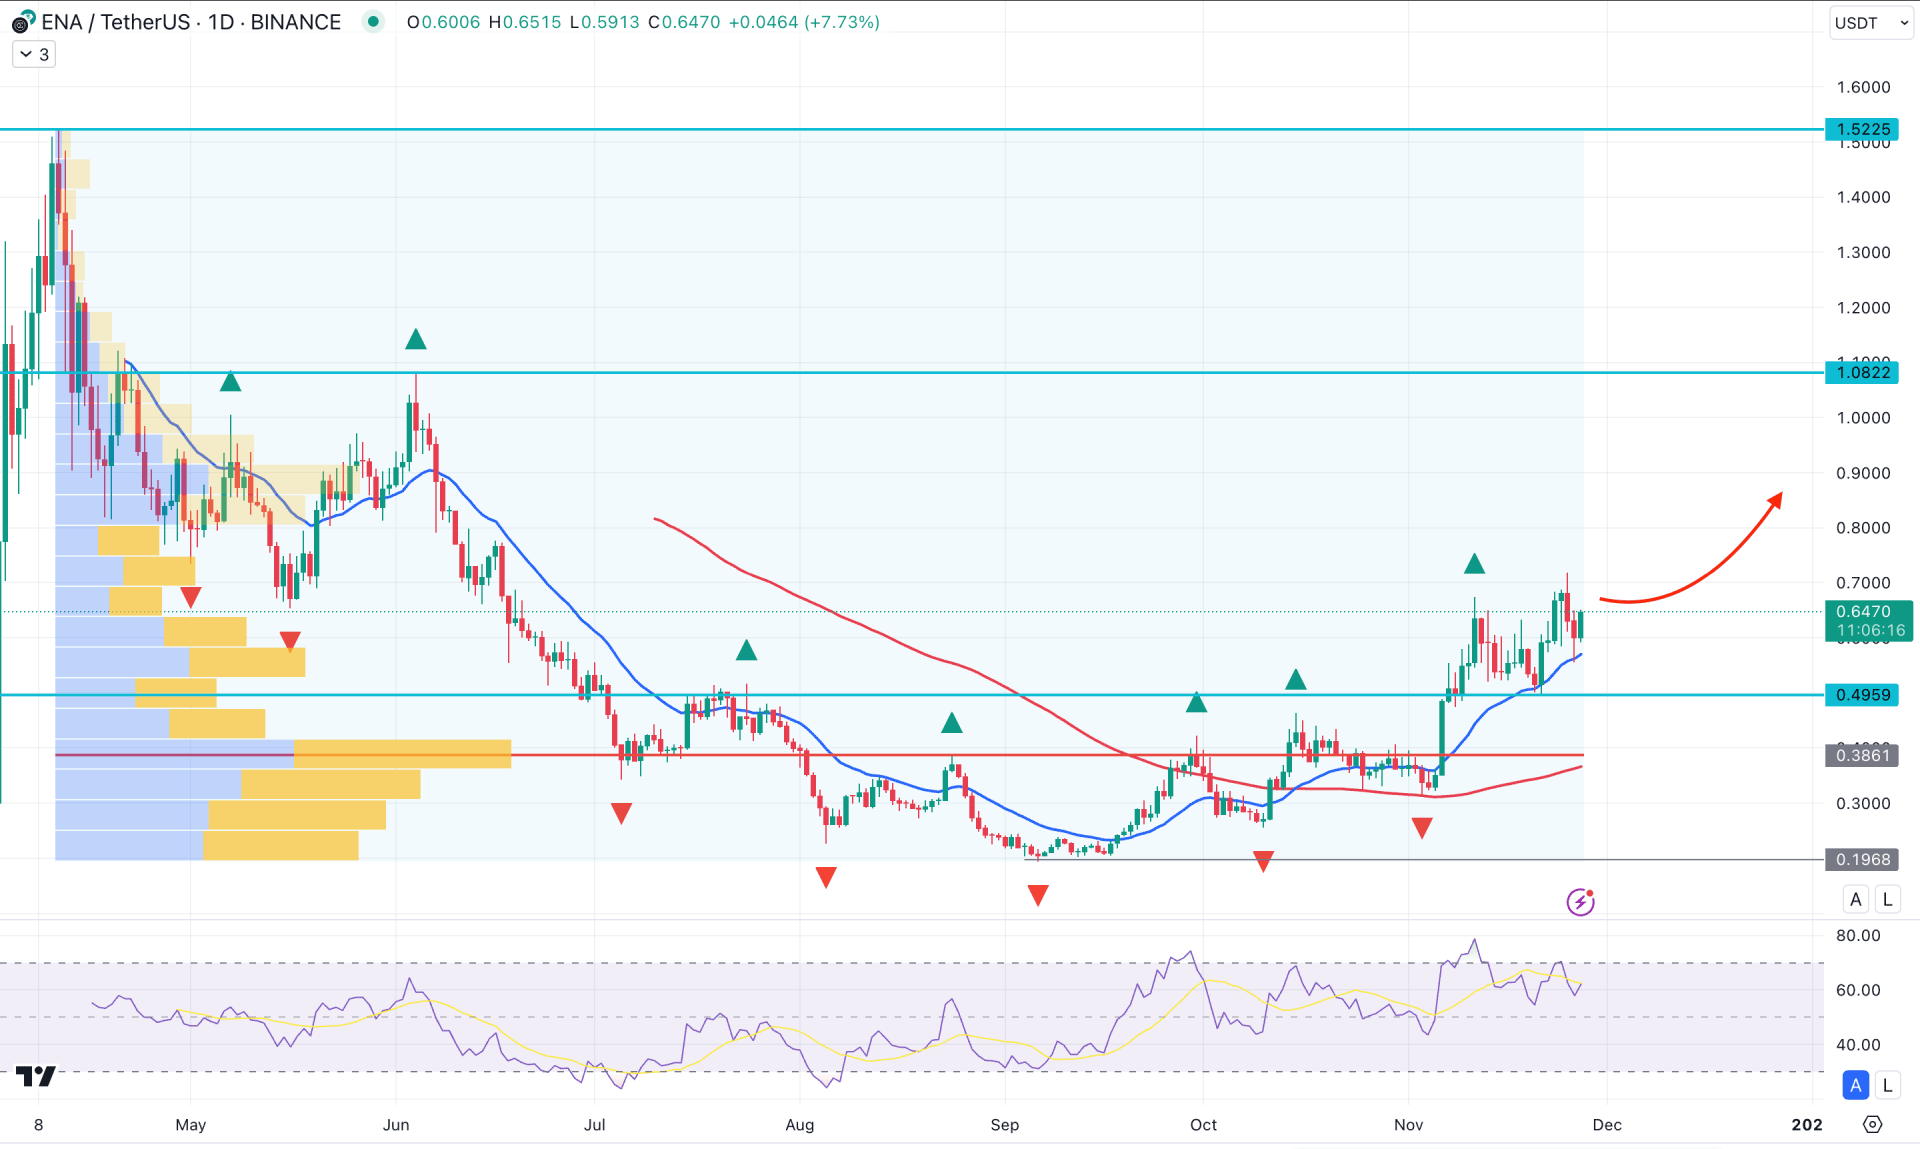
In the daily chart of ENA/USDT, the recent price showed a bullish U-shape recovery from the bottom followed by a bullish flag pattern continuation. As long as the recent price hovers above the crucial low, we may expect the bullish pressure to extend.
In the current context, the ongoing buying pressure is potent in the higher timeframe, where the monthly candle remains bullish after a Doji formation. Moreover, the current price is hovering above the 4-month high, from which a successful bullish close in November could increase the continuation opportunity.
In the volume structure, the current price is trading above the high volume line, signalling an institution's involvement in the bullish price action. Also, the price formed a bullish rally-base rally formation above the high volume line, signalling no profit taking from the top.
The dynamic 20-day Exponential Moving Average is working as an immediate support, backed by the 100-day SMA line. As long as these dynamic levels are below the current price, we may expect a bullish continuation even if there is a minor downside correction.
Based on this outlook, the current tradeable range will be from 0.1968 low to 1.0822 high. As long as the 0.1968 low is protected, the primary anticipation of this pair is to look for long trades.
The bullish signal is already present from the 20-day EMA and bullish RSI, but more confirmation is pending from the intraday chart before aiming for the 1.0000 psychological line. Overcoming this level might extend the bullish pressure and find resistance from the 1.5225 level.
On the bearish side, the 0.4959 static level will be an immediate barrier to look at as a selling pressure below this line could lower the price towards the 0.3000 psychological line.

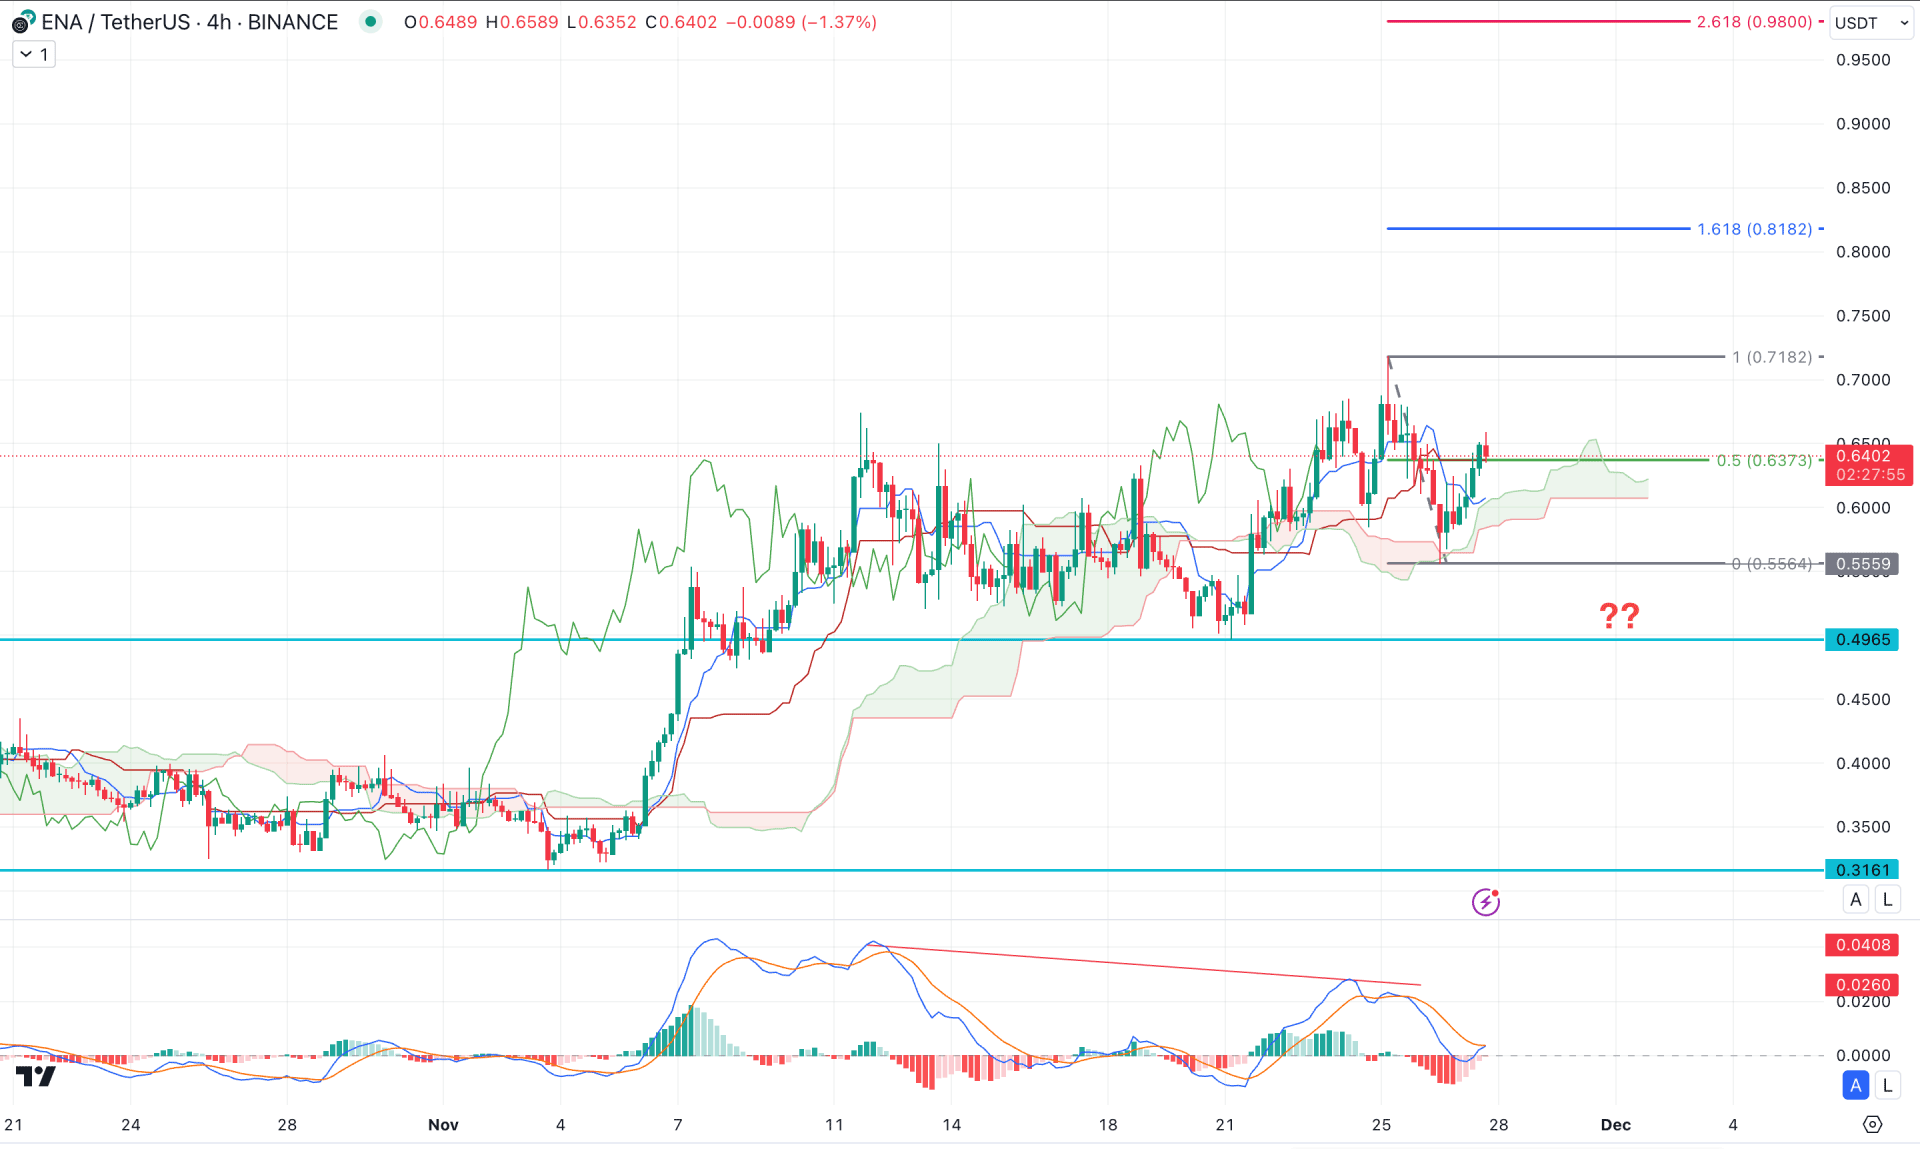
In the H4 timeframe, the recent price showed impulsive bullish pressure above the cloud zone, suggesting a valid trend reversal. Moreover, the price holds momentum and keeps pushing higher instead of forming a dump. As bulls hold their position above the crucial highs, investors might expect the upward momentum to continue.
In the indicator window, the current MACD Histogram reached a neutral level after finding a bottom, which signals a valid long signal. Also, the signal line formed a bullish crossover by remaining above the neutral level, which signals a confluence of bullish pressure.
Based on the H4 outlook, an immediate bullish pressure is possible, where the primary aim is to test the 0.8182 Fibonacci Extension level. However, a failure to hold the price above the cloud low could be a challenging factor to bulls, which might initiate a deeper correction towards the 0.3500 level.

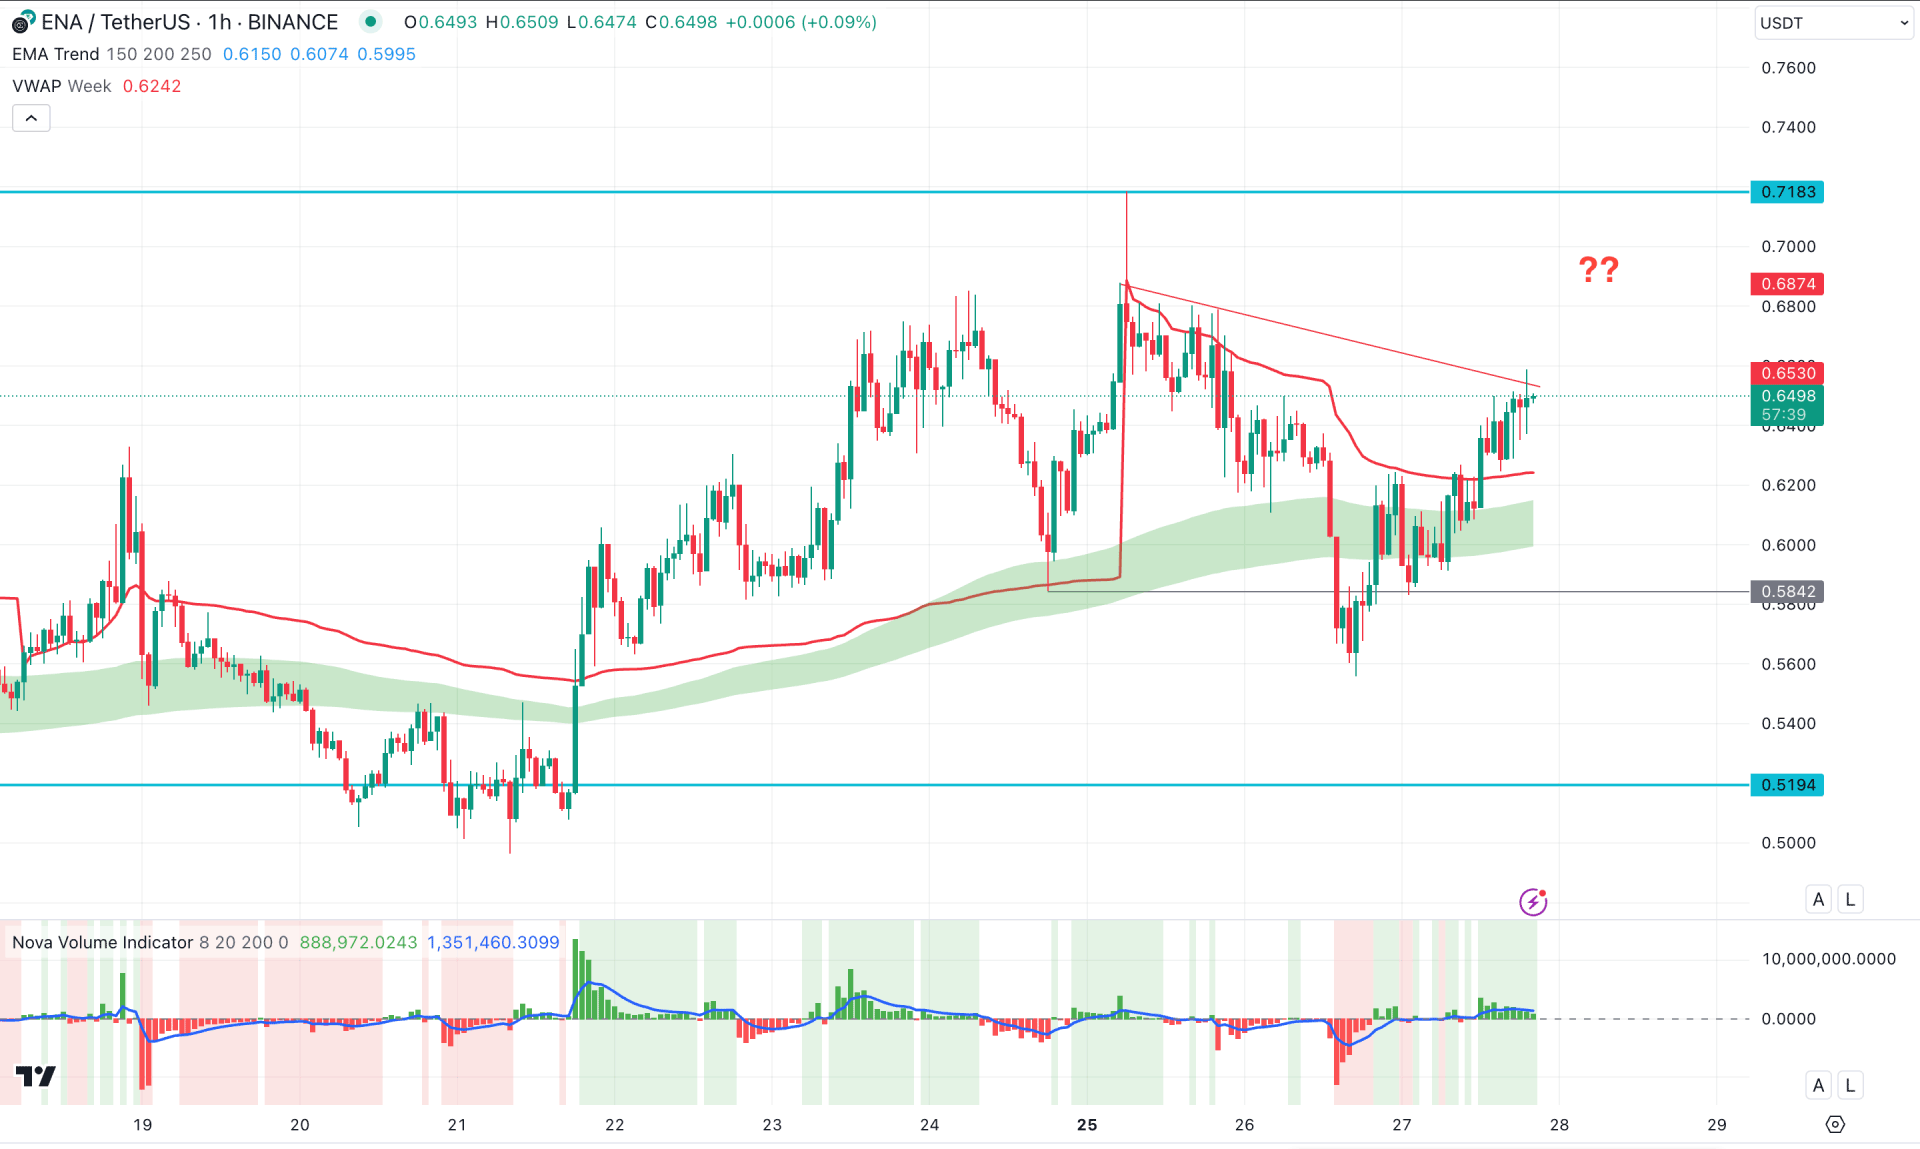
In the hourly time frame, the recent price showed a strong bullish reversal from the EMA wave, suggesting an upward continuation signal. Moreover, the price moved above the weekly VWAP level, signalling additional buying momentum.
The volume structure shows a positive outlook for bulls, where the current volume Histogram holds the momentum on the positive side.
Based on the current intraday outlook, the price is facing a trendline resistance where sufficient buy-side liquidity is present above this line. Investors should closely monitor how the price trades at the 0.6800 to 0.7183 zone from where a bearish reversal could signal a short opportunity.
On the other hand, any immediate selling pressure from the current zone with a bullish candlestick at the 0.6000 area could open an immediate long opportunity.
The broader crypto market is facing bullish pressure, possibly from the altcoin season for December. As the ENA/USDT price has multiple bullish signals from the recent bottom, an upward continuation is potent from a valid sell-side liquidity sweep in the intraday chart.