
Published: June 3rd, 2025
According to a recent report, about 41 million ENA tokens, worth above $12 million, were unlocked this week.
Even though the Ethena token release resulted in a notable rise in the number of tokens in circulation, ENA has only decreased by a meagre 1% in a day. This subdued response indicates that token holders' positive enthusiasm has assisted in absorbing the extra supply and halting a more severe drop.
The term "Open Interest" describes the total number of unresolved derivative agreements, such as futures or perpetual swaps. Traders' increasing interest and belief may be reflected in an increase in OI, which signals the entry of additional capital into the market.
The increase in OI (Open Interest) for ENA indicates that traders are likely opening additional positions in the hope of a recovery or long-term stability in spite of the token unlock.
Let's see the upcoming price direction of this token from the ENA/USDT technical analysis:
In the current chart of ENA/USDT, a pump-and-dump pattern is visible, with the most recent price trading at a deeply discounted zone. In this context, investors might wonder how the price will perform and whether a decent bullish recovery is possible from the bottom, with an affordable risk-to-reward ratio.
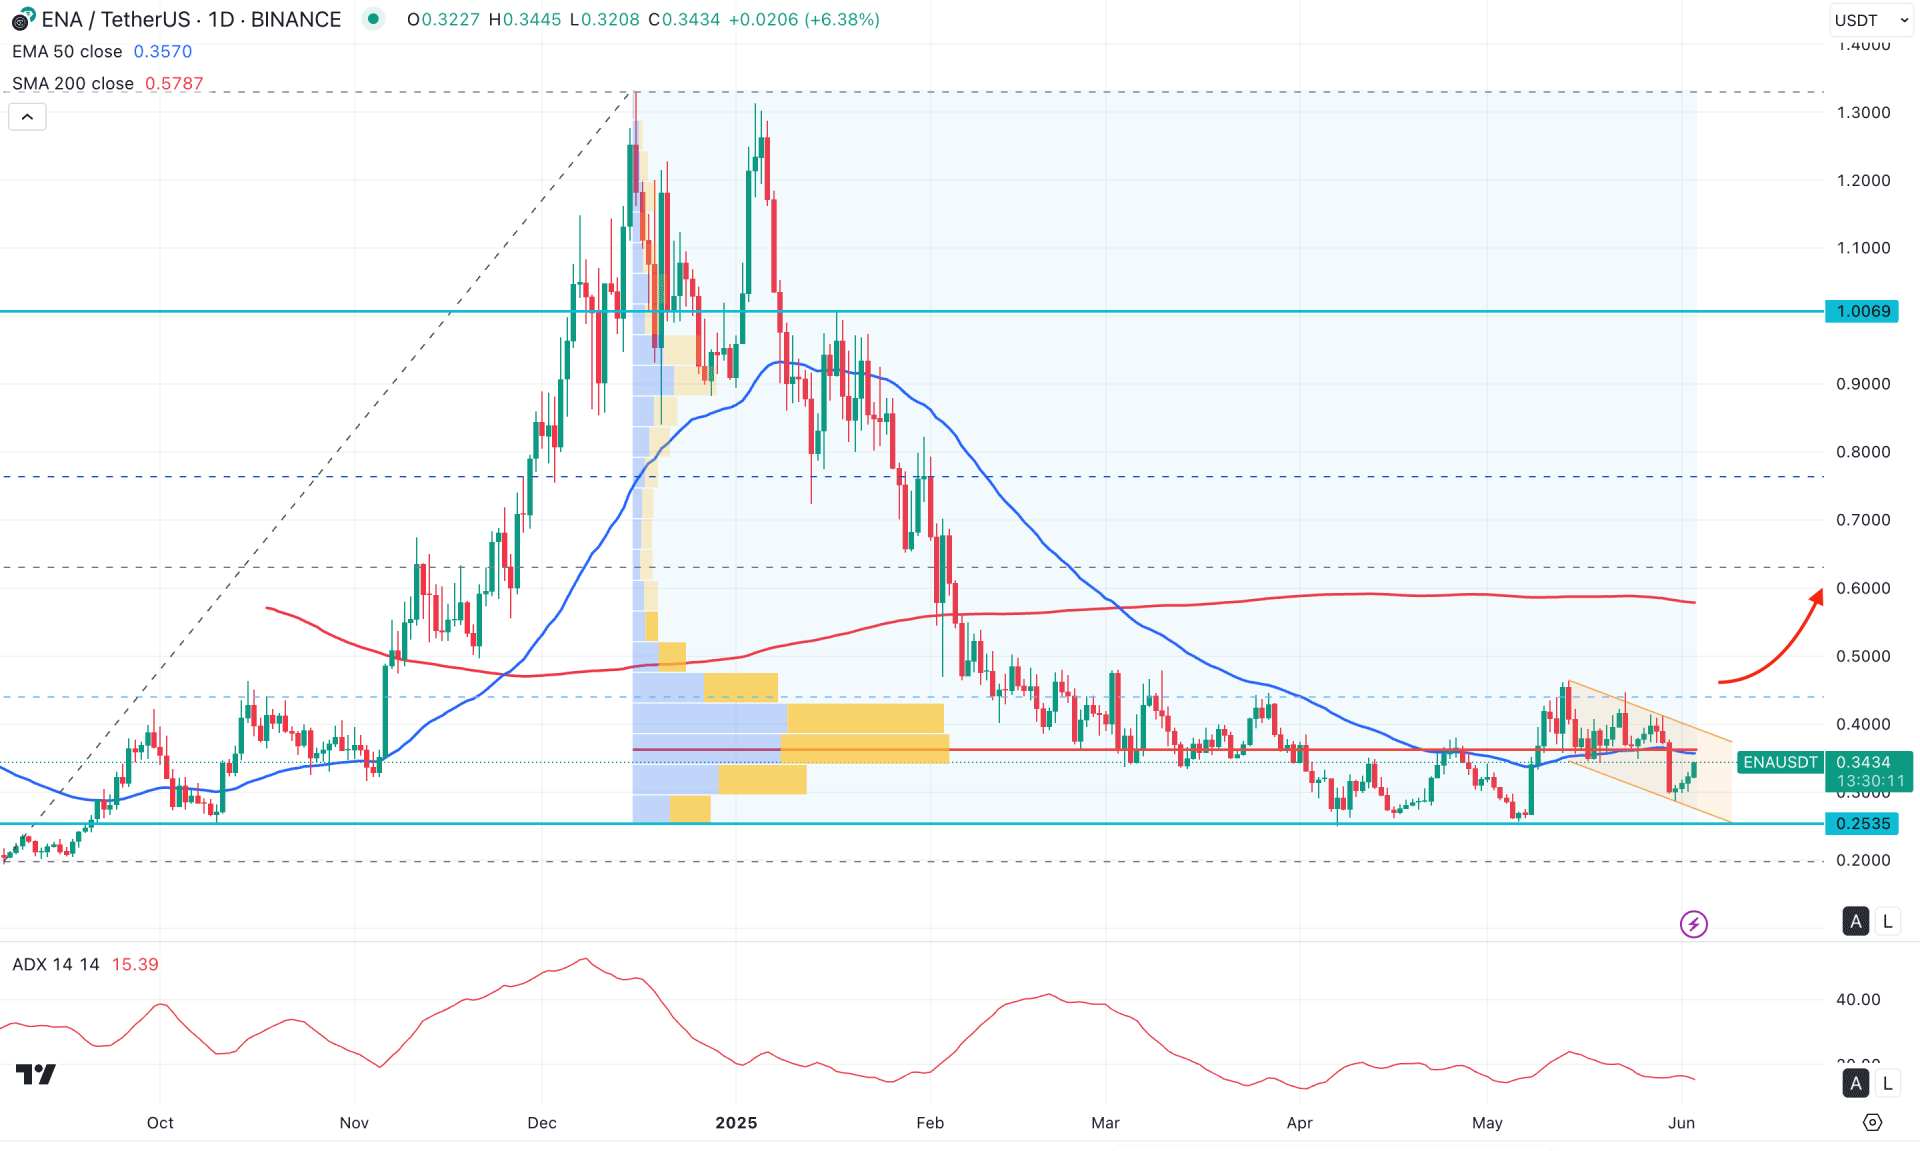
The bearish trend is evident in the higher timeframe, as the price has been declining for five consecutive months. However, the most recent monthly candle closed as a doji, breaking the previous monthly high. Yet, the price left the 0.2535 level untouched since April 2025. This indicates that bulls hold the price at the bottom, suggesting a potential upward recovery following a solid price action signal.
The overall structure appears sideways, as the current price consolidates within a defined range. Although it trades below the 0.3624 high volume resistance, additional confirmation is needed before anticipating further bearish momentum.
In the medium term, the trend is also sideways, as shown by the flat 50-day EMA within the current price range. The 200-day SMA also remains flat, with a notable gap between the price and the SMA. In this context, we might consider the ongoing trend bearish as long as the 200-day SMA stays above the current price. However, a decent bullish recovery is possible, particularly after the price overcomes the flat 50-day exponential moving average.
The Average Directional Index (ADX) signals a sideways trend in the secondary indicator window, as the current line is below the 20.00 threshold.
Based on the current market outlook, a bullish breakout with stable movement above the 0.4420 level could present an aggressive long opportunity, targeting the 0.6000 level. Furthermore, a breakout above the 0.4675 high would strengthen the long setup, increasing the possibility of a move toward the 0.7000 area.
On the other hand, the current price is trading within a descending channel zone. This resistance could serve as a crucial barrier. A failure to sustain above the 0.4154 level, followed by a breakdown below the 0.2000 area, would invalidate the bullish outlook.

In the H4 outlook, the recent price action shows sideways momentum, with the Ichimoku Kumo Cloud positioned above the current price. Additionally, the future clouds are sloping downward, indicating potential continuation of bearish momentum.
Furthermore, the dynamic Tenkan-sen Kijun-sen is helping to support the price, as it is currently trading above both lines. A downward continuation may be limited if the price remains above these dynamic support levels.
In the secondary indicator window, a bullish crossover has occurred in the MACD signal line, where the histogram is maintaining upward momentum by forming consecutive bullish bars.
Based on the four-hour market structure, the price is trading near the bottom of the range. Additional confirmation is needed before anticipating a bullish continuation. In this case, a valid four-hour candle close below the dynamic lines would signal a trend continuation opportunity toward the downside.
On the other hand, the broader market outlook remains sideways, but a higher recovery above the 0.4150 level could be the first sign of a bullish continuation. If that happens, a correction followed by a new swing high would be needed before anticipating a potential move toward the 0.6000 area.
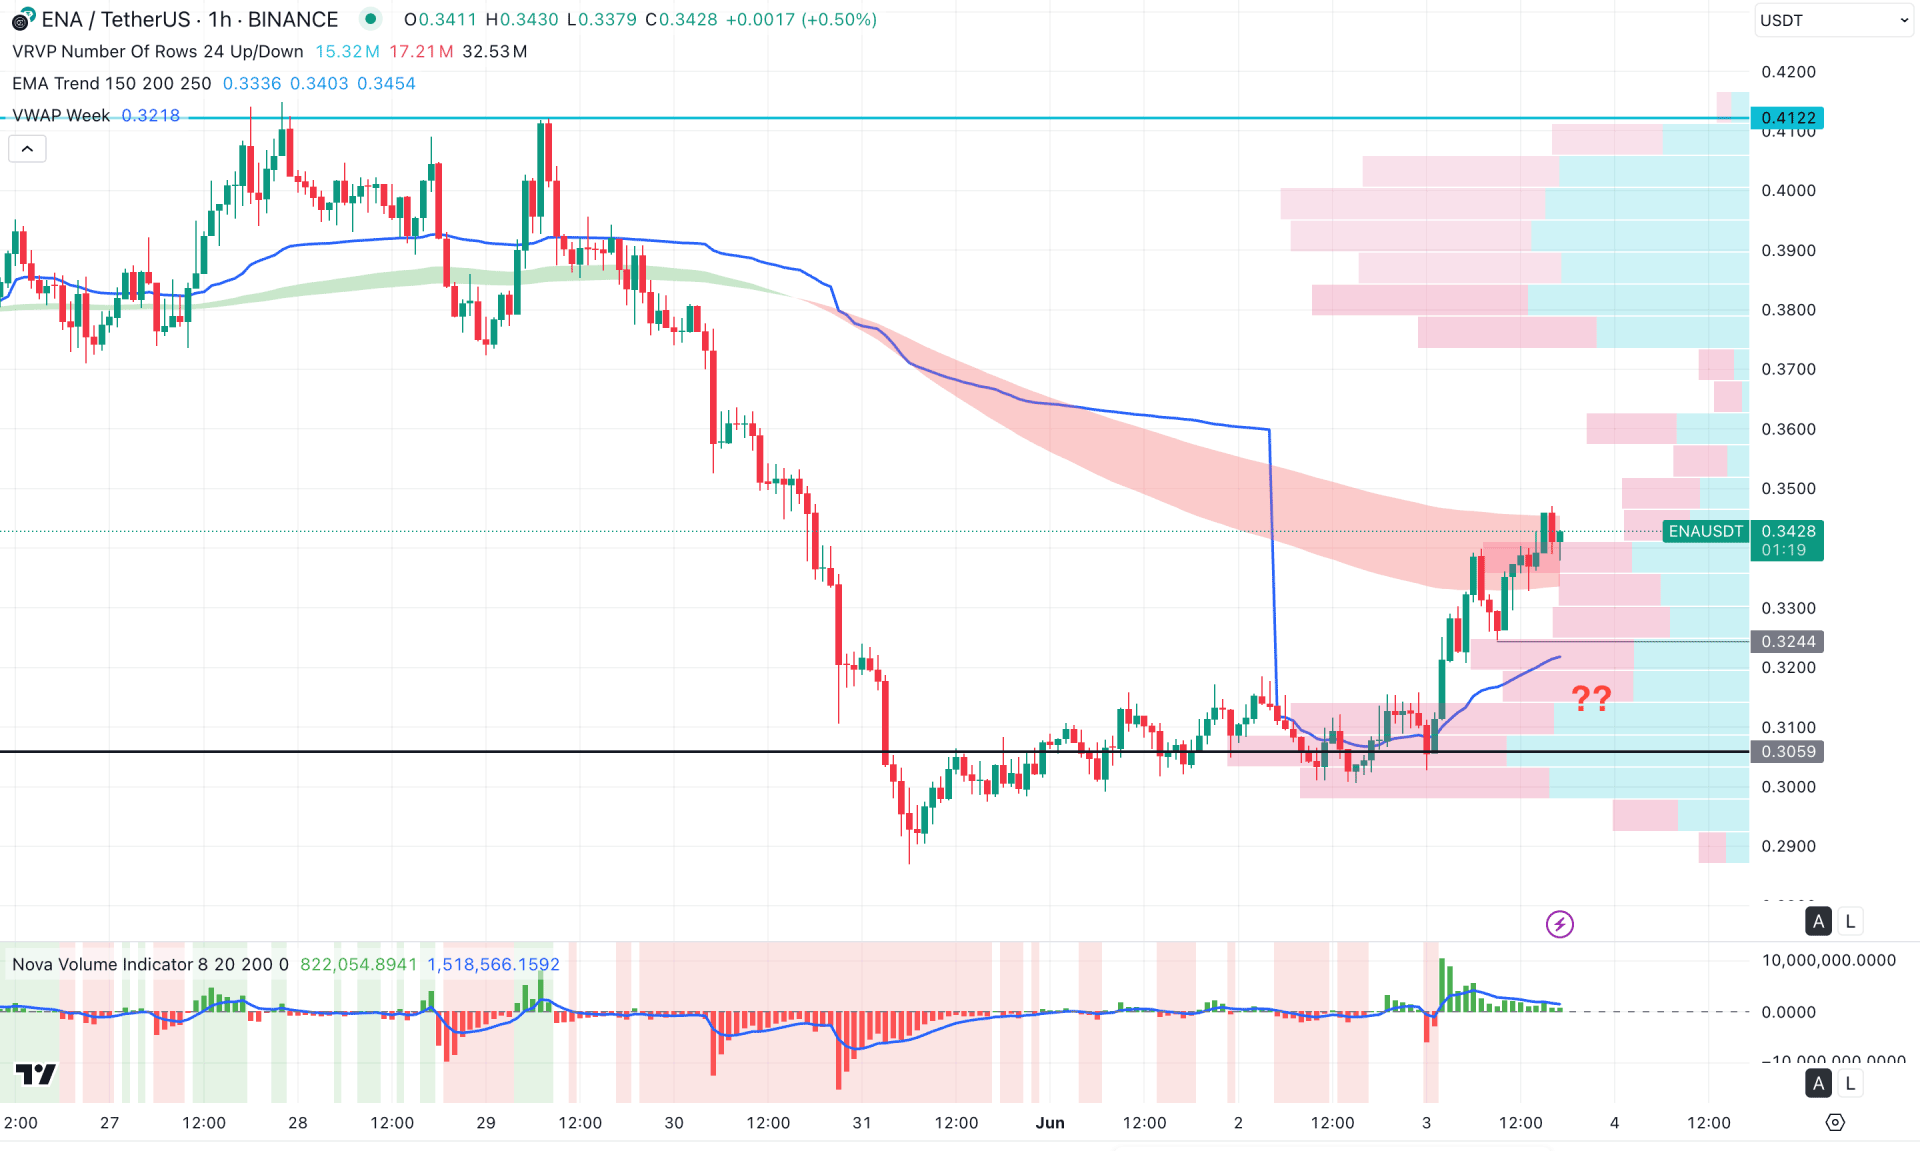
The recent price has been trading bullish in the hourly time frame after finding a bottom at the 0.2873 low. Moreover, the intraday high volume line is below the current price, working as a confluence bullish signal.
On the other hand, the Moving Average wave is above the current price and is a crucial barrier to bulls. As the current price is hovering at the EMA wave zone, investors should monitor how the price reacts after breaking out from this level.
In the volume structure, the Volume histogram shows a lower activity after shifting the momentum to bullish. In that case, more confirmations are needed before opening a long position as a trend continuation.
Based on this outlook, upward continuation is possible as long as the weekly VWAP level is below the current price. However, a minor downside recovery could come towards the 0.3244 level, from which another long approach might appear.
On the other hand, a deeper discount below the 0.3059 swing low could be an alarming sign to bulls as it might extend the downside pressure below the 0.2800 area.
Based on the current market outlook, the ENA/USDT bullish momentum might find a path after creating a valid channel breakout. In that case, investors might find an early bullish signal after having a recovery in the intraday chart.


