Published: December 18th, 2024
ENS Labs, the developer of the Ethereum Name Service (ENS), recently announced that it has chosen to use Linea's technology to create Namechain, its next layer-2 network. Following the news, market participants took a massive upside pressure, taking the price to an all-time high level.
Consensys, a major Ethereum infrastructure provider, developed the no-knowledge rollup known as Linea, which was released in July 2023. According to L2Beat, it is the seventh-top rollup network, in which $1 billion is locked up in its ecosystem.
Although ENS has been referred to as "the telephone directory for Web3," the domain name service (DNS) of the web is a more accurate comparison. The sequences of numbers and letters that constitute Ethereum bitcoin wallet addresses are less reliable than ENS addresses like parishilton.eth, which is the name of the heiress purchased in 2021.
Although, in contrast to ENS, some of the most well-known blockchain companies have used Optimism's OP Stack to expand their networks, the announcement coincides with other significant cryptocurrency projects announcing plans to launch layer-2 networks.
Inspired by Linea's technology, ENS will be among the first significant projects to deploy a layer-2 blockchain.
Let's see the complete price projection from the ENS/USDT technical analysis:

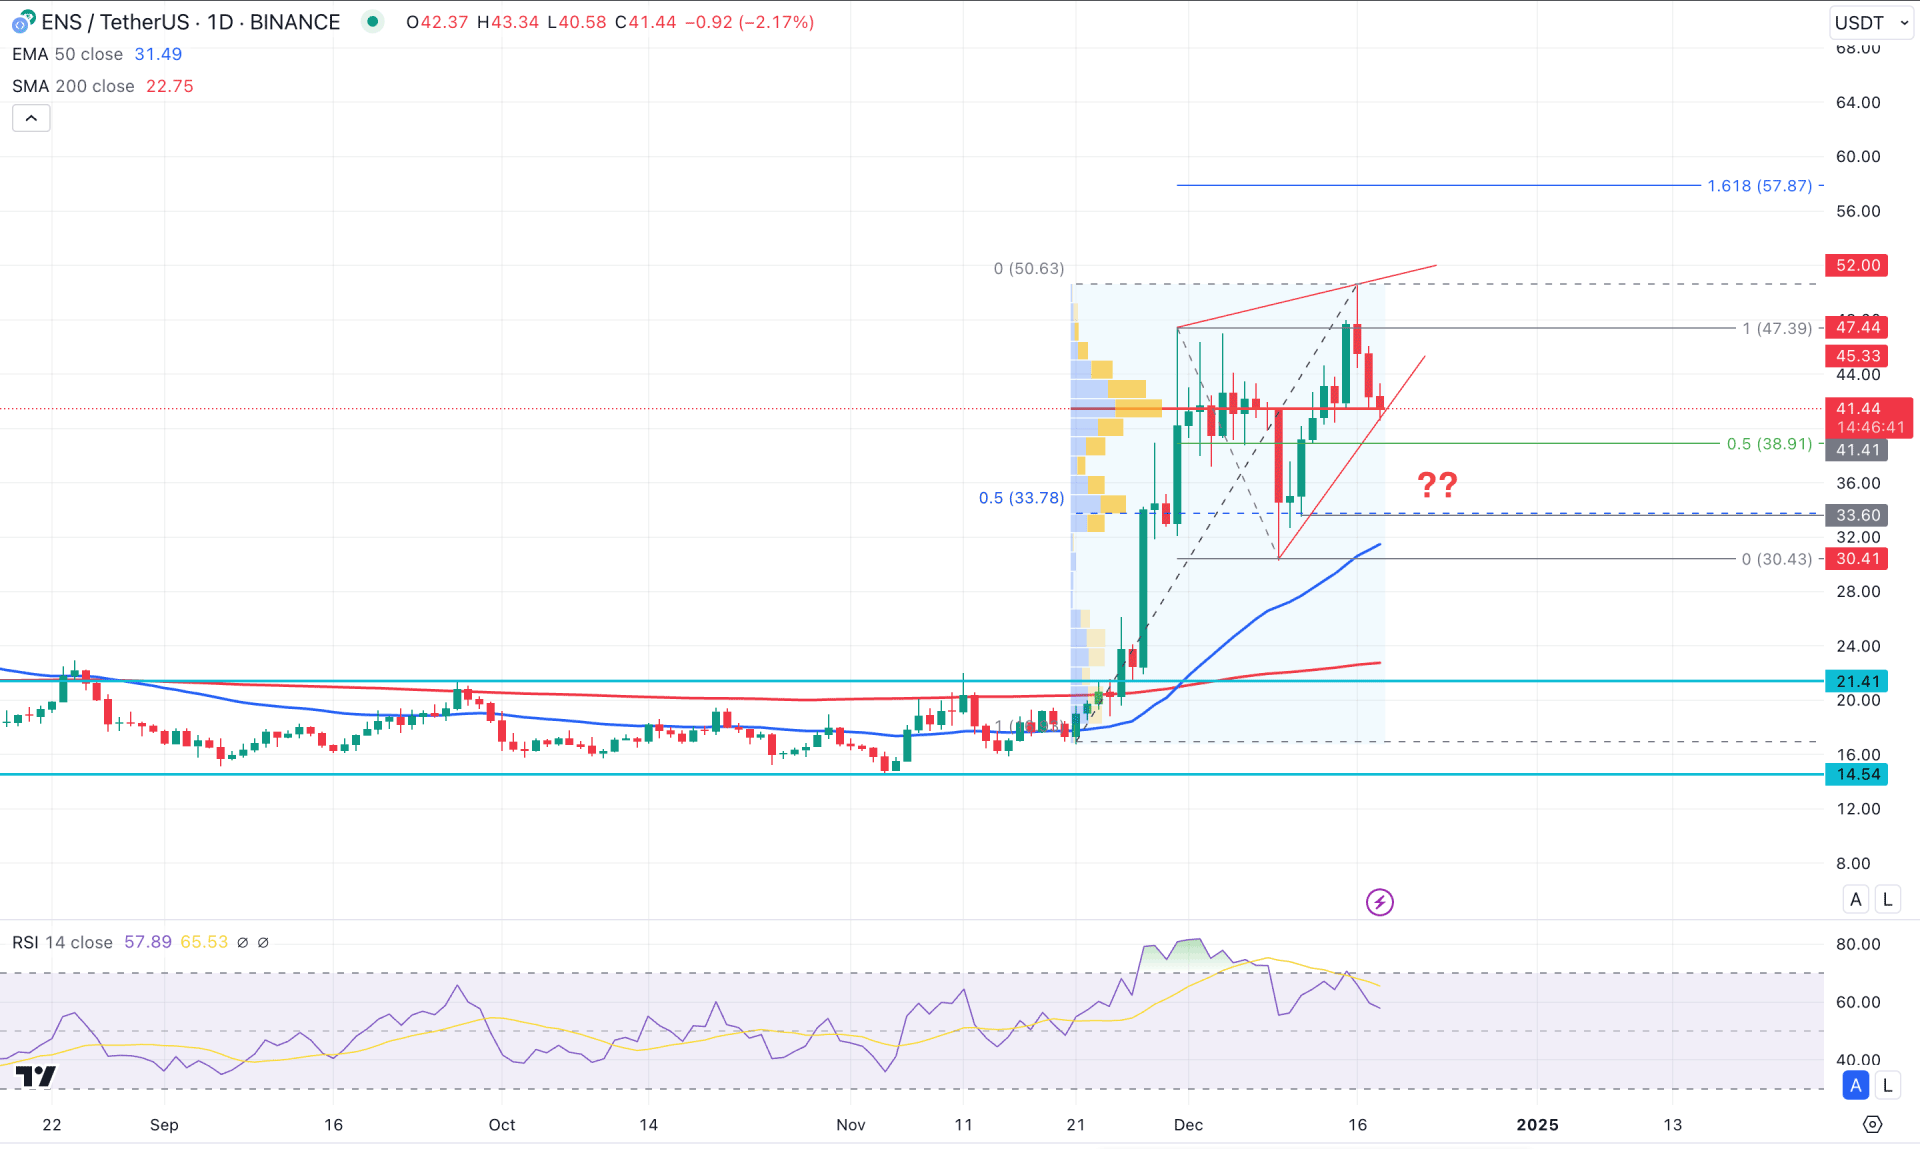
In the daily chart of ENS/USDT, the recent price showed impressive bullish pressure, taking the price to the 3-year high. However, the volatility at the record high level raised the question of whether the bulls can hold the momentum.
In the higher timeframe, the current price trades bearish after setting a top above the November 2024 high. Instead of extending the four-month gain, the price showed an immediate rejection. In that case, investors should monitor how the price trades in the current area, as valid selling pressure below the November opening price could be a challenging factor for bulls.
The bullish momentum in the volume structure is still bullish. The latest high volume line since November 2024 is at the 41.41 level, which is closer to the current price.
In the major structure, the 200-day Simple Moving Average is way below the current price, working as a major support line. Moreover, a bullish crossover is visible, where the 50-day EMA crosses over the 200 MA, forming a golden cross. However, the recent price pattern looks sideways as a Rising Wedge pattern follows, which might limit the buying pressure after a valid break.
In the secondary window, the Relative Strength Index failed to maintain the position above the overbought 70.00 line. It is a sign that the extreme buying pressure might have found a ceiling and can trigger the bearish reversal.
Looking at the daily outlook of ENS/USDT, the primary signal of a bearish reversal is visible, followed by the Divergence with the main price swing.
Based on this outlook, valid selling pressure below the Wedge support could be a potential short opportunity, aiming for the 30.41 level. However, breaking below the 31.41 low could signal a test of the price inefficiency zone, from which a bullish reversal is possible.
On the bullish side, the price might extend the bullish pressure after forming a valid bottom. In that case, overcoming the 47.39 level would be a remarkable achievement for this pair, which could extend the buying pressure to the 74.84 Fibonacci Extension level.

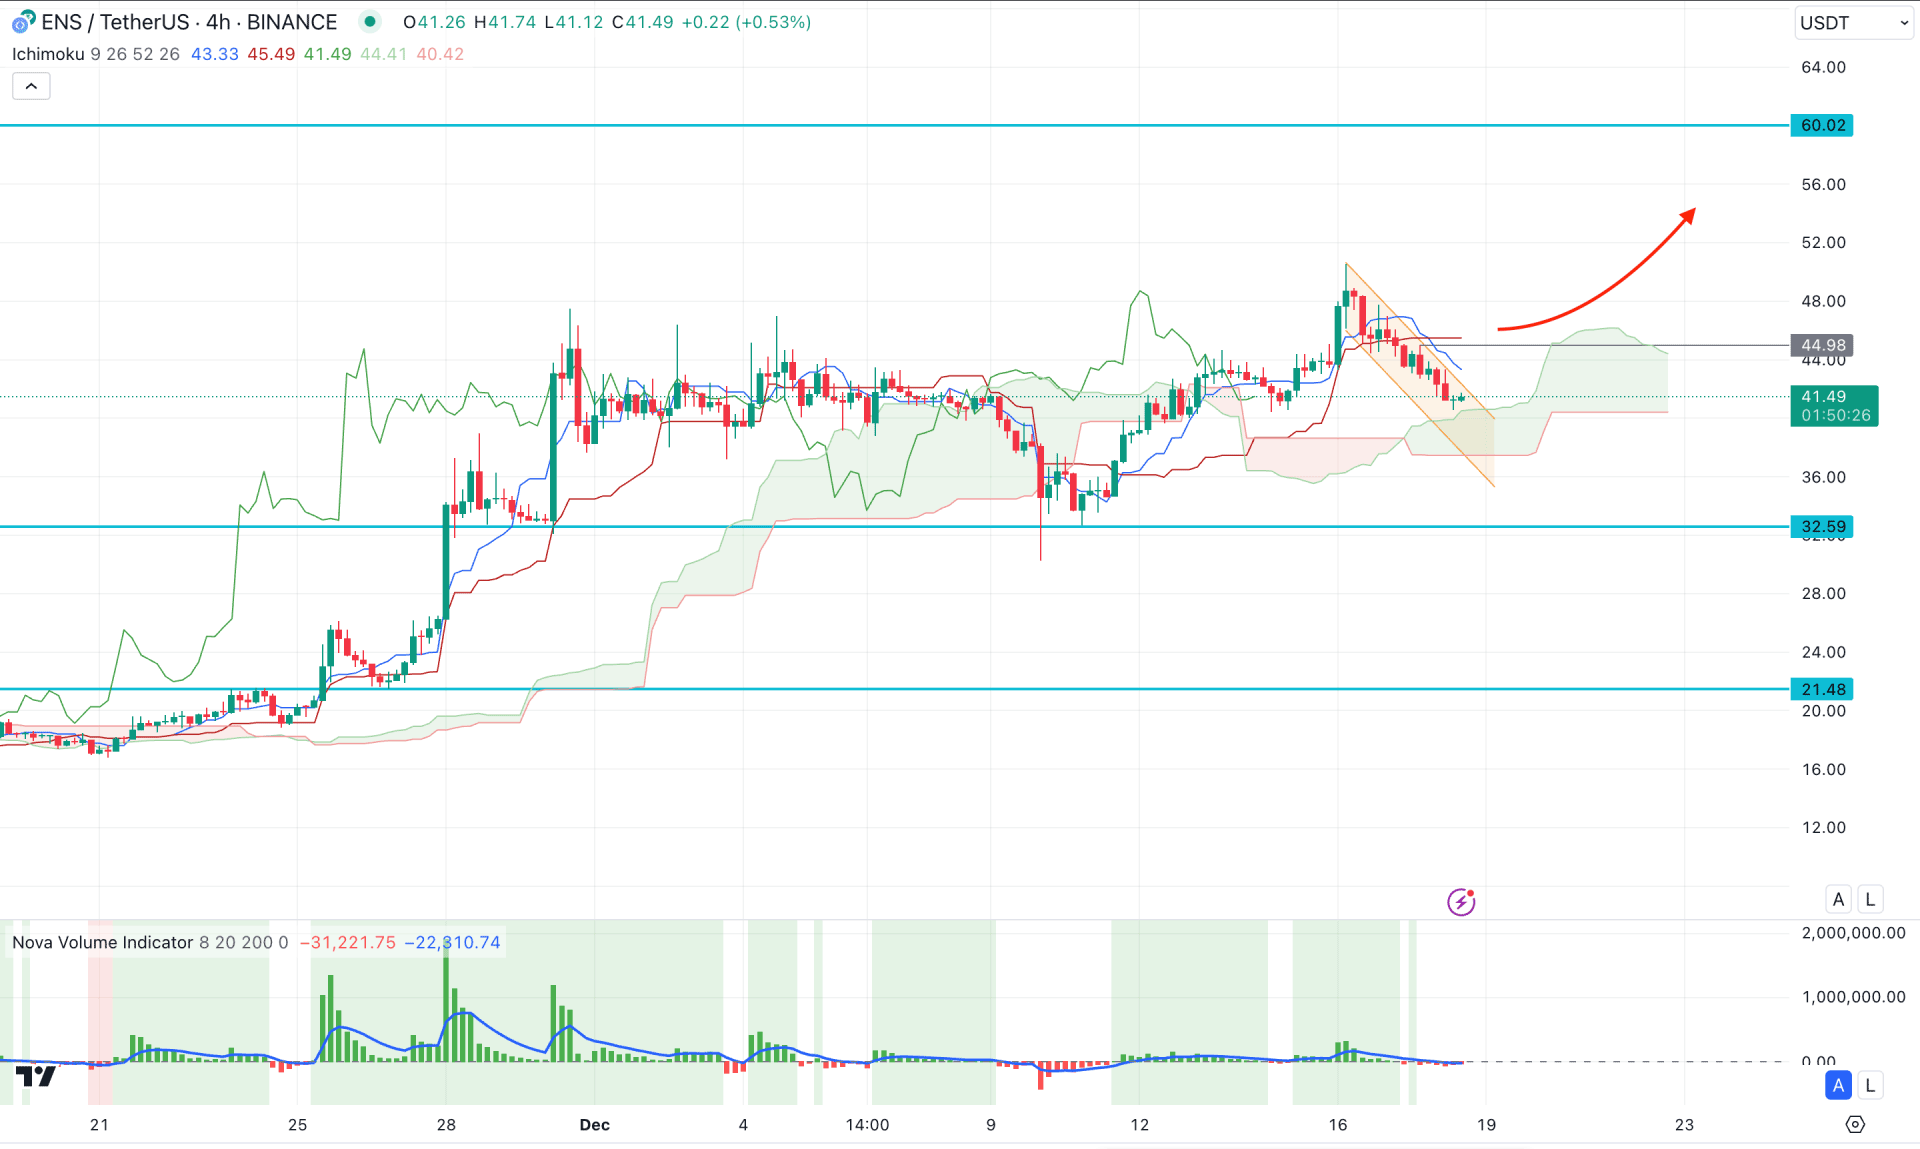
In the H4 timeframe, the price is trading sideways, within a descending channel. However, the major market structure remains bullish as the Ichimoku Cloud zone is still below the current price.
The Future Cloud shows the same story, where the Senkou Span B remains flat below the Senkou Span A.
In the indicator window, the volume histogram represents a sideways market where the recent vertical line remains closer to the neutral zone.
Based on this structure, a bullish rebound with a channel breakout could signal a trend continuation, aiming for the 60.00 line. Also, overcoming the 50.00 swing high might extend the gain toward the 65.00 area.
On the bearish side, a break below the Ichimoku Cloud zone could lower the price toward the 21.48 support level.

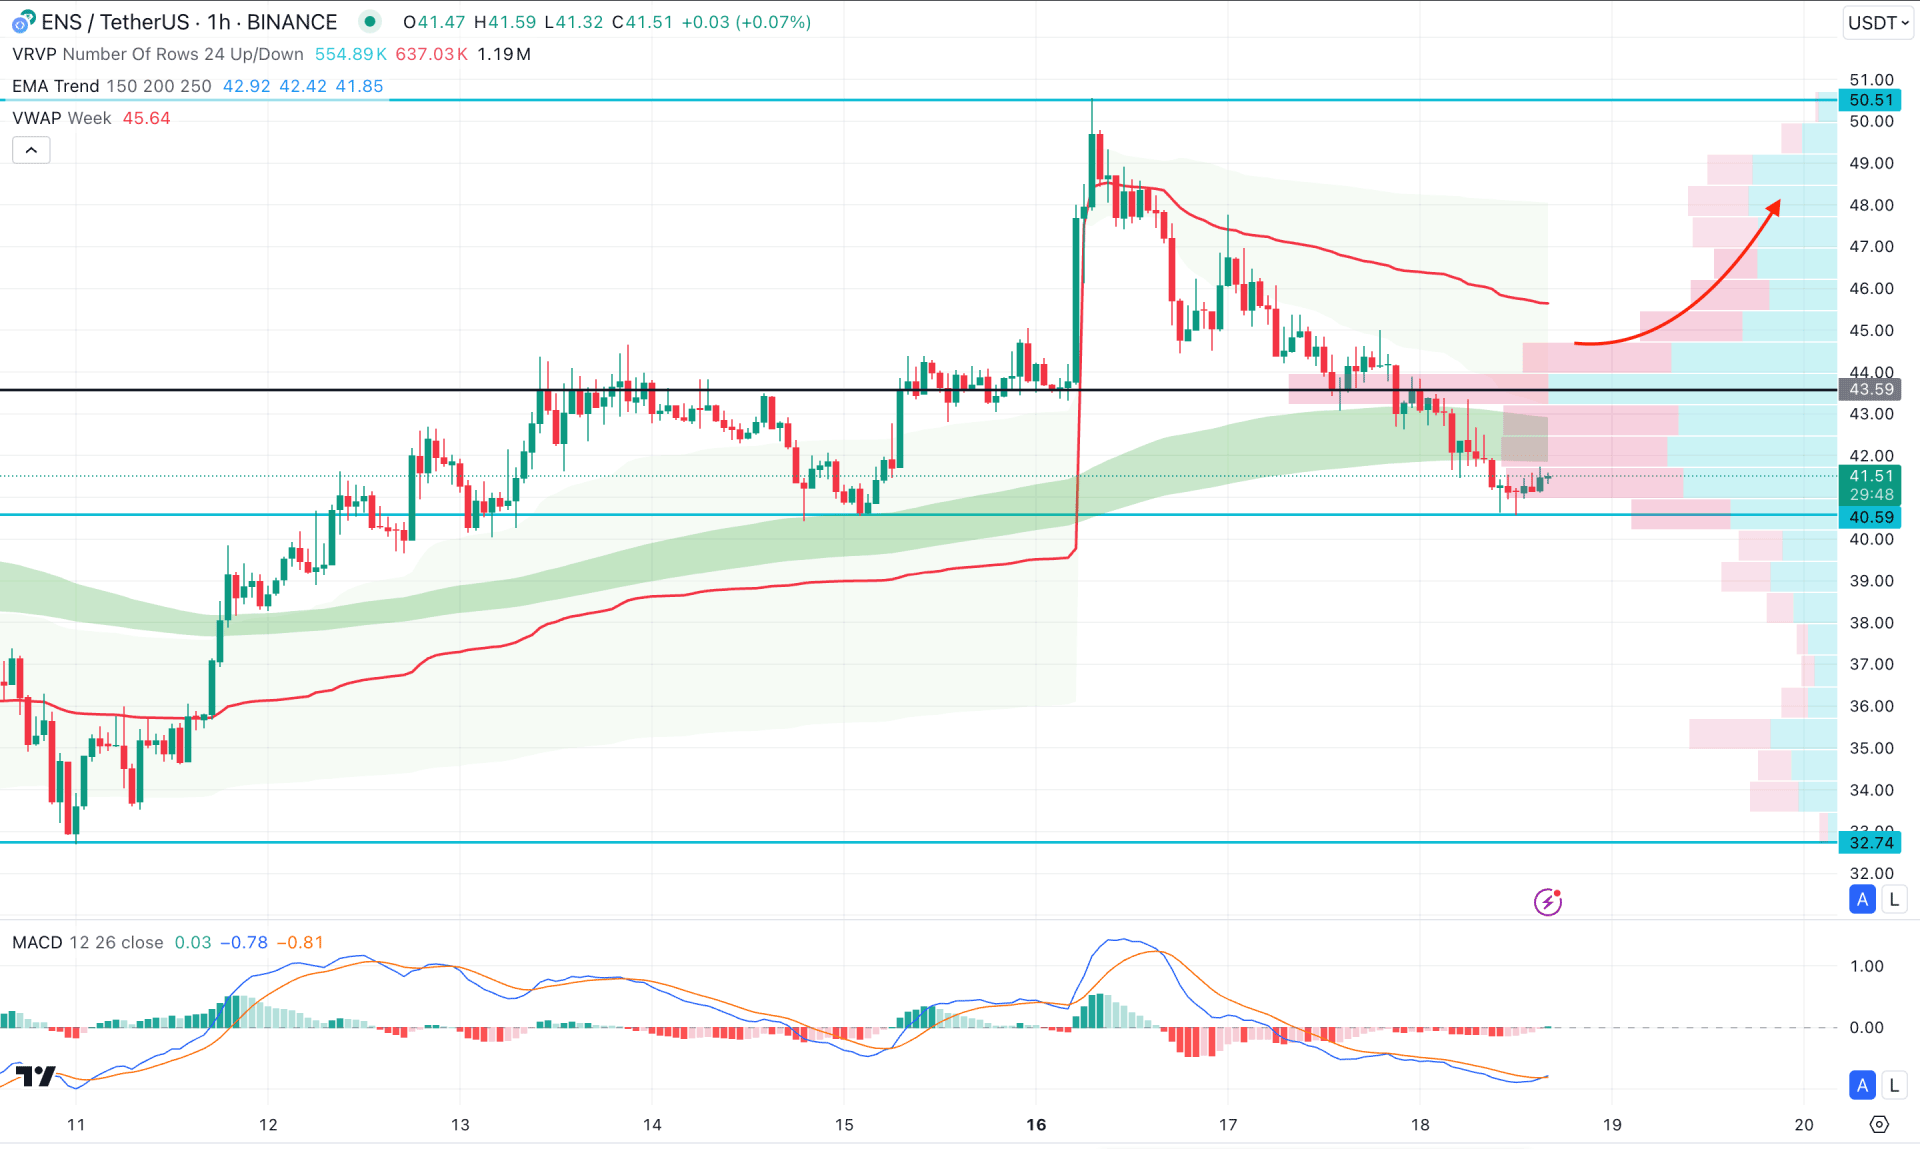
In the hourly chart of ENS/USDT, the recent price showed extensive selling pressure below the visible range high volume line. Moreover, the bearish break is visible below the Moving Average Wave. As the current price is hovering below these crucial dynamic lines, we may expect a downside continuation with a valid price action.
On the other hand, the signal line in the MACD Histogram formed a bottom and showed a bullish recovery from the record-low level. Also, the Histogram flipped its position to the bullish side after consecutive 47 hours.
Based on this outlook, a valid bullish pressure above the 43.59 high volume line could signal a high probability of a long opportunity, aiming for the 50.00 level.
On the other hand, a failure to overcome the MA wave could resume the current trend toward the 36.00 level.
Based on the current market outlook, ENS/USDT is more likely to increase its selling pressure after validating the rising wedge pattern. Investors should closely monitor how the price trades at the intraday chart, as a valid bearish reversal from the near-term resistance could provide an early short opportunity.