Published: December 22nd, 2021
Elrond (EGLD) is a unique blockchain protocol that offers a speedy transaction through its sharding. This project itself is a technology ecosystem that combines fintech, DeFi, and other internet things. Currently, the Elrond ecosystem is capable of 15,000 transactions per second, where the transaction cost is as low as $0.001.
The native token of Elrond is eGold or EGLD that went live in July 2020 and currently holds a position within the top 50 cryptocurrencies in the Coinmarketcap rankings. According to the Elrond whitepaper, the primary aim of EGLD is to build an ecosystem and a store of value.
Currently, this network allows developers to build smart contracts through this ecosystem by paying only 30% as a network fee. There are 19,905,867.06 EGLD in circulation against 22,917,199 EGLD as a total supply. The current market capitalization is at $4,914,364,813 where the last 24 hours trading volume was $124,507,120.
Let’s see the upcoming price direction from the EGLD/USDT technical analysis:
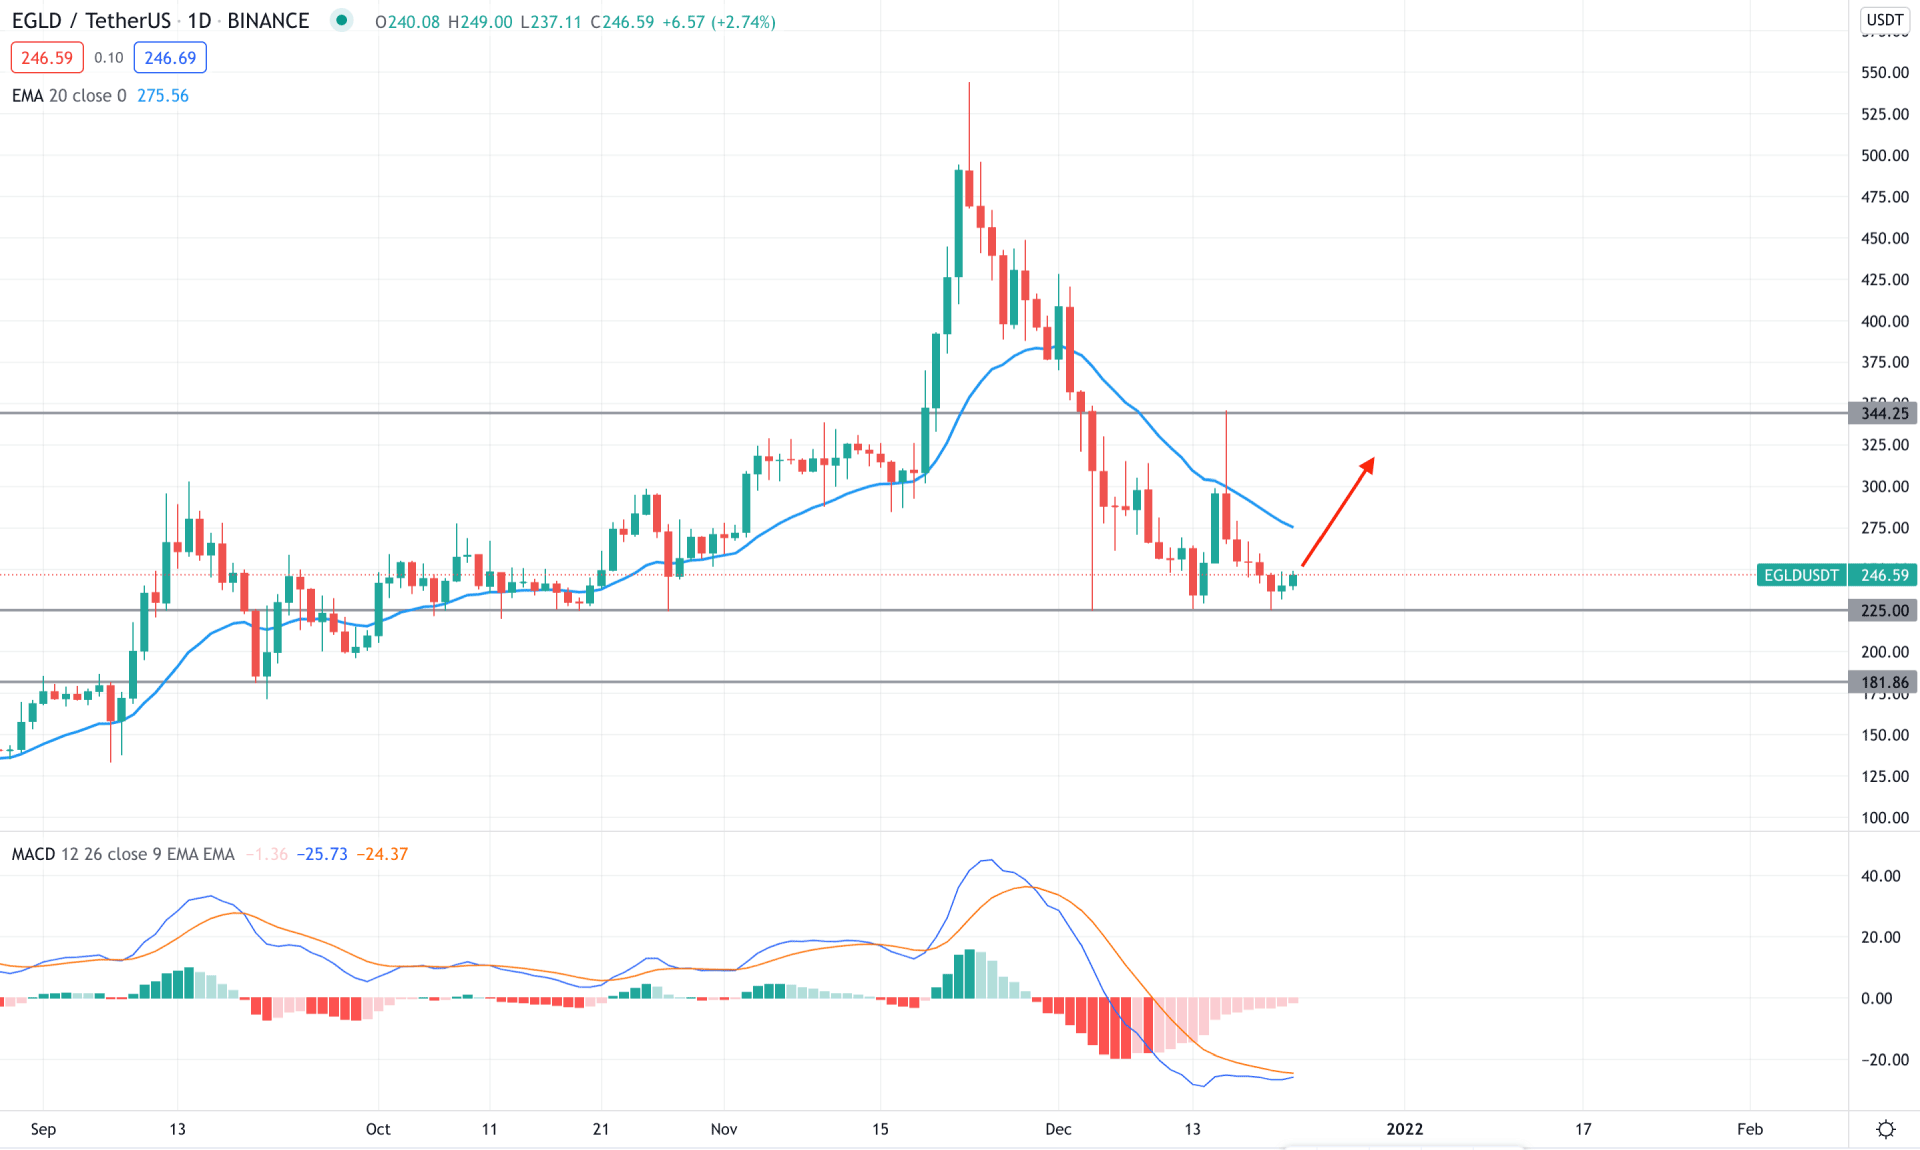
EGLD/USDT is moving within a broader bulls trend where the price has made consecutive higher highs since the beginning of 2021. Moreover, the buying pressure became aggressive in mid-November where the price moved up with impulsive pressure from the dynamic support level and made an all-time high at 544.25 and rebounded immediately. However, the bullish break of structure is a sign that bulls may regain momentum at any time with another push upside.
The above image shows that the MACD Histogram is bearish where bears are losing momentum. Therefore, if the Histogram moves to the positive zone with bullish price action, it may indicate a possible buying opportunity in this pair. Meanwhile, the dynamic 20 EMA is above the price, which is the primary barrier for bulls.
Based on the daily context, the price has faced a triple bottom pattern at the 225.00 support level with a bullish rejection candlestick. Therefore, a bullish daily candle above the dynamic 20 EMA with a positive MACD Histogram would increase the buying pressure in this pair. On the other hand, a break below the 225.00 level would open another buying opportunity from the 181.86 area.
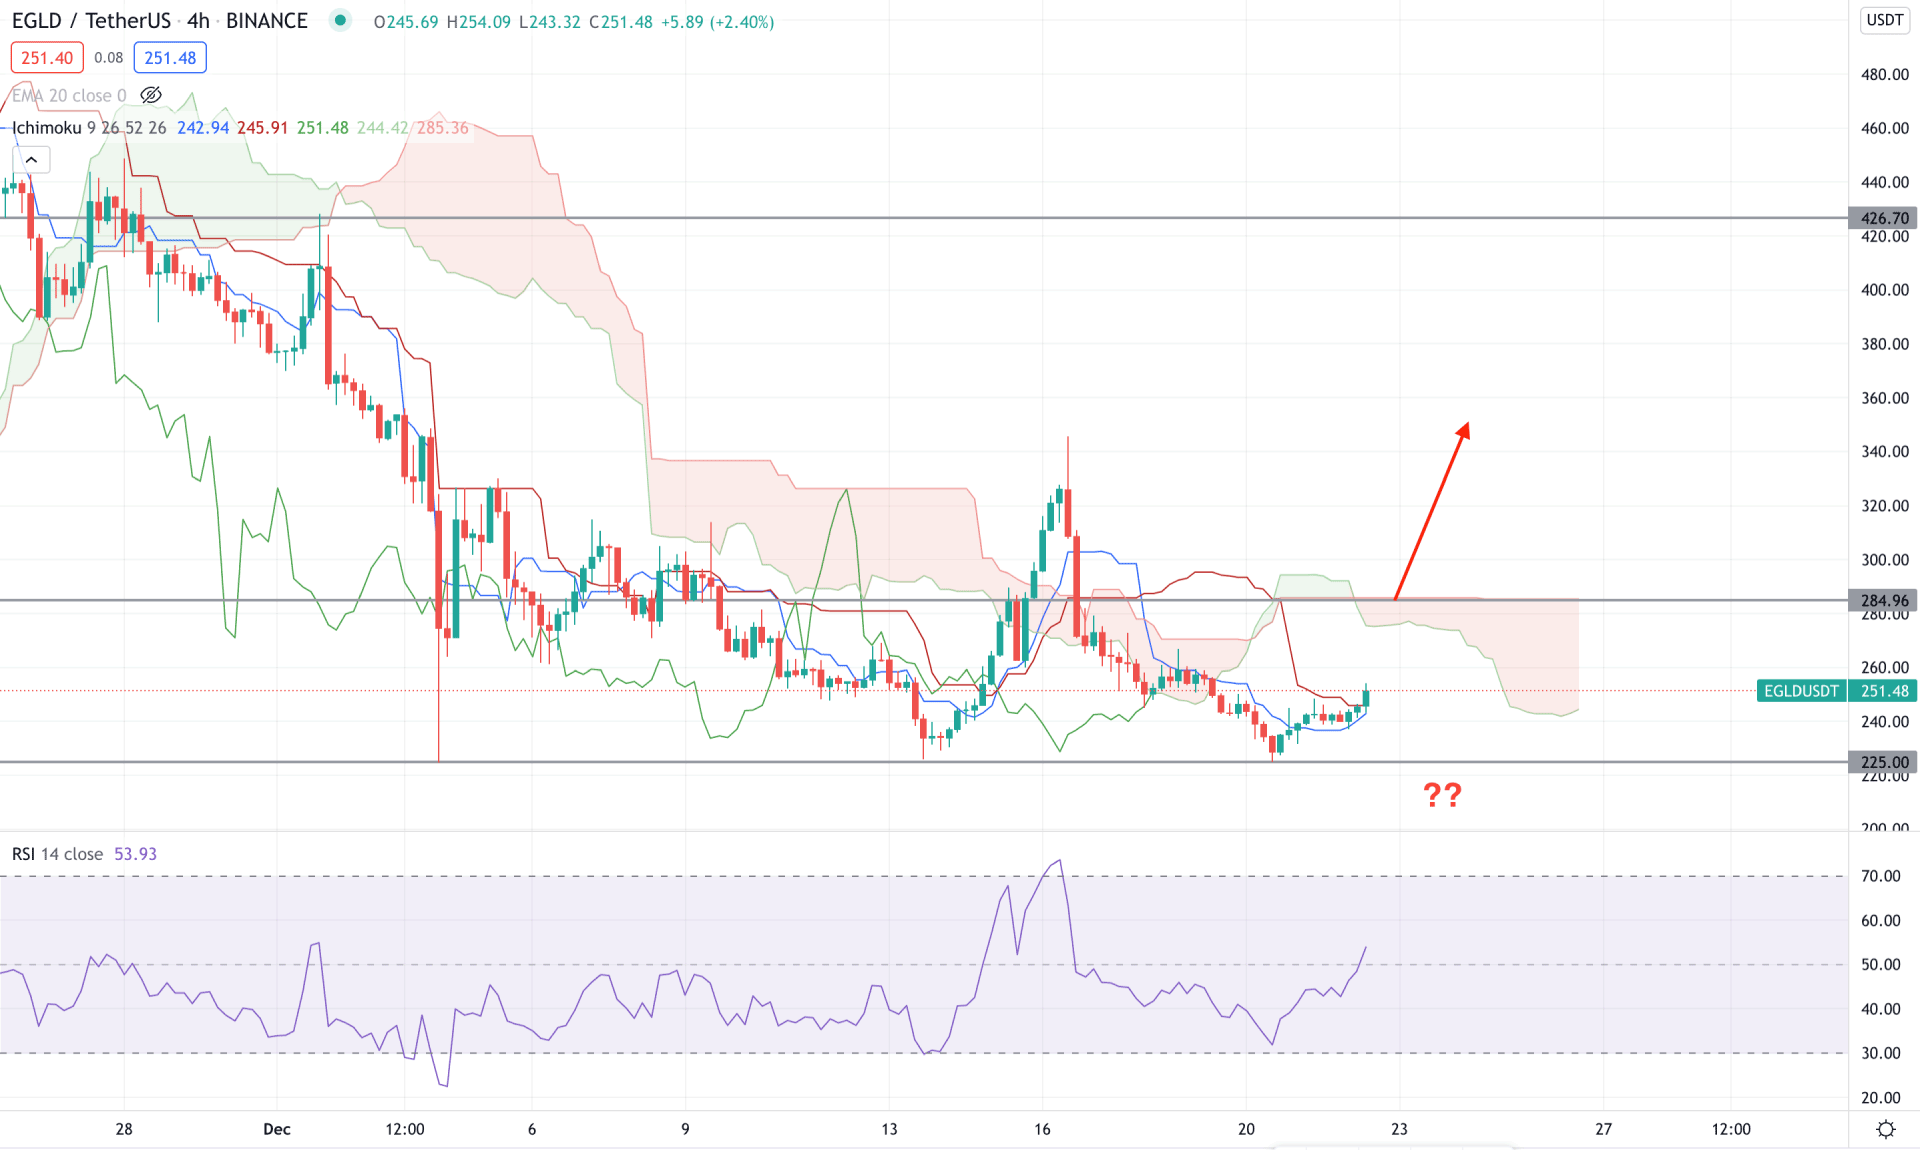
According to the Ichimoku Cloud, EGLD/USD H4 chart is trading within a bearish momentum where the current price is below the Cloud resistance. Moreover, the future cloud is bearish where the Senkou Span A shows an upside pressure while the Senkou Span B is flat at the 285.00 static level. Furthermore, the price moved above the dynamic Tenkan Sen and Kijun Sen and aimed higher towards the cloud resistance.
The above image shows that the RSI is bullish as it rebounded from the oversold 30 level and is currently above the 50. Now bulls should closely monitor how the price reacts on the 285.00 area. Any bullish H4 close above the 285.00 level would be a potential buying opportunity in this pair towards the target of 426.70 swing high.
On the bearish side, a break below the dynamic Kijun Sen and static 225.00 is needed to see the price at 200.00 or 180.00 area.
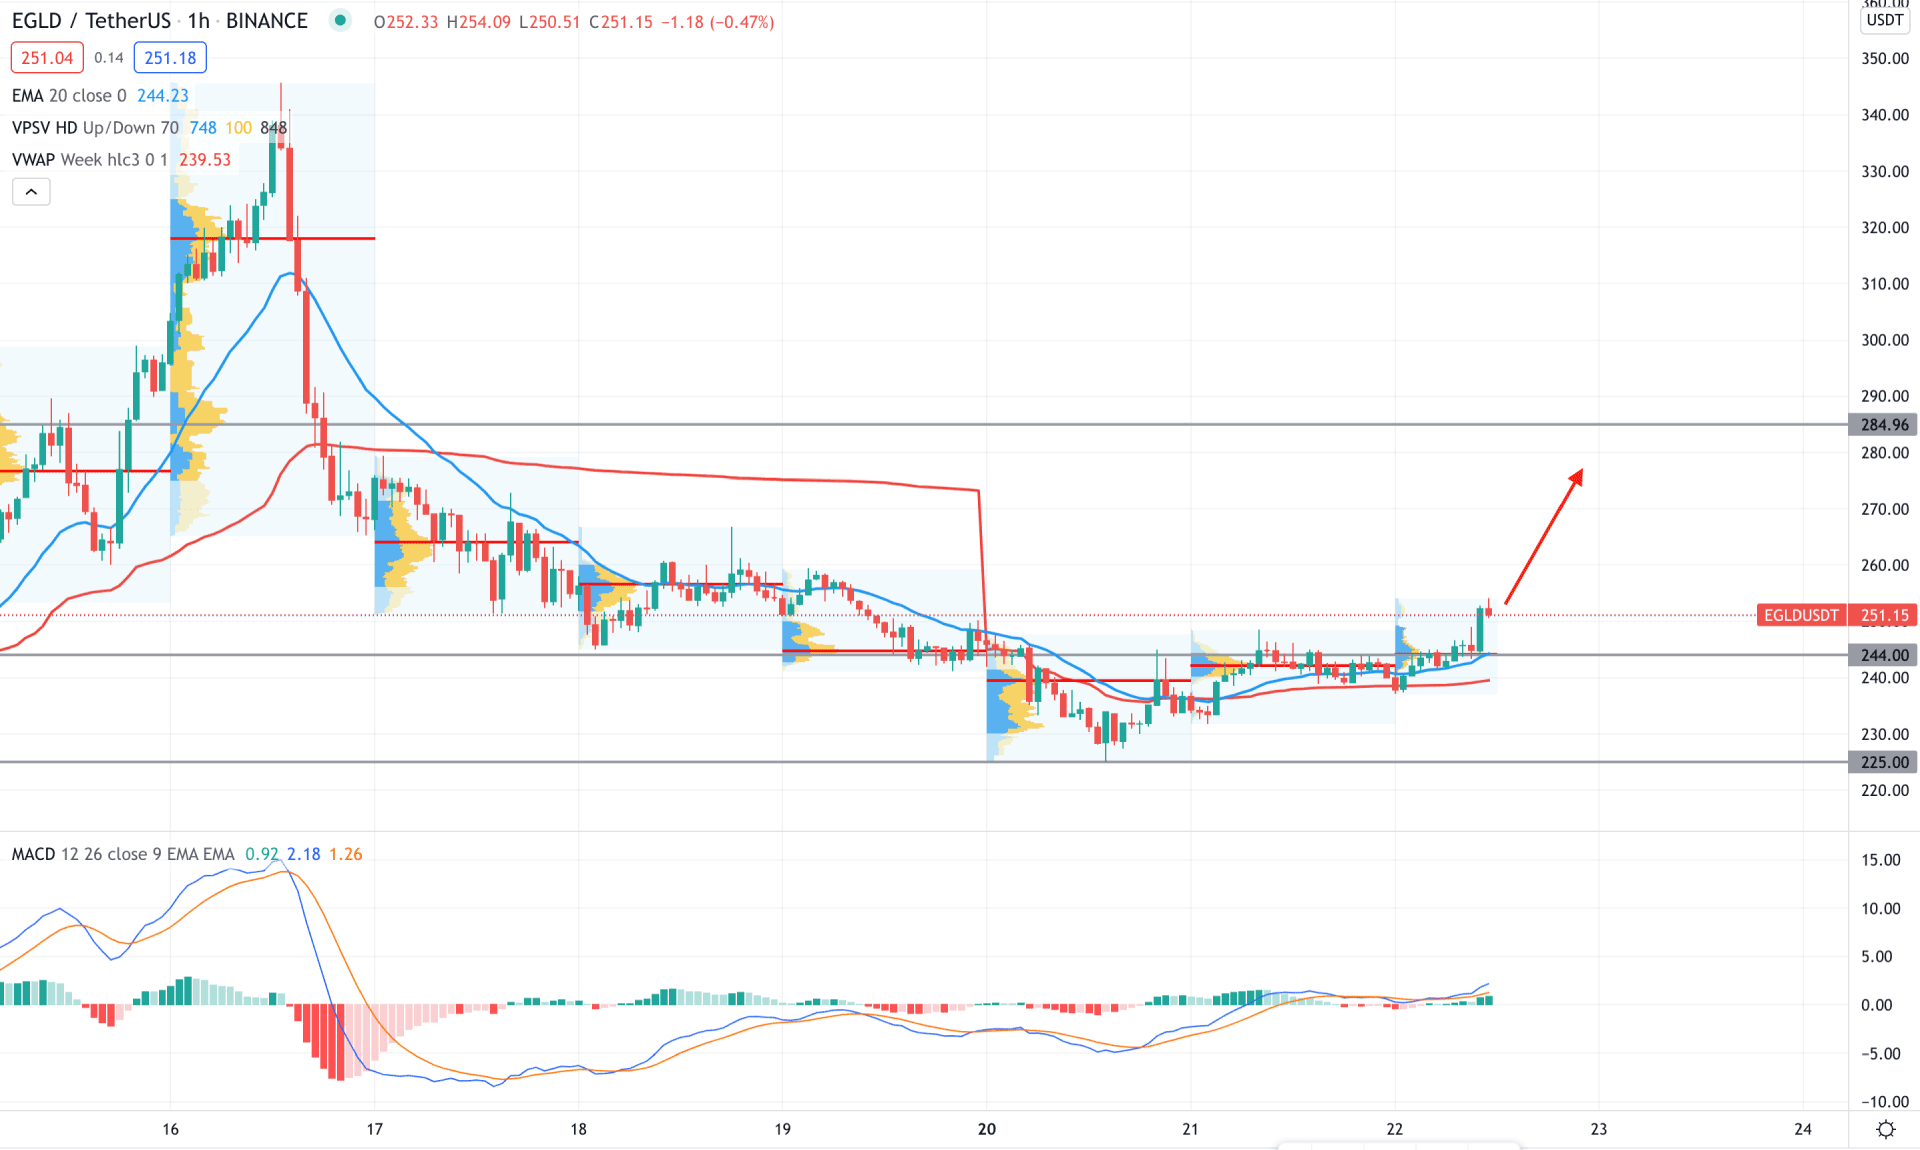
In the EGLD/USDT intraday chart, the price shows buying pressure as the most recent price moved above the 244.00 static level with a bullish H1 close. Moreover, the most recent high volume level is below the price, indicating that the intraday buying pressure has an institutional interest.
The above image shows how the price reverses the selling pressure from the 225.00 support level and moves above dynamic 20 EMA and weekly VWAP. Meanwhile, the MACD Histogram is bullish and aiming higher, indicating buyers’ presence in the price.
Based on the H1 context, the current buying pressure may extend towards the 285.00 area as long as it trades above the 244.00 area. On the other hand, bears should wait for the price to close below the dynamic VWAP with a bearish H1 close.
In that case, the selling pressure may extend towards the 225.00 area.
As of the current observation, EGLD has a higher possibility of moving up by extending the current bullish trend. In that case, a bullish D1 candle above the dynamic 20 EMA would increase the buying pressure towards the current all-time high area. On the other hand, a break below the 225.00 level needs an HODLing approach to see a profit in the chart.


