
Published: March 23rd, 2023
Eli Lilly is a pharmaceutical company specializing in developing medicines for medical illnesses such as diabetes, obesity, Alzheimer's disease and Covid-19. The firm uses wholesale distributors and marketing relationships with other pharmaceutical companies to distribute its drugs globally.
Eli Lilly stock increased by 31% in 2022, an extraordinary recovery from 2022. The successful launch of Mounjaro, a type 2 diabetic medicine, and the growth of other drugs, such as Verzenio, Trulicity, and Emgality, can be credited to this increase.
In the latest earnings report, revenue increased by 7% in constant currency, while earnings per share improved by 12% in non-GAAP terms. Moreover, analysts expect Eli Lilly's good momentum to continue, which includes the forthcoming introduction of four new medications and a significant indication for Mounjaro.
CEO of Eli Lilly stated that the company's product portfolio can provide "top-tier, volume-driven revenue growth" through 2030. In 2023, the firm anticipates sales of $30.3 to $30.8 billion and non-GAAP profits per share of $8.10 to $8.30, representing increases over the estimated year-end 2022 results.
In addition to its strong financial success, Eli Lilly provides a dividend yield of about 1%. Shareholders have enjoyed dividend gains for the previous eight years, and the company's three-year annualized dividend growth is approximately 15%.
Should you invest in Eli Lilly & Company stock (LLY)? Let’s see the upcoming pride direction from Eli Lilly & Company stock (LLY) technical analysis:
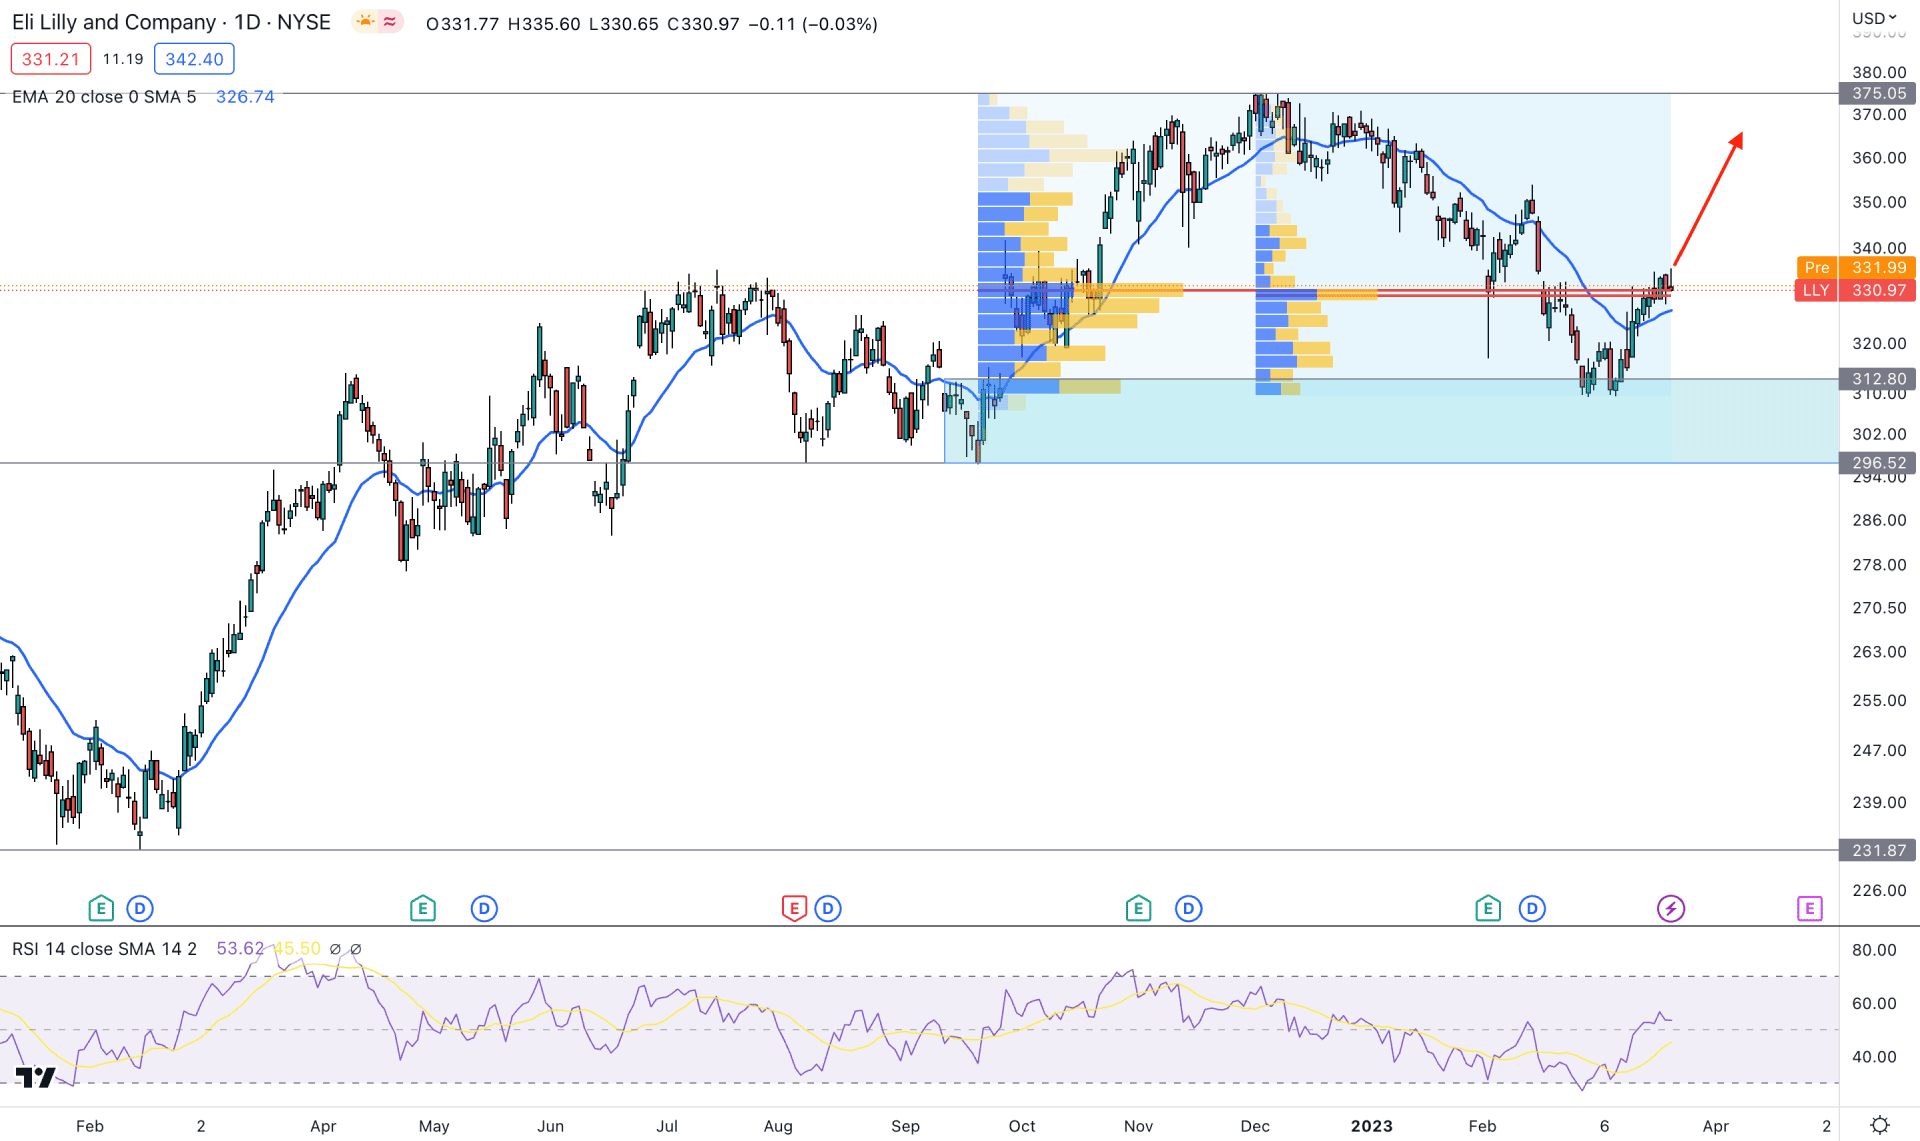
Despite a sharp bearish monthly close in February, LLY stock showed an immediate recovery from the March opening price, and still, there is no possibility of selling pressure.
The daily price supports the buying momentum as it is aiming higher by creating consecutive higher highs. The interesting fact is the latest high volume level, which is offering a stable bullish opportunity.
Excessive traders’ activity is visible from the 329.00 to 330.00 level, as shown in the image above. Since September 2022, this level has been shown as a high-volume area, and there has been no significant selling pressure after that. It is a sign that bulls control this level, while the broader market outlook is bullish from the existing trend. In that case, a bullish recovery, with a stable buying pressure above this level, would be a strong bullish signal for the LLY stock.
The dynamic 20-day Exponential Moving Average is at the bottom, but it needs another swing high above the 335.62 level before considering it valid dynamic support. Moreover, the latest bullish break of structure above the July 2022 high with a downside correction made the 312.80 to 296.52 area a valid demand zone. As the current price trades above this zone, any intraday buy setup could offer a long opportunity.
Based on the current price structure, there are two buying possibilities. The first one is a stable bullish momentum above the high volume level. Another one is a deeper correction and a bullish rejection from the 312.80 to 296.52 area.
In both cases, the target price would be the 375.00 level, but a break below the 290.00 level with a bearish daily candle could lower the price toward the 231.00 area.
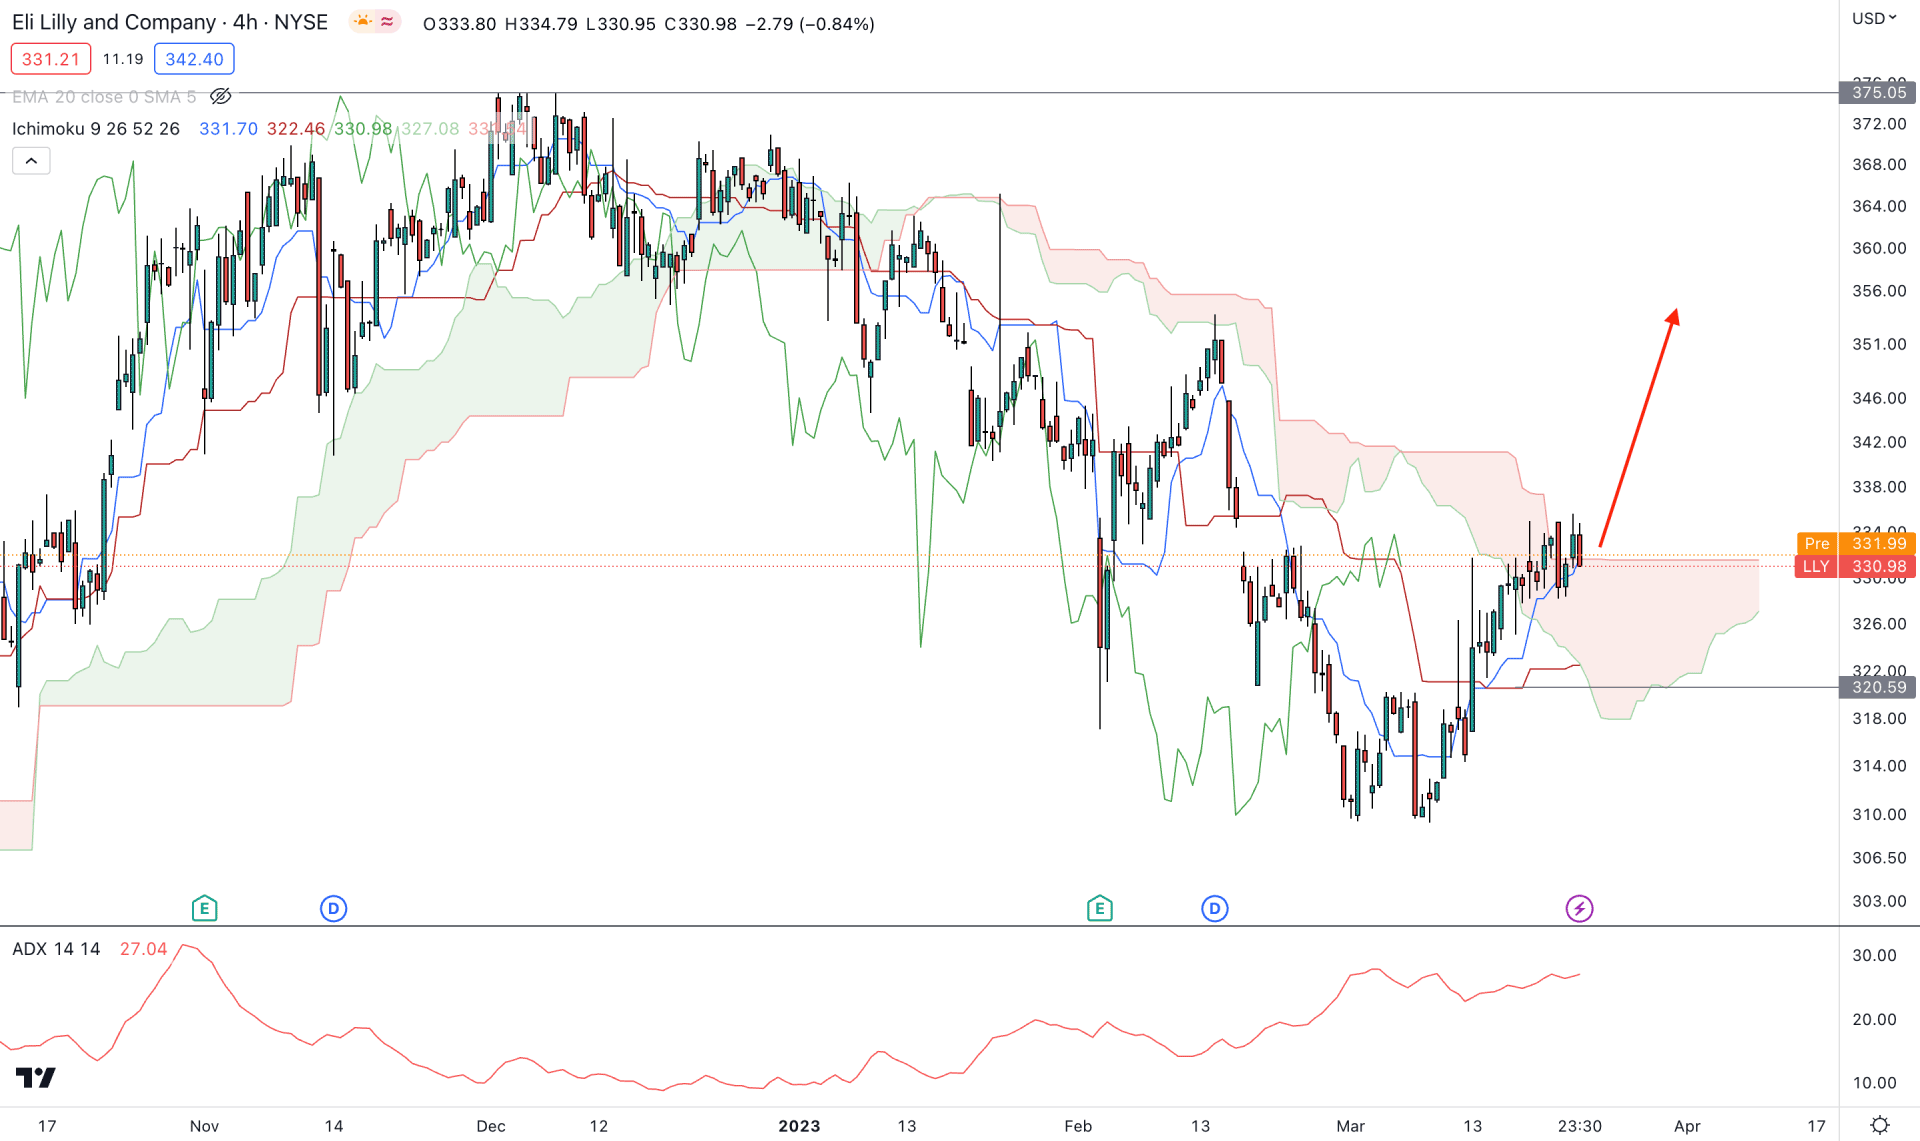
In the H4 timeframe, the current buying pressure is questionable as the price has a barrier from the Ichimoku Kumo Cloud resistance. However, a bullish crossover between Tenkan Sen and Kijun Sen is supported by bulls, but more confirmations are needed before opening a long position.
In the future cloud, the Senkou Span A is still below the Senkou Span B, but the gap between these levels is narrowing. It is an early sign of buyers' accumulation, but a new swing high above the 338.92 level is needed to validate this.
A stable trend is visible from the indicator window, where the current ADX aims higher above the 20.00 level.
Based on the H4 structure, sellers may regain momentum if any bearish H4 candle closes below the 320.59 support level. However, a bullish recovery would be potent if there is any breakout from the current range.
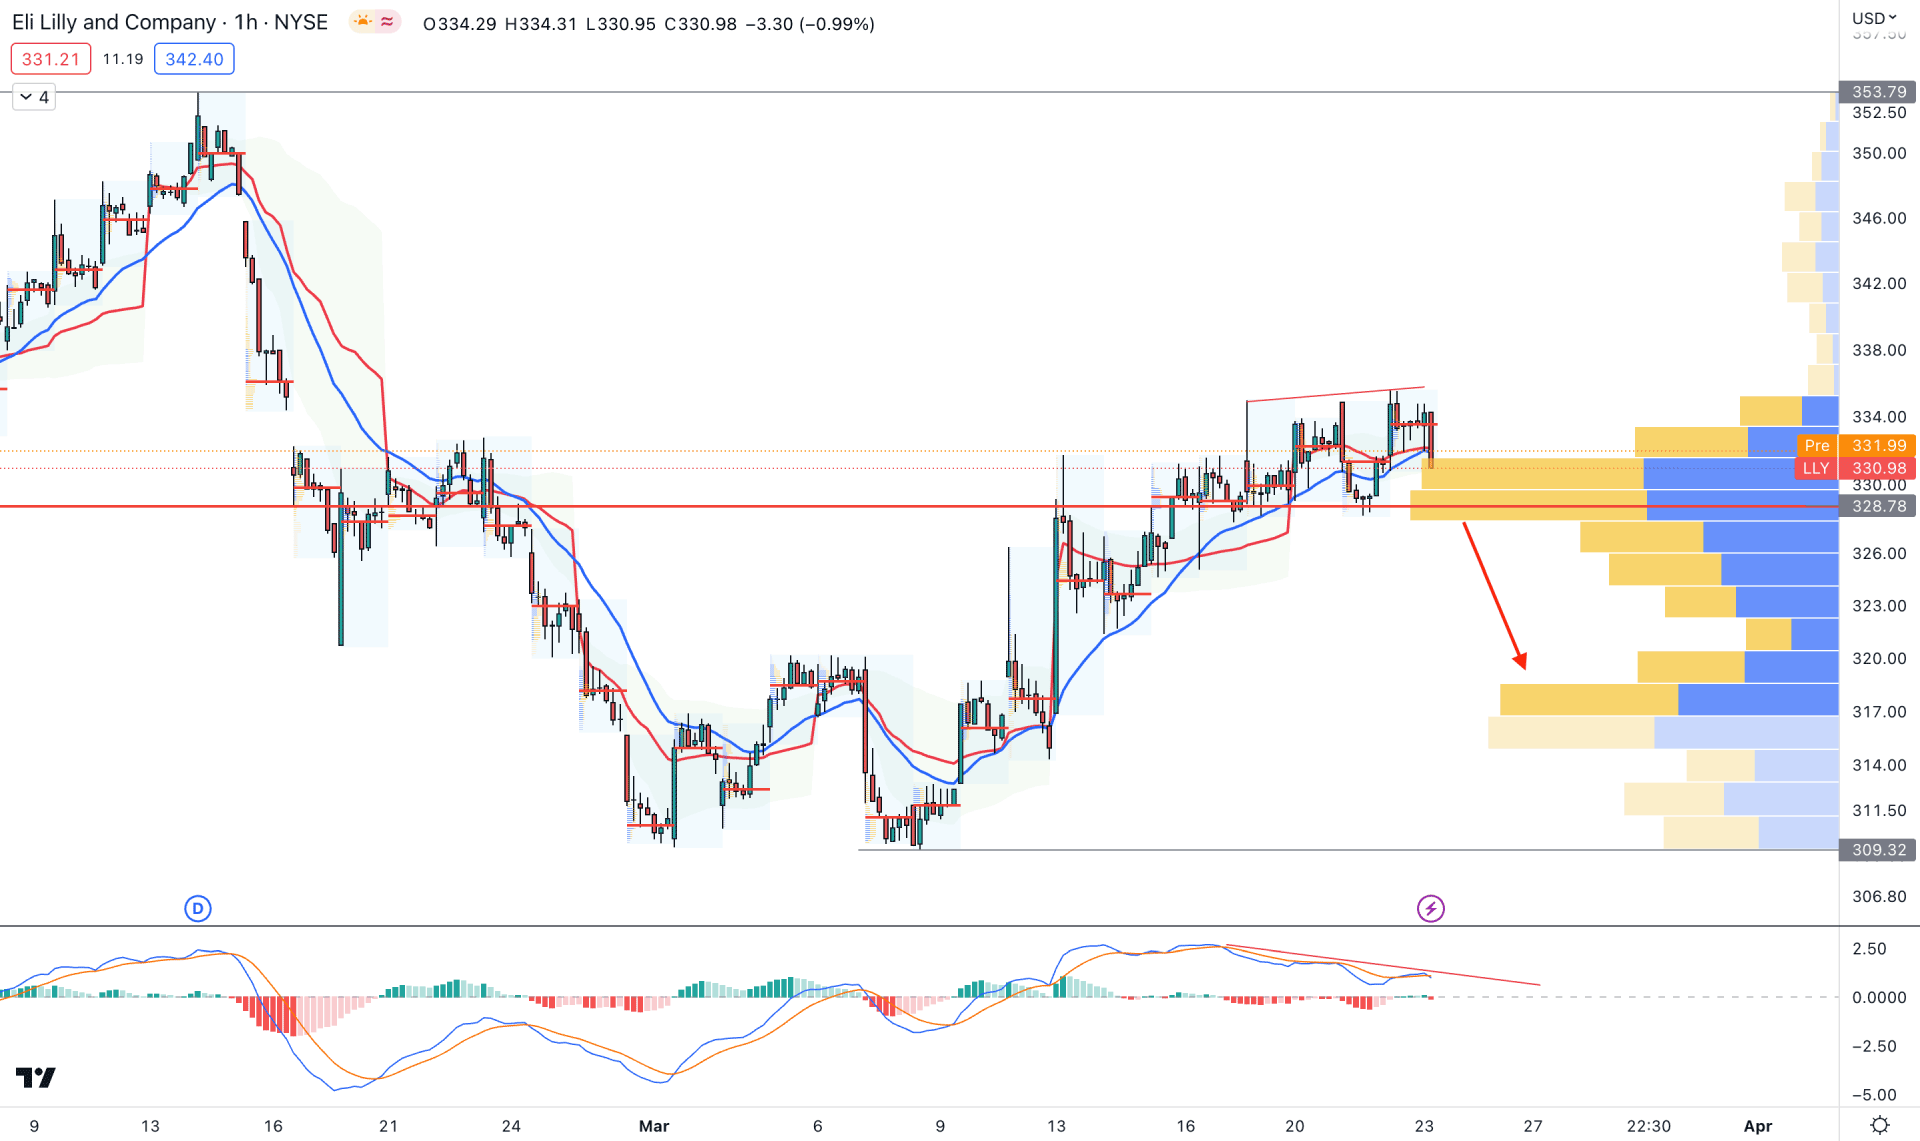
In the AUDUSD hourly chart, the current buying pressure is questionable from the MACD Divergence. Moreover, so significant bullish price action is seen from the visible range high volume level of 328.78.
The price is facing a support from dynamic 20 EMA and weekly VWAP, where a bullish recovery above the 335.54 level is needed before forming a stable bullish trend.
Based on this behavior, we may expect the price to show a rebound and form an H1 candle above the 336.00 level before opening a long position. However, a break below the 328.00 level would lower the price towards the 317.00 area.
Based on the current price outlook, investors should wait for a valid bullish rebound above the daily high volume level before opening a long position. However, the lower timeframe price action shows a downside possibility, where a bearish break below the H4 Cloud zone could lower the price.


