
Published: February 3rd, 2026
On February 4, Eli Lilly will release their fourth-quarter and full-year 2025 profits. Sales and earnings for the fourth quarter are expected to reach $17.87 billion and $6.99 each share, respectively. Over the last 30 days, 2026 earnings expectations have increased to $33.24 from $33.15 per share.
Like the previous few quarters, Lilly's blockbuster GLP-1 medications, the diabetes medication Mounjaro, and the obesity medication Zepbound, were probably the main forces behind the company's top-line growth in the fourth quarter. High demand patterns were largely offset by reduced prices.
Strong revenue growth in the initial three months of 2025 has been attributed to the introduction of Zepbound and Mounjaro in fresh global markets as well as enhanced supply from greater manufacturing in the US. It is anticipated that the fourth quarter will maintain the upward trend.
In addition to Mounjaro and Zepbound, increasing demand and volume expansion for Lilly's major growth medications, such as Olumiant, Taltz, and Verzenio, could be price-driving factors in this quarter.
Although most drug volumes are predicted to have risen, sales of the majority of pharmaceuticals could continue to suffer from reduced realised pricing.
Let's see the further outlook of this stock from the LLY analysis:
On the daily chart of LLY, the broader market momentum remains bullish, supported by rising moving averages. In the near term, price is facing minor resistance from a dynamic trendline, from where a potential bullish recovery remains possible.
Looking at the higher timeframe, the price reached a historic high in January 2026. However, the monthly close turned bearish after testing a key resistance zone, which could limit further bullish continuation. Investors should closely monitor price action above the 983.22 monthly support level, as a failure to hold this area could trigger a broader correction.
From a volume perspective, bullish momentum remains valid. However, an extended downside retracement toward the high-volume node around the 762.30 level is also possible.
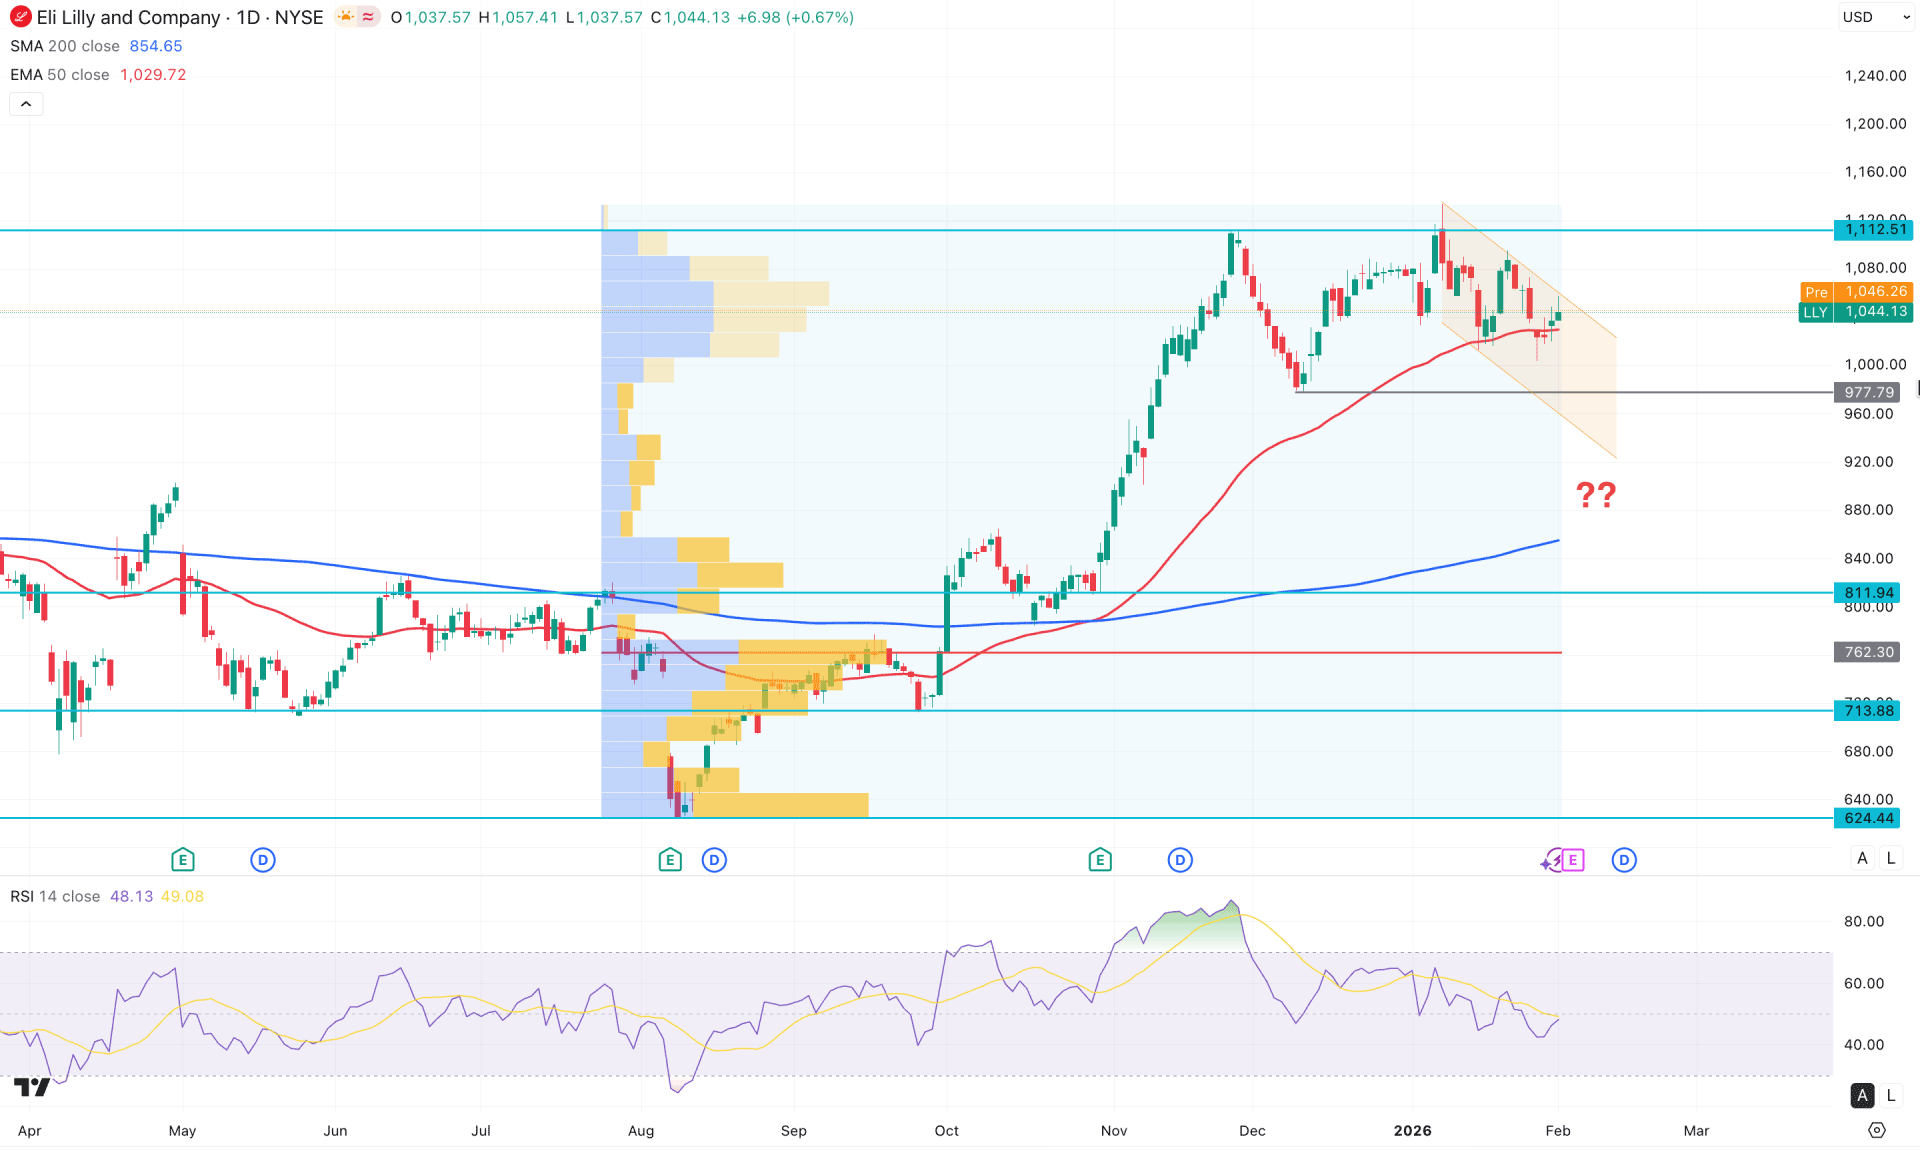
On the main chart, the 50-day Exponential Moving Average is acting as immediate support, with multiple bullish reversal candles visible near this level. However, the price is currently trading sideways within a descending channel, indicating resistance pressure at the upper boundary. The 200-day SMA remains below the current price structure with a bullish slope, while the widening gap between price and the 200-day SMA suggests the potential for a downside mean reversion before the broader bullish trend resumes.
In the secondary indicator window, the Relative Strength Index (RSI) shows elevated momentum but is moving lower toward the 50.00 level from the overbought 70.00 zone.
Based on this structure, the primary expectation for this instrument is a near-term downside correction, despite the broader bullish trend. A failure to break above channel resistance with a daily close above the 1080.00 level could extend the range toward the 977.79 support zone.
On the other hand, sufficient sell-side liquidity is concentrated below the 977.79 level, which may need to be absorbed before bullish momentum resumes. In this scenario, any potential bullish reversal candle emerging from the 960.00–840.00 support zone could present a favorable long opportunity, with the ultimate upside target near the 1112.51 resistance level.
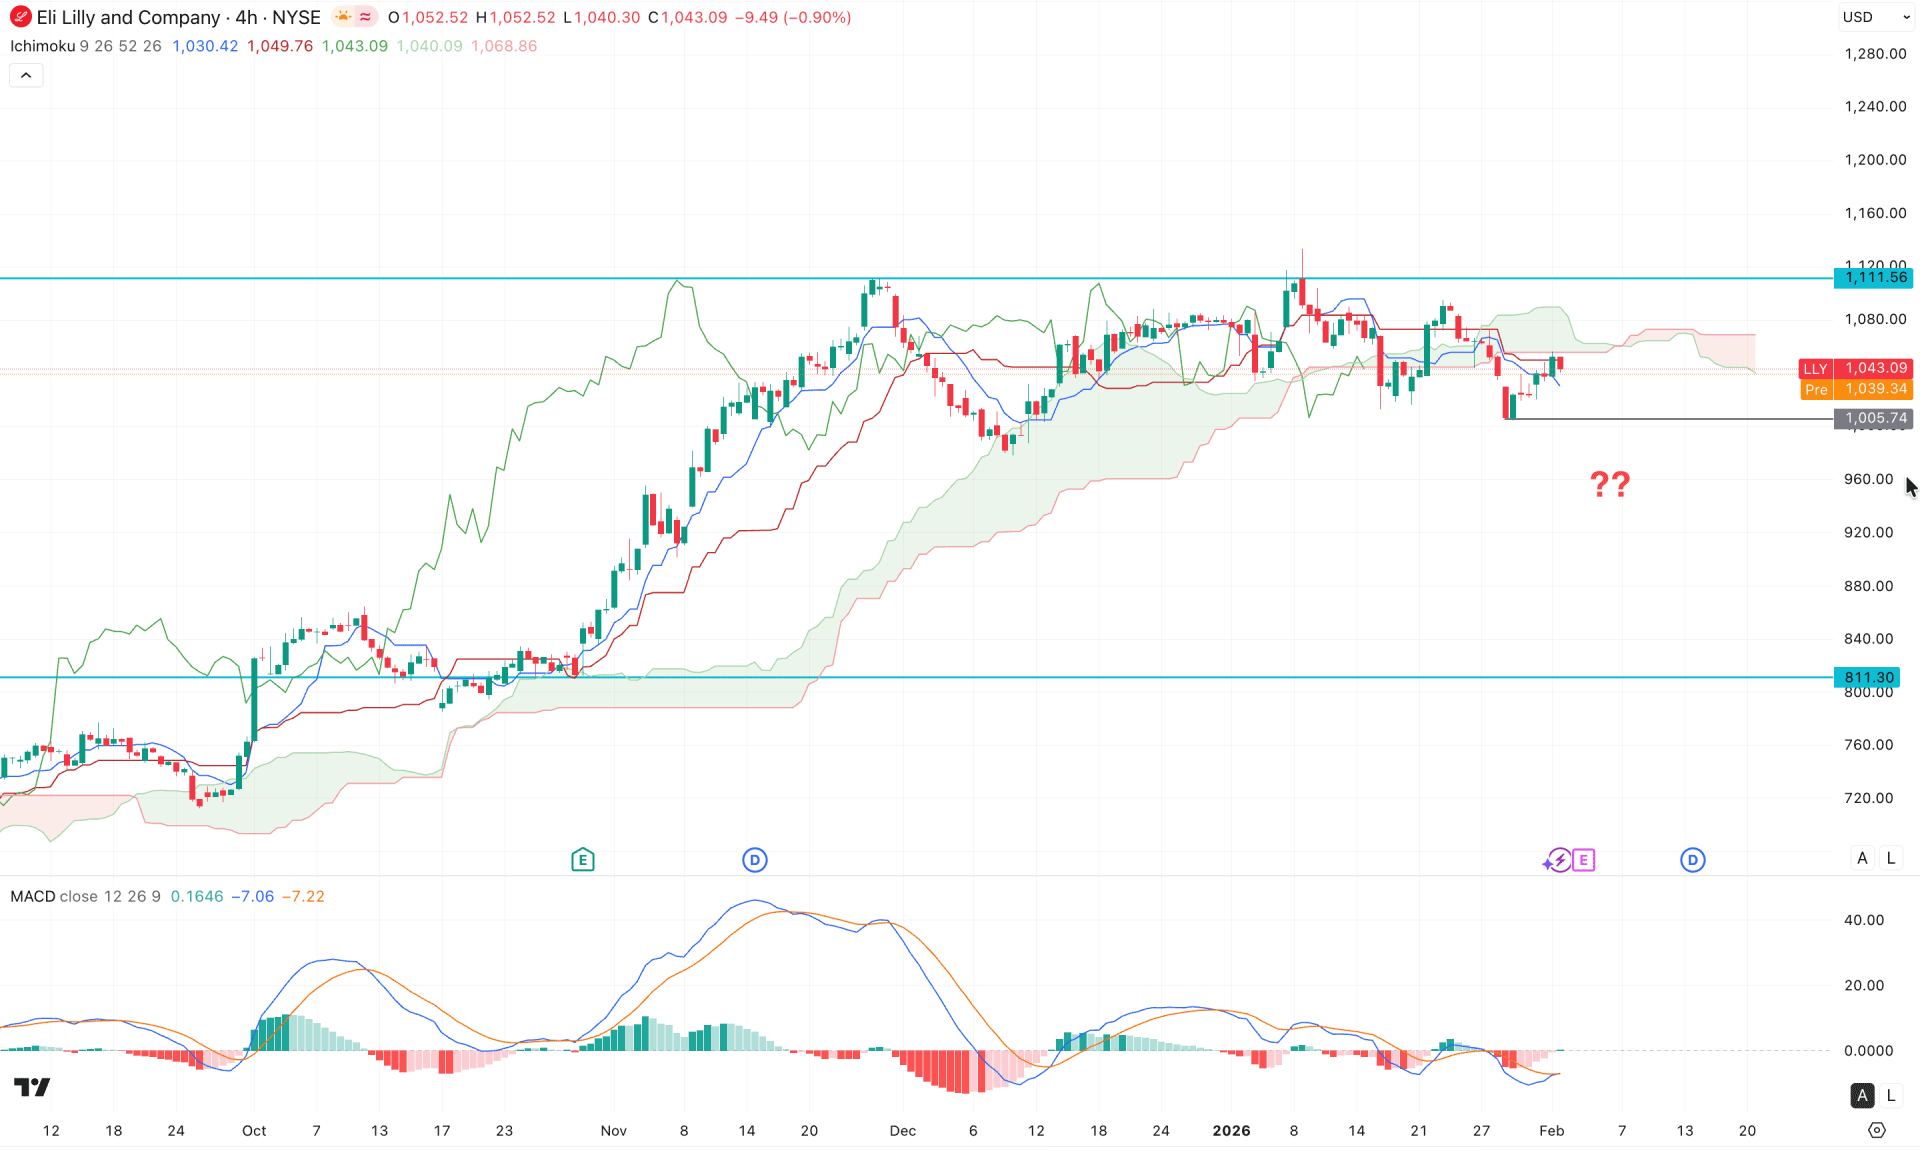
On the H4 timeframe, LLY stock is trading in a sideways range, with multiple violations observed around the cloud area. Looking ahead, the future cloud has a flipped structure, with the Senkou Span A moving below Senkou Span B. Meanwhile, the most recent price action is trading near the key dynamic Kijun Sen level, suggesting market indecision.
In the indicator window, the MACD histogram has flipped above the neutral line, accompanied by a bottom formation in the signal line. This points to an early-stage market reversal, although further confirmation from price action is required before validating a sustainable bottom.
Based on this outlook, a high-probability long opportunity may emerge after a decisive break above the cloud area with a strong H4 close. An aggressive approach would be to look for an H4 candle close above the 1080.00 level, which could increase the probability of a move toward the 1240.00 target.
Conversely, any bearish reversal accompanied by a four-hour close below the 1005.74 support level could drive price toward downside liquidity. In that scenario, a short opportunity may develop, with the ultimate downside target near the 840.00 area.
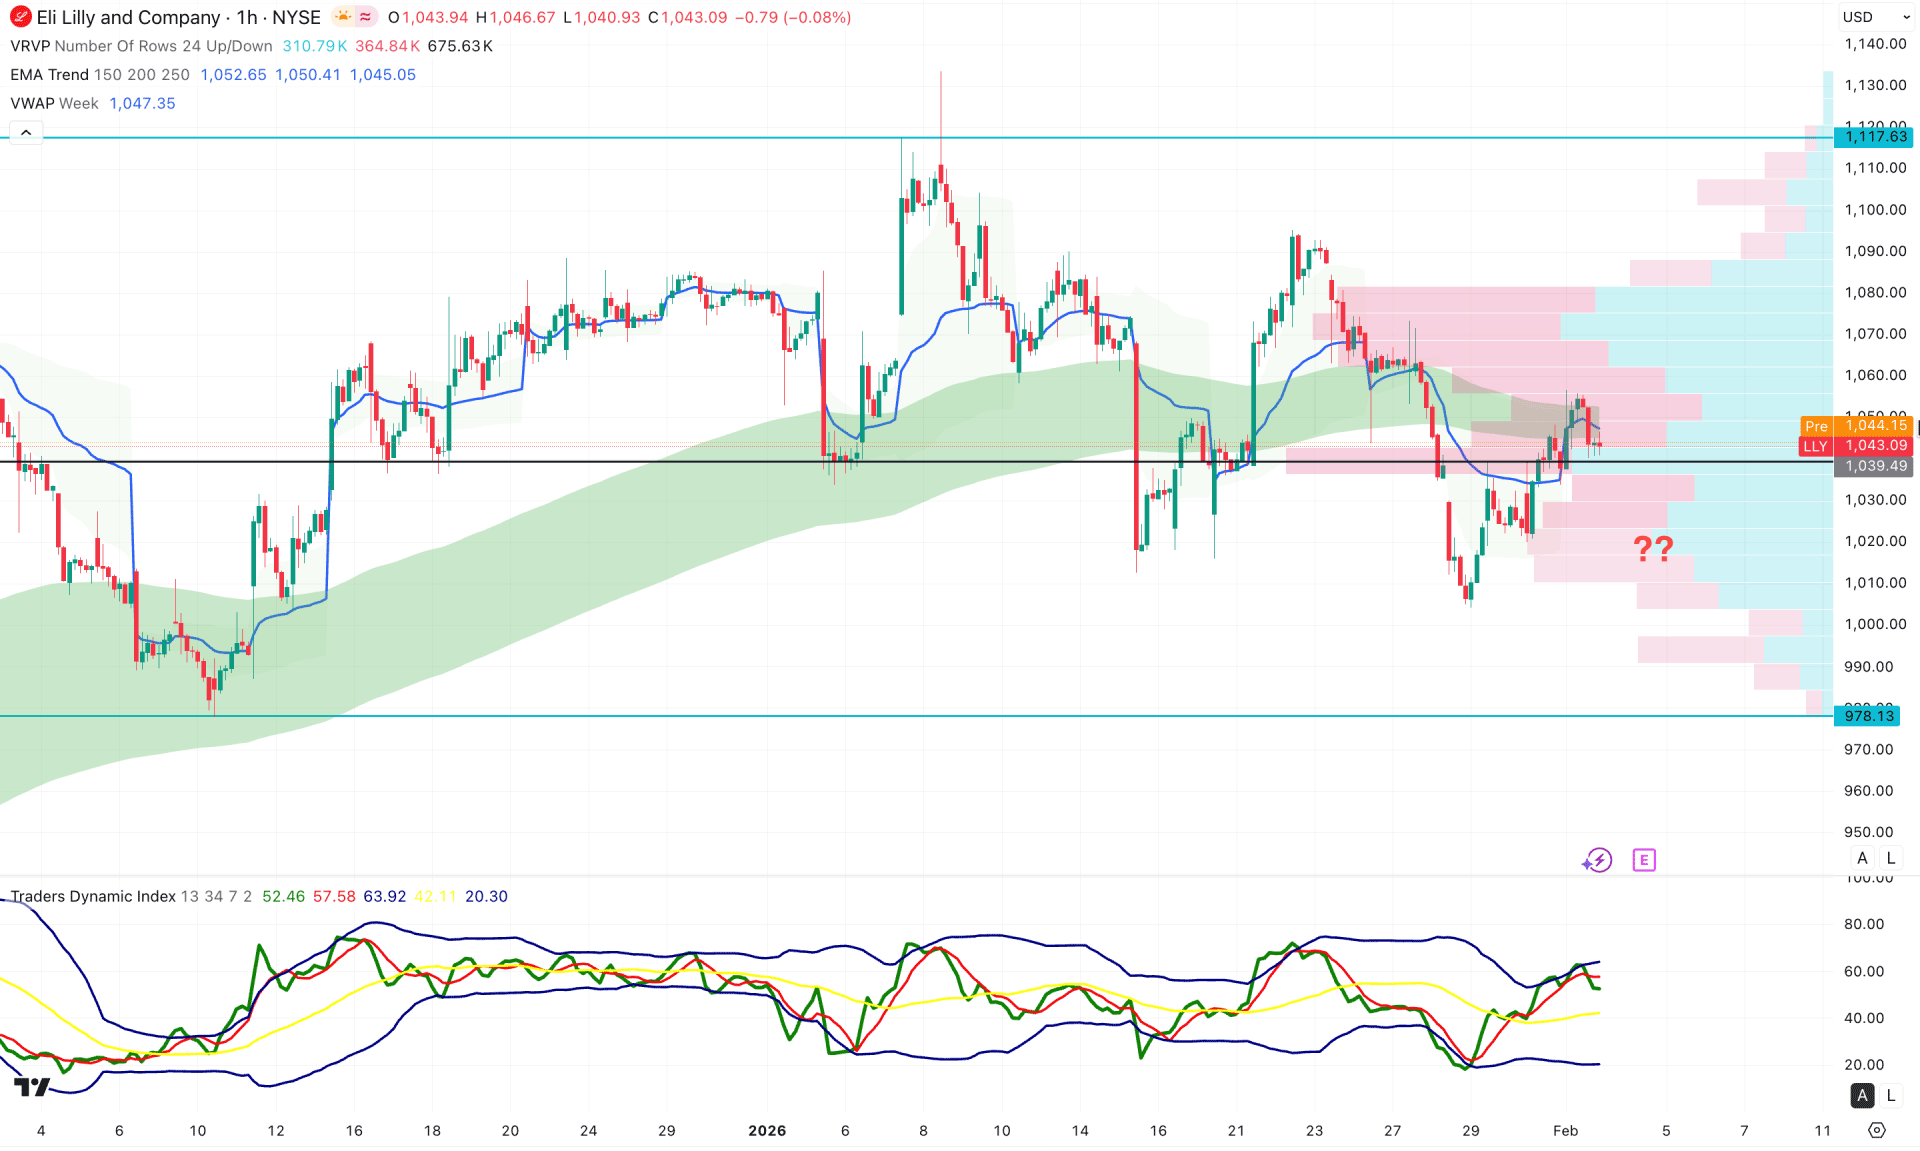
In the hourly chart of LLY, a corrective market momentum is visible where the current price is hovering near the intraday high volume line. As per the intraday structure, investors might find a stable trend once a breakout appears.
In the secondary indicator window, the Traders Dynamic Index (TDI) hovers at the upper peak area, suggesting an overbought market condition.
Based on this outlook, the primary aim of this instrument is to look for short trades only as long as it holds the selling pressure at the dynamic EMA wave area. A bearish hourly close below the weekly VWAP line could lower the price towards the 1000.00 psychological line.
On the other hand, a strong bullish break above the cloud area with a stable price could extend the buying pressure towards the 1117.63 resistance line.
Based on the overall market outlook, LLY price is trading at the bullish overextended area from where a decent downside recovery is possible. Investors should closely monitor how the price reacts at the near-term support area after releasing the quarterly earnings report. A potential hold above the December 2025 low could be a remarkable achievement for bulls, which could resume the existing bullish trend.


