
Published: January 26th, 2023
On November 2, eBay last announced its quarterly earnings. The e-commerce business beat analysts' consensus forecasts of $0.73 by $0.09 with $0.82 earnings per share (EPS) for the quarter.
In contrast to the average forecast of $2.31 billion, the company's revenue for the quarter came in at $2.38 billion. eBay had a net margin of 0.28% and a return on equity of 29.43%. Equities experts expect eBay Inc. will report 3.35 earnings per share for the current year on average.
The operating marketplace system that links buyers and sellers domestically and abroad is eBay Inc. The company's Marketplace platform consists of the eBay mobile app suite and its online marketplace at ebay.com. Users are able to list, purchase, sell, and pay on its sites from the US.
According to the company's most recent 13F filing with the Securities & Exchange Commission, Bank Pictet & Cie Asia Ltd. increased its holdings in eBay Inc. by 32.3% during the third quarter.
Several other significant investors have altered their EBAY holdings as well. In the second quarter, CoreCap Advisors LLC bought a new position in shares of eBay worth $26,000.
Should you invest in eBay Stock (EBAY)? Let’s see the complete price analysis from the eBay Stock (EBAY) technical analysis:
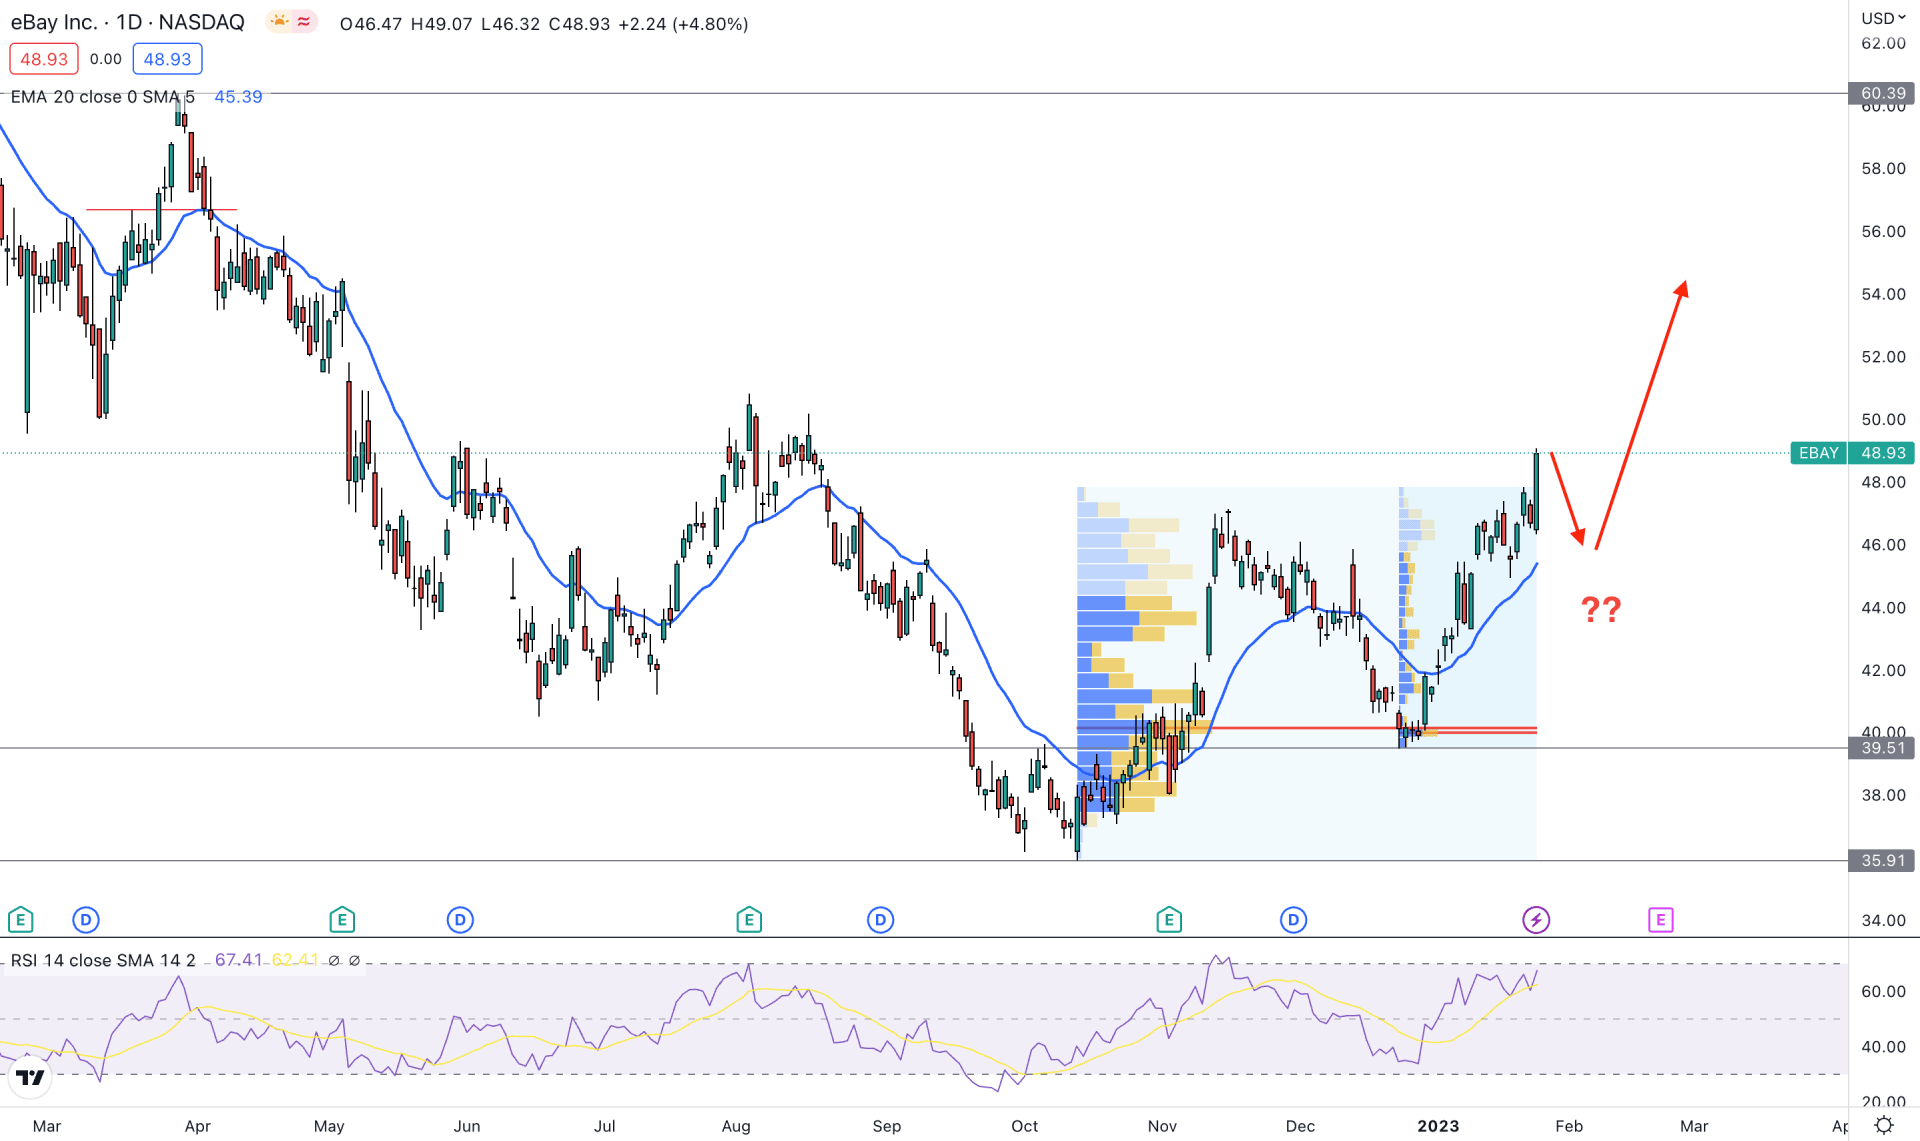
In the higher timeframe price action, the buying pressure is clearly visible as the weekly price showed consecutive higher highs. The bullish vibe is also supported by the daily candle as there is a valid lower high and higher high formation.
From left to right, a strong buy-side liquidity grab and a new swing high is visible at the 60.39 level, which will be the top of the current tradable range. On the downside, a strong bullish recovery is visible from the 35.91 support level, from where the price showed a 35% gain.
Based on the current price behavior, the upside possibility is potent as the current price is already in a bullish trend but still at the discounted zone from the tradable range.
From July 2022 to January 2023 the most active trading level is spotted at the 40.18 level, which is elbow the current price. Moreover, another high volume level from the December low to the January high is also at the 40.00 level. It is a sign that institutional investors have shown interest in this instrument from a valid bottom.
In the main price chart, the dynamic 20-day Exponential Moving Average is below the current price. Moreover, the Relative Strength Index (RSI) is holding a strong position above the 50% level, which is signaling a strong bullish trend.
Based on the current daily outlook of eBay stock (EBAY), the buying possibility is potent as long as the current price is trading at the discounted zone of the tradable range. However, the recent bullish impulsive pressure from the 39.51 level needs to show some bearish correction before forming a bullish trading opportunity.
On the other hand, the buying possibility is valid as long as the price is trading above the 39.50 level, whereas a break below this area could lower the price toward the 35.91 support level.
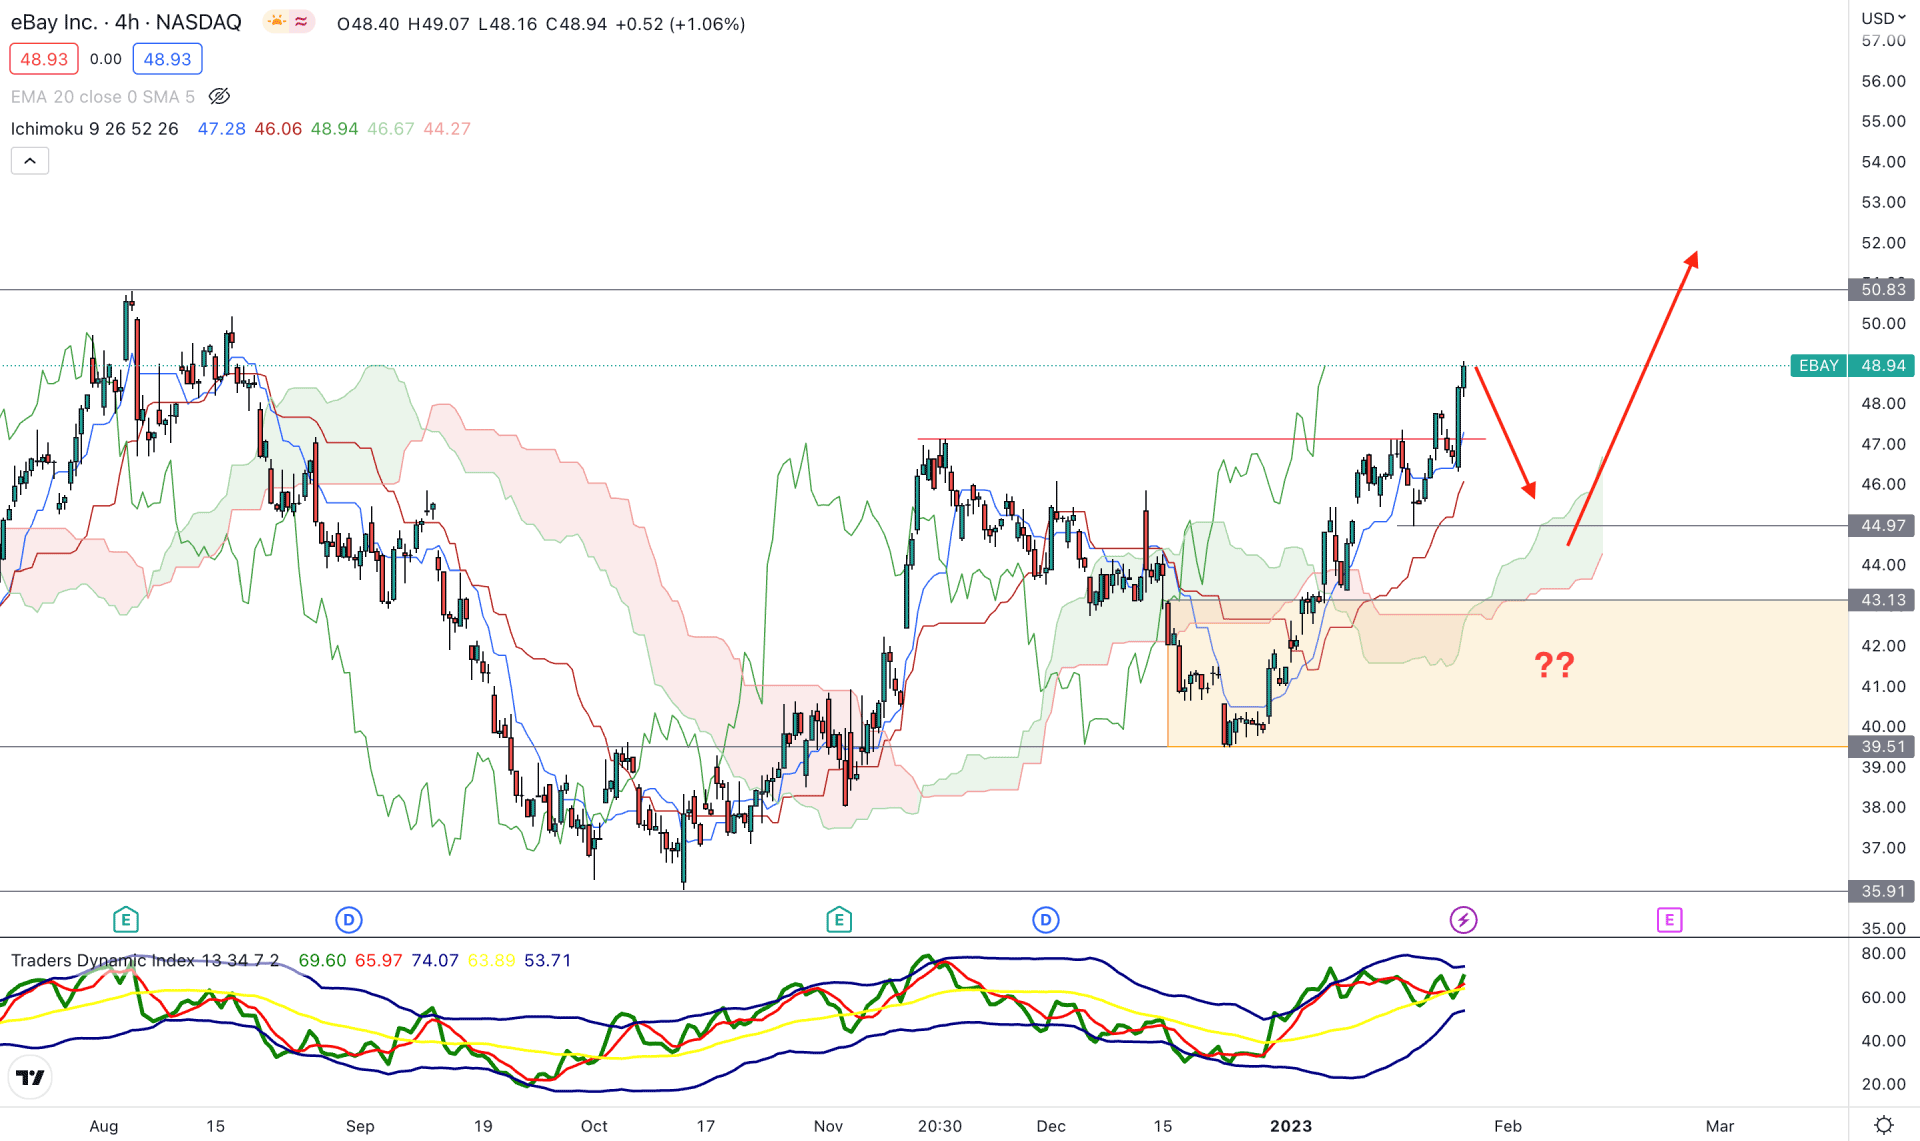
The H4 timeframe shows a valid bullish trend in eBay stock. The recent failure to hold the momentum below the cloud support and an immediate recovery with a higher high formation is a sign that bulls have joined the market and can make another high in the coming hours.
In the future cloud, the Senkou Span A and B are aiming higher while the Lagging Span is above the price on that level. The buying momentum is also supported by the Traders Dynamic Index Indicator, which is holding a strong position above the 50% area.
Based on the current price outlook in the H4 timeframe, the bullish trend needs a correction before forming another higher high. The first buying attempt possibility might come from the 44.97 swing low. However, further discount and a strong bullish reversal from the 43.13 to 39.51 area could offer a high probable buying opportunity. In both cases, the ultimate buying target would be towards the 55.00 psychological level.
On the other hand, breaking below the 39.50 level could open rooms for reaching the 35.00 area.
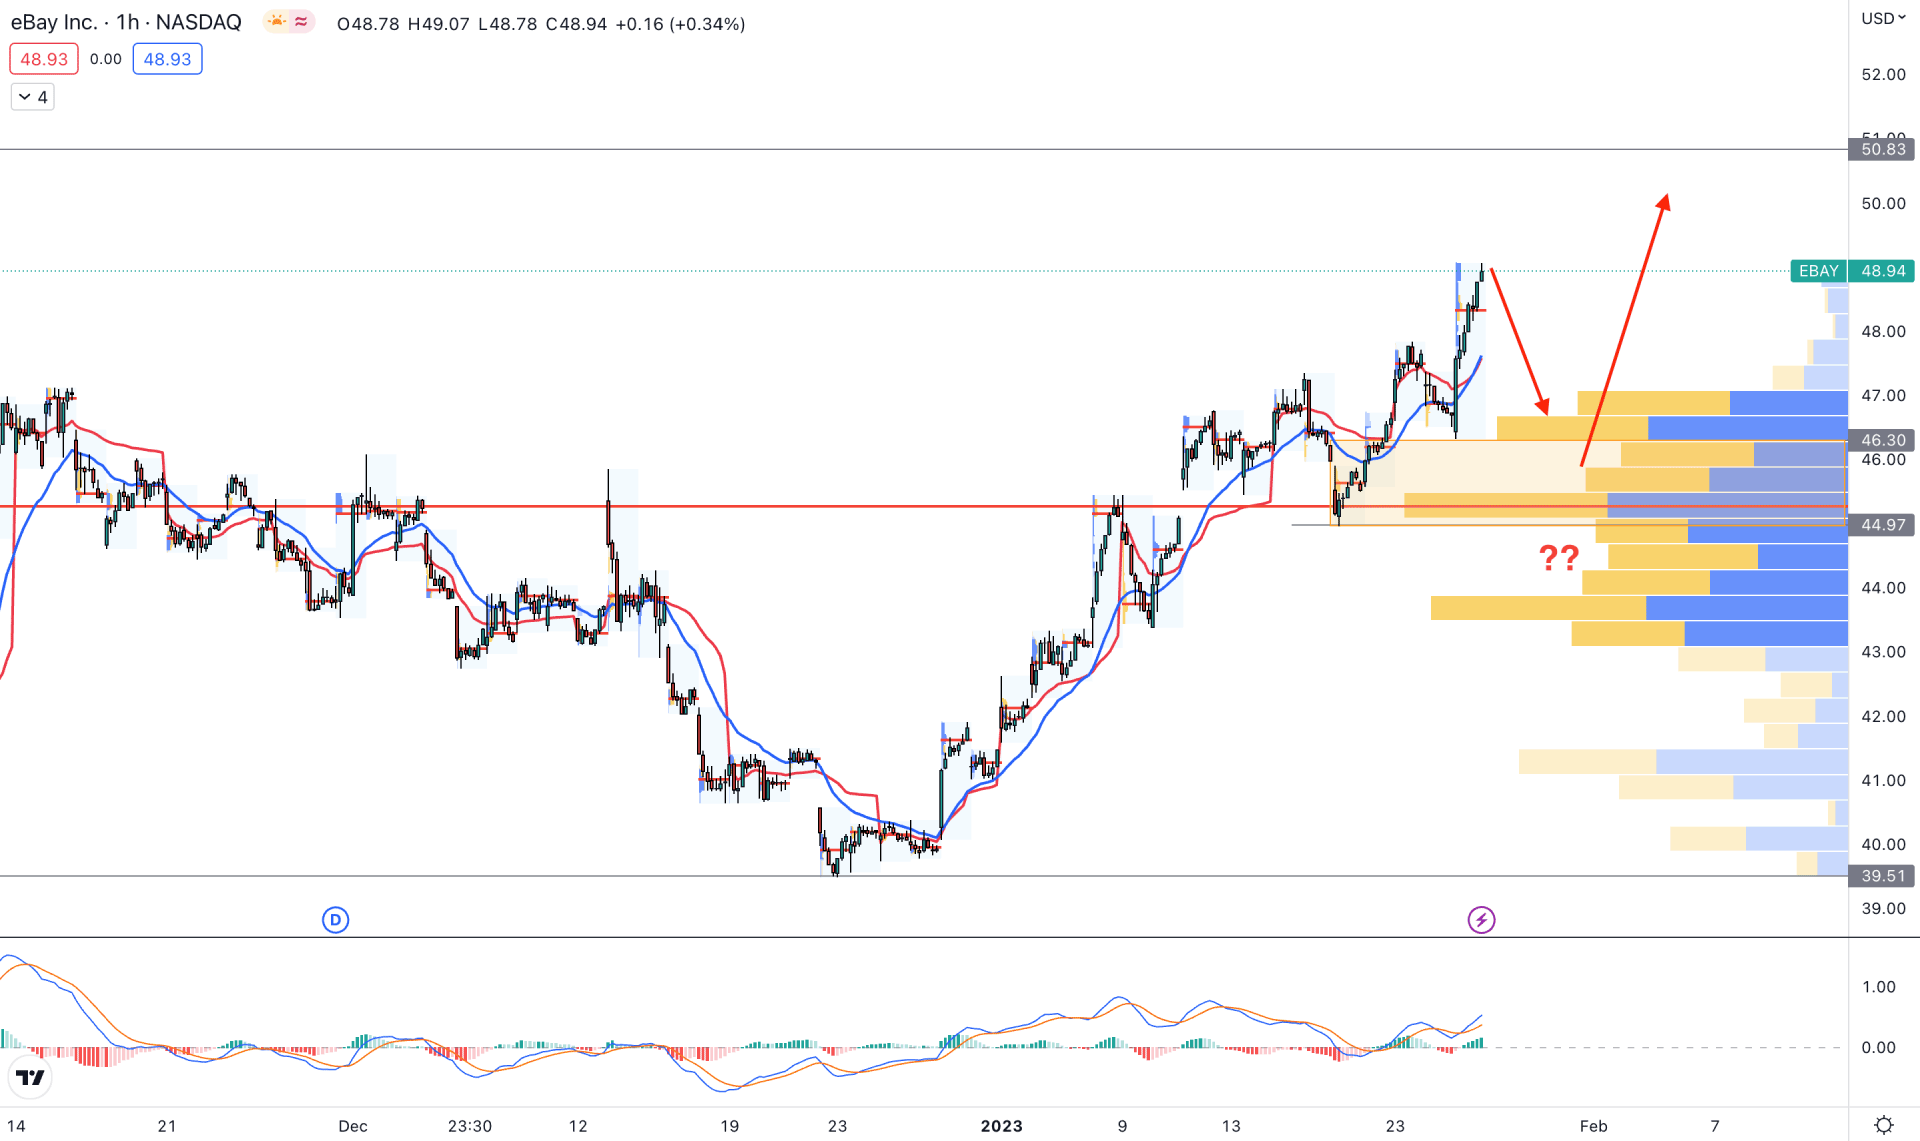
In the hourly time frame, the intraday buying pressure is clearly visible in the eBay stock price chart. A stable higher high is seen above the visible range high volume level, which could offer a buying opportunity after a minor correction.
In the indicator window, the MACD Histogram is holding a strong bullish position while MACD EMA’s are aiming higher. The dynamic 20 EMA and weekly VWAP are below the price and working as immediate support.
Based on the hourly outlook, the buying possibility is valid as long as the price trades above the visible range high volume level. However, breaking below the 44.00 level with an H4 close could lower the price towards the 40.00 level.
Based on the current multi-timeframe analysis, eBay stock has a higher possibility of extending the buying pressure in the coming days. Investors should wait for a bearish correction and a valid bullish rejection before joining the broader market trend.


