Published: March 30th, 2022
In the US economy, inflation is at 40 years high where the current cash inflow may not adequately cover future expenses for any business. However, one stock can offer a stable return even if the inflation is higher. In today's analysis, we will talk about eBay stock (EBAY).
eBay is a platform that connects buyers and sellers to meet their requirements. Therefore, it doesn't involve carrying inventories that might insulate the company from inflationary pressure. On the other hand, higher inflation might be a positive factor for the company. If the product price rises, eBay will have higher revenue as its commission or fees come from the percentage of the selling amount.
In the 2021 Q4 report, eBay showed earnings of $1.05 per share, beating analysts' expectations of $0.99. Meanwhile, the revenue came in line with $2.6 billion, 5% above the expectation, while the GAAP margin increased 26.3%. In this quarter, the company returned $3.1 billion to shareholders through dividends and share repurchases.
Let’s see the upcoming price direction from the eBay Stock (EBAY) technical analysis:

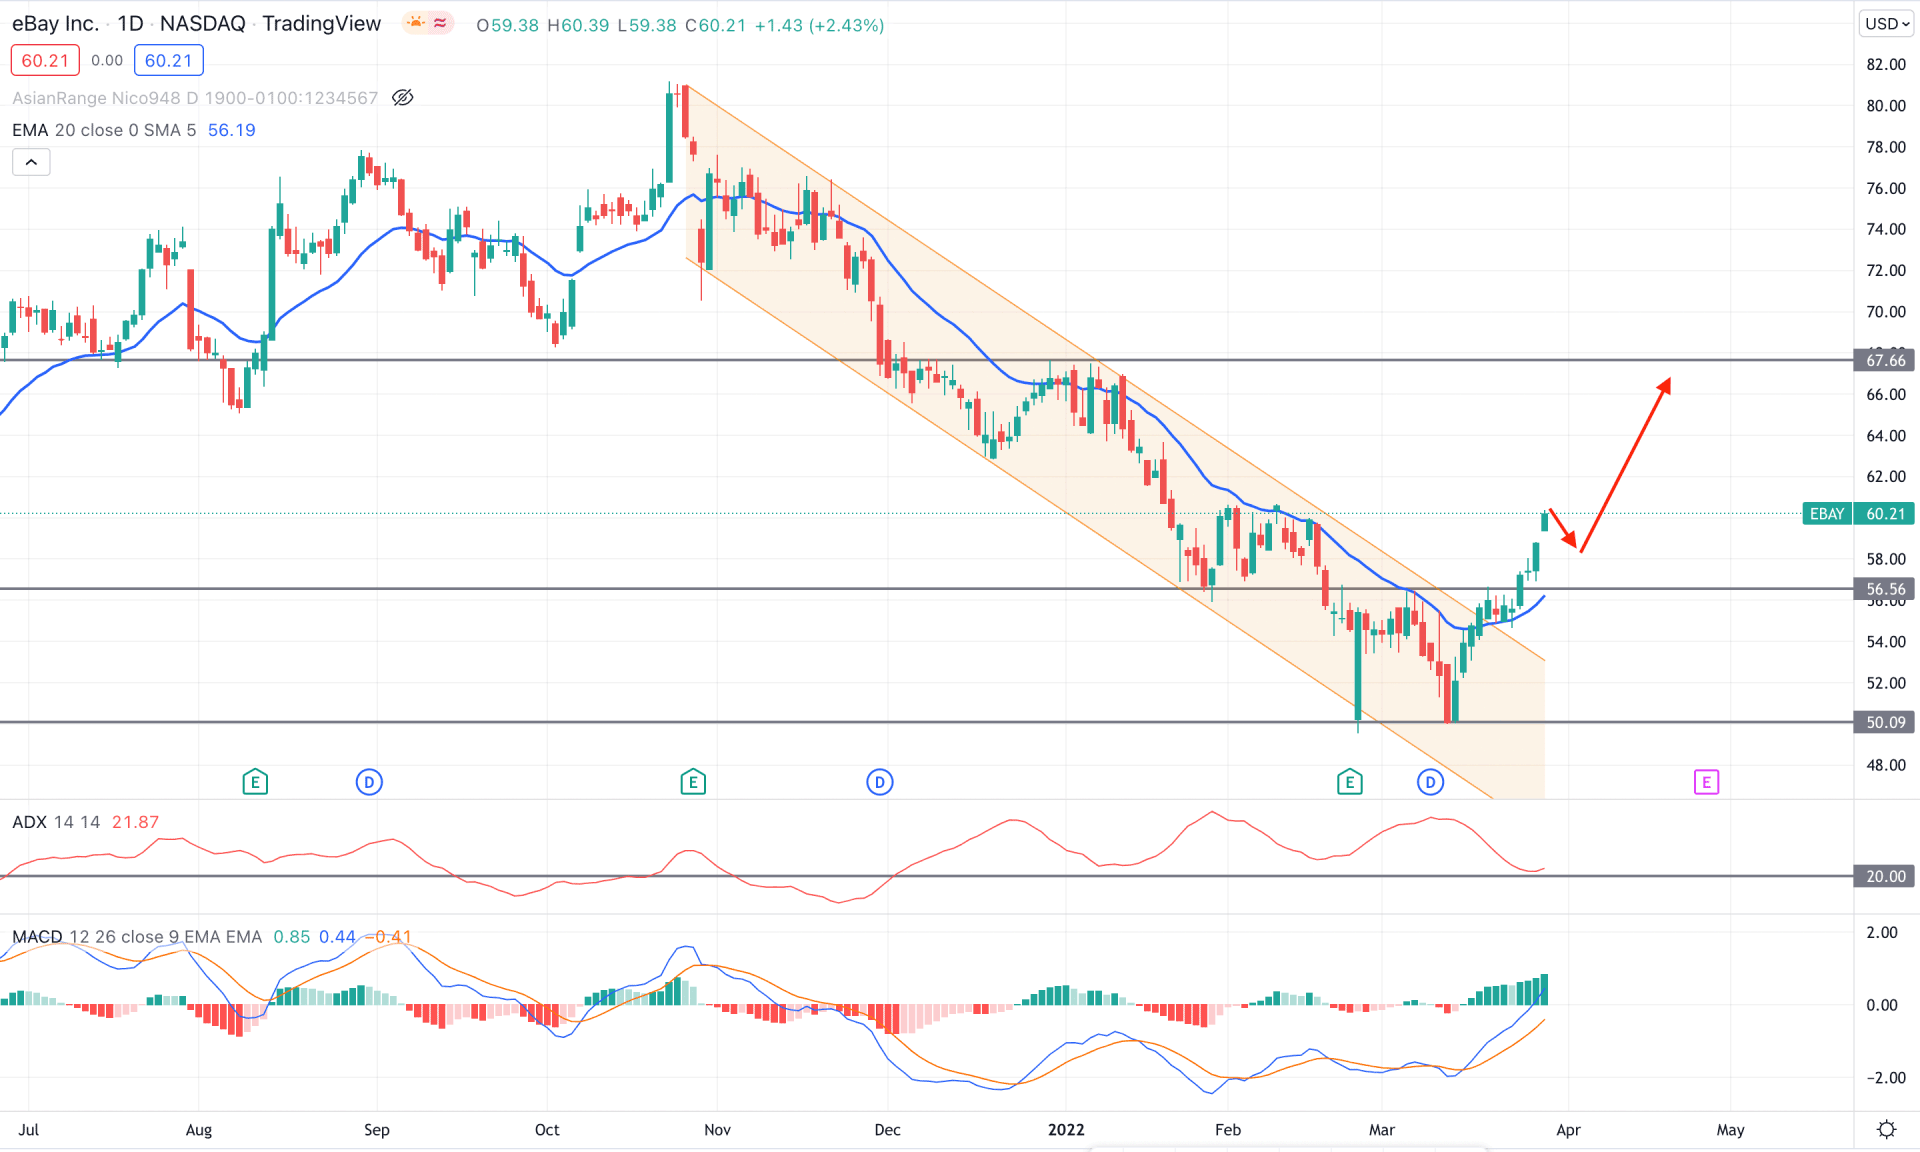
In the daily chart, we can see that eBay stock moved lower from the 80.90 swing high to the 50.00 swing low with a volatile corrective pressure. The extended bearish channel failed to boost its momentum below the 50.00 low and formed a double bottom pattern. Later on, the bullish pressure from the 50.00 level with the violation of the 56.56 resistance level was the first sign of buyers' presence in the price.
The above image shows how the price moved above the dynamic 20 EMA with an impulsive bullish pressure. Moreover, the MACD remained bullish with consecutive highs in the Histogram followed by a regular divergence. Overall, the bullish pressure above the 56.56 level is still intense as the ADX line is above the 20 level with an upside slope.
Based on the current context, we can consider the future price direction as bullish as long as it trades above the 56.56 static level in the daily chart. Therefore, any short-term bearish correction in the intraday chart would be a buying opportunity in this stock where the primary aim is to test the 67.66 resistance level.

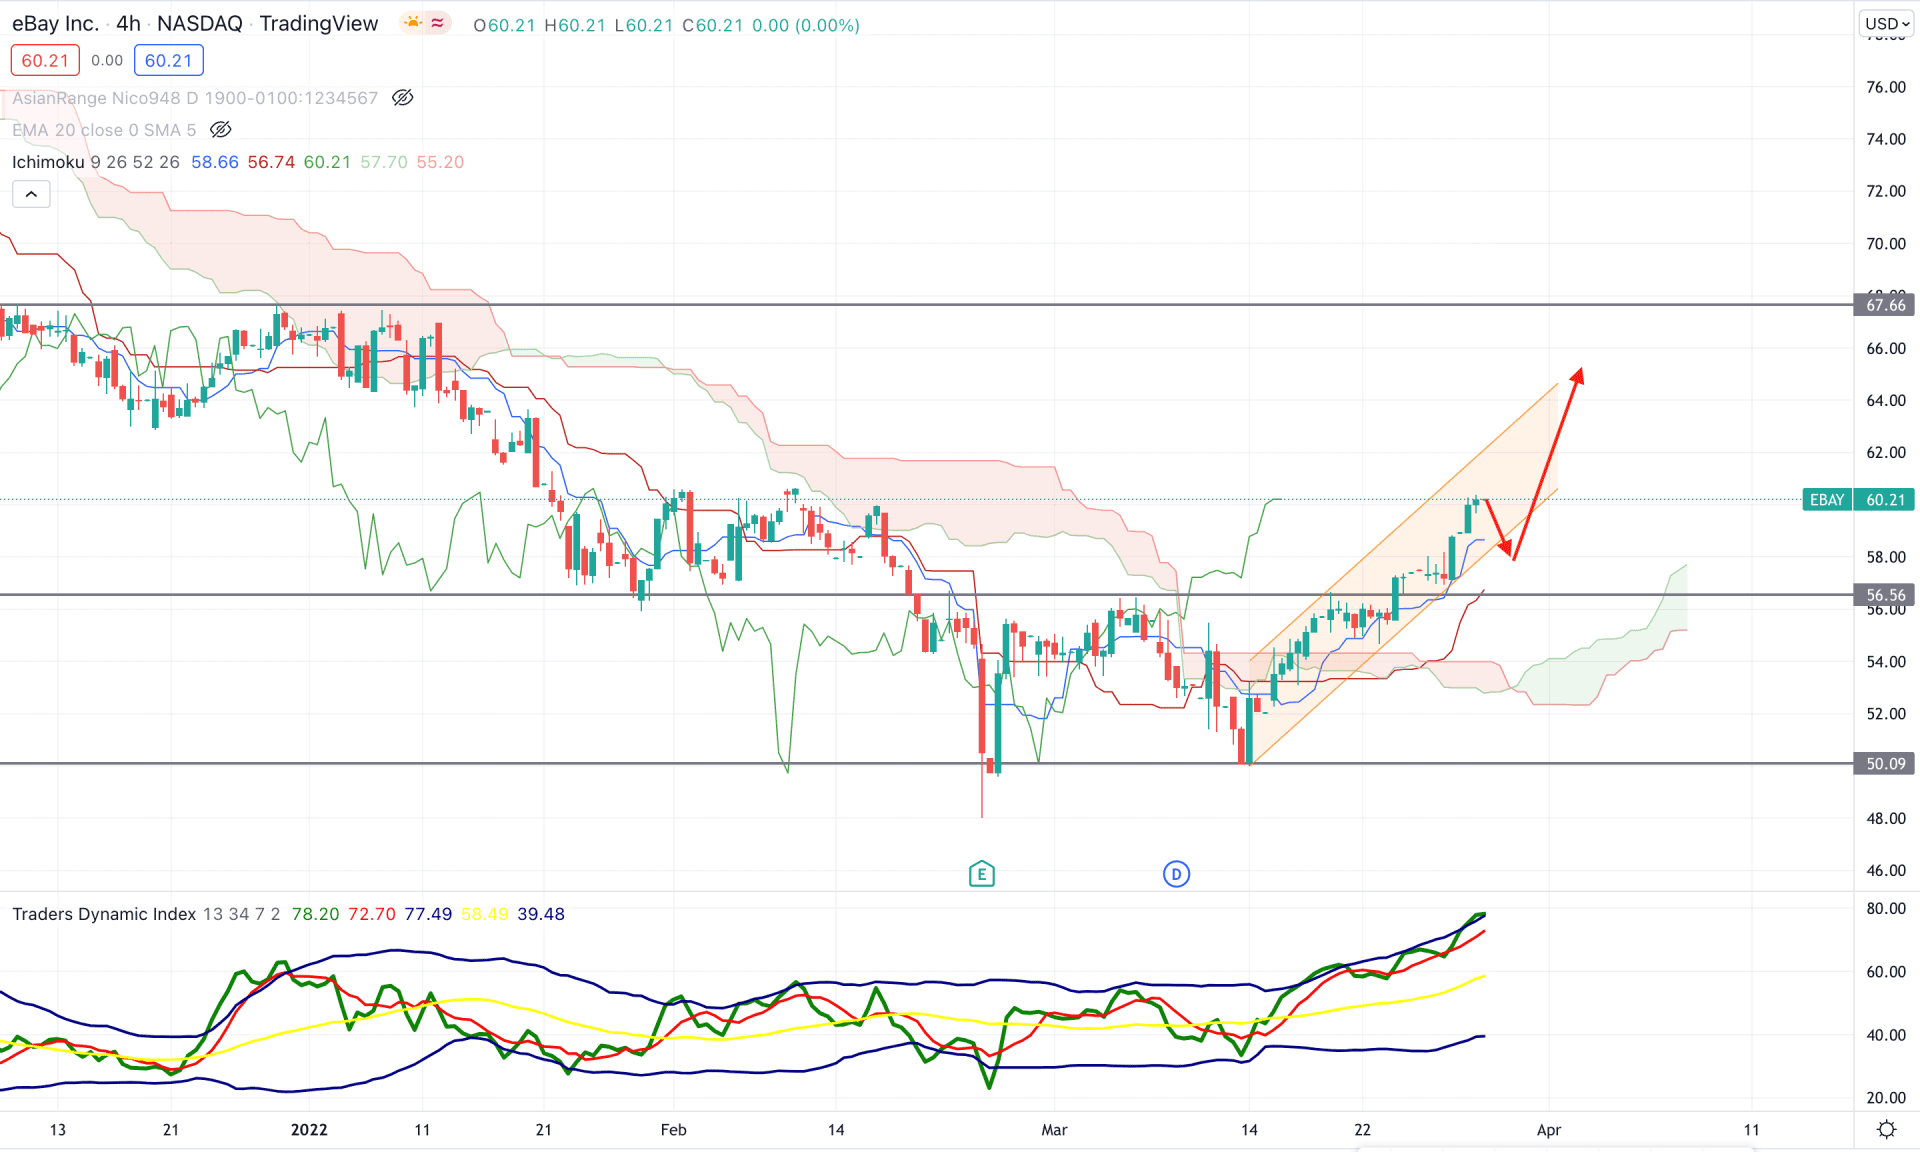
According to the Ichimoku Cloud analysis, the eBay stock H4 chart shifted its direction from bearish to bullish after the failure to make a new low below the 50.00 level. In addition, the extreme buying pressure with the 56.56 neckline breakout of the double bottom pattern increased the possibility of testing the 67.66 level in the coming session. The Senkou Span A is above the Senkou Span B with an upside momentum in the future cloud, which indicates that the buying pressure is still solid.
The above image shows how the TDI line reached the upper band in the indicator window. It is a sign that bulls are still aggressive in the price and likely to make another bullish leg. On the other hand, the dynamic Tenkan Sen and Kijun Sen are below the price, indicating short-term buyers' presence in the price.
Therefore, this stock's buying possibility is valid until a bearish H4 candle appears below the 54.00 level. On the other hand, any bullish rejection from the 60.00 to 57.00 area with a candle above the dynamic Tenkan Sen would be a buying sign for this stock where the primary target is to test the 67.00 area.

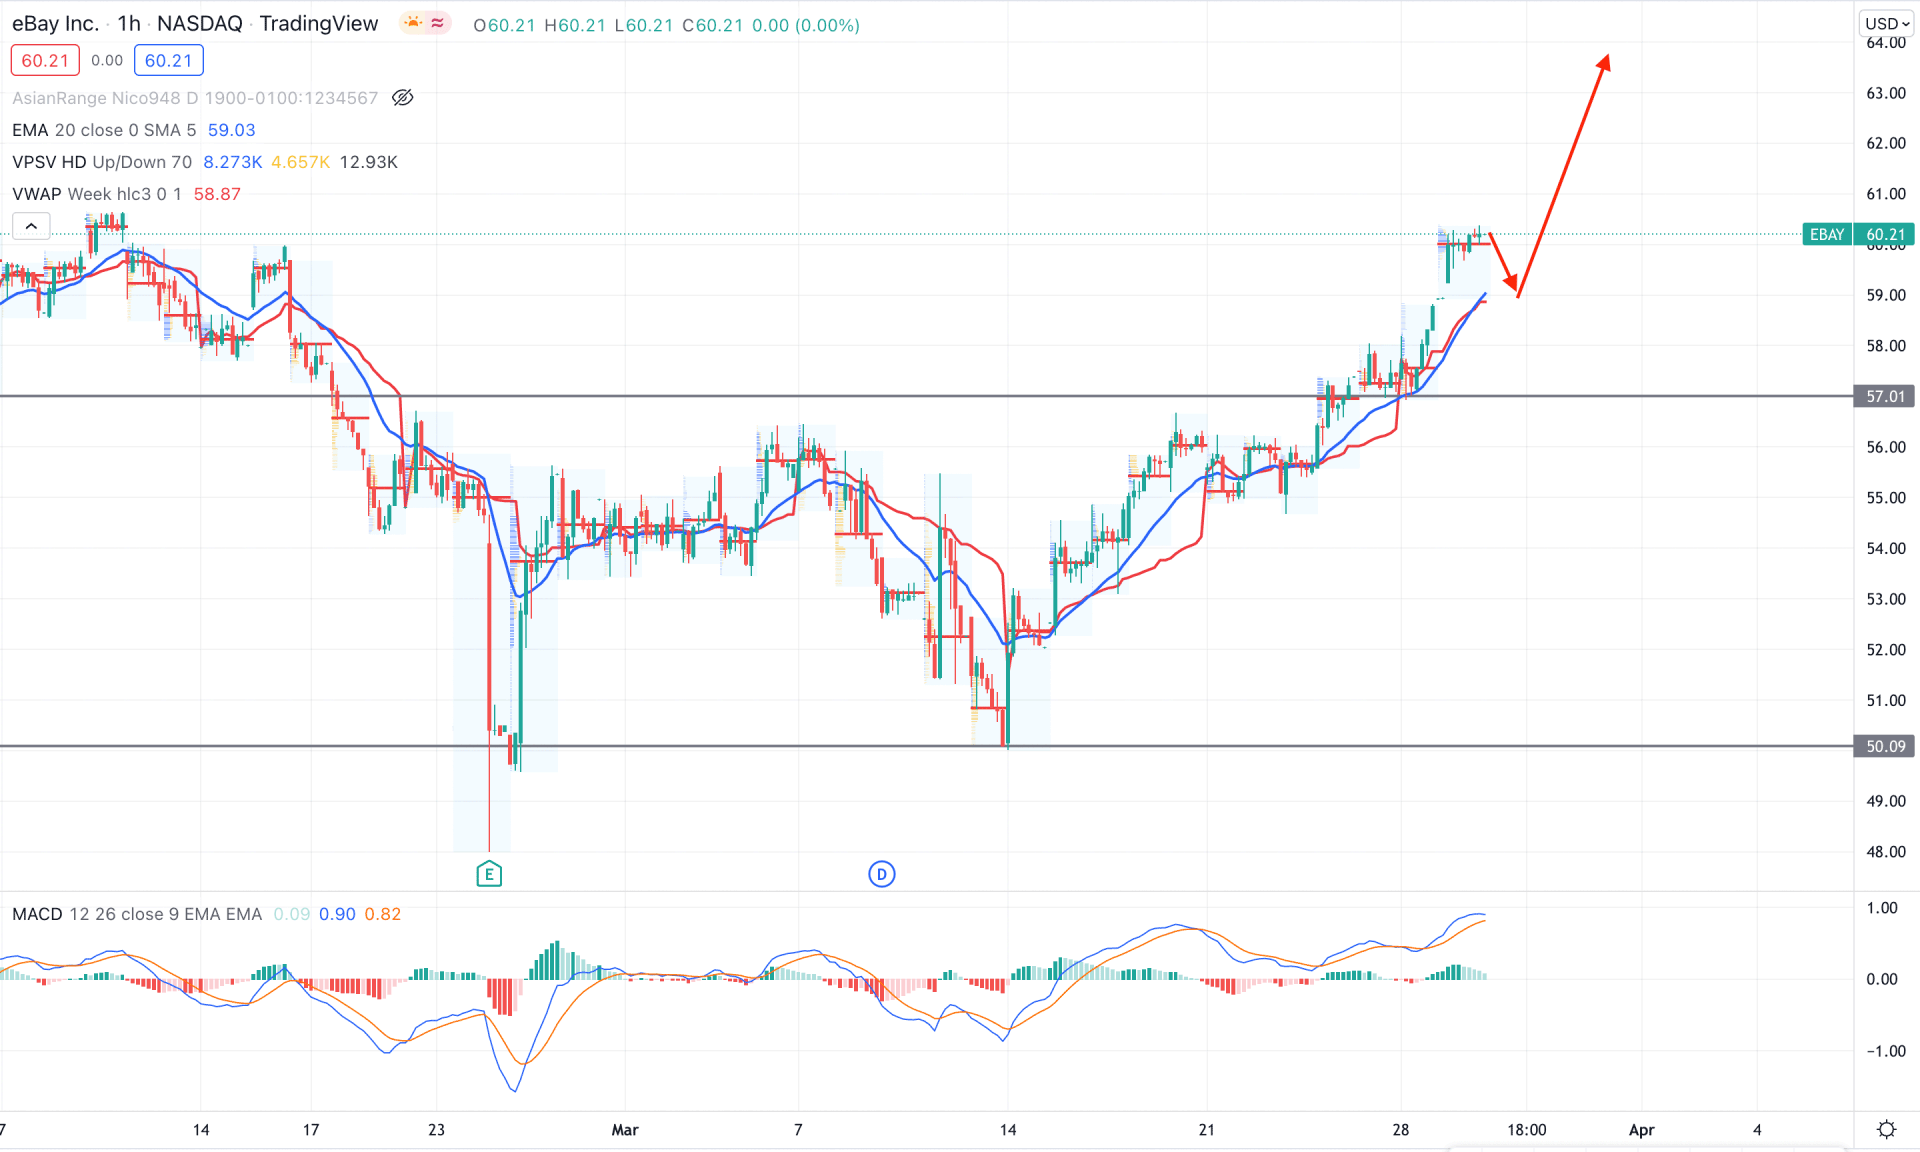
eBay stock is trading with an upside momentum in the intraday chart as the current price is above the dynamic 20 EMA. Moreover, the Most recent intraday high volume level is near the current price, where any bullish H1 candle from dynamic support would be a buying point.
The above image shows how the MACD lines made higher highs with no sign of divergence from the price. Moreover, the weekly VWAP is below the price, working as a dynamic support. Therefore, the buying attempt might come with a bullish rejection from the dynamic VWAP with a bullish candle. In that case, the primary price target would be towards the 64.00 level with an invalidation level below the 56.00 area.
Based on the current multi-timeframe analysis, eBay stock is more likely to show buying pressure in the coming days. The business structure and lower inflationary pressure would be key price drivers for this stock. However, investors should closely monitor the intraday chart, where any bullish sign in the H1 chart would be a solid buying point.