
Published: November 26th, 2025
As investors valued a possible interest rate drop by the US central bank in December and clear economic data, U.S. stock market futures slightly increased today.
Based on CME Group's FedWatch Tool, traders priced in an 84.9% probability of a 25-basis-point rate cut by the Federal Reserve next month, following dovish remarks from prominent Fed policymakers, which is double the likelihood observed last week.
At a time when political interference in monetary policy has been a concern, investors were also considering a report that said White House financial counsellor Kevin Hassett was a front-runner for the position of the next Fed Chair.
The unemployment data showed a positive sign by coming in at 216K. Moreover, the Core Durable Goods orders came at 0.6%, up from 0.3% in the previous month. However, this data is not enough to show a reliable signal, and investors might wait until next week to gauge the Dow Jones direction.
Monthly deficits on the major indexes have decreased as Wall Street recovers from a tech-led decline earlier this month. Even so, it would continue to be their largest monthly deficit since the American tariff disaster earlier this year.
Let's see the further outlook for this index from the US30 technical analysis:
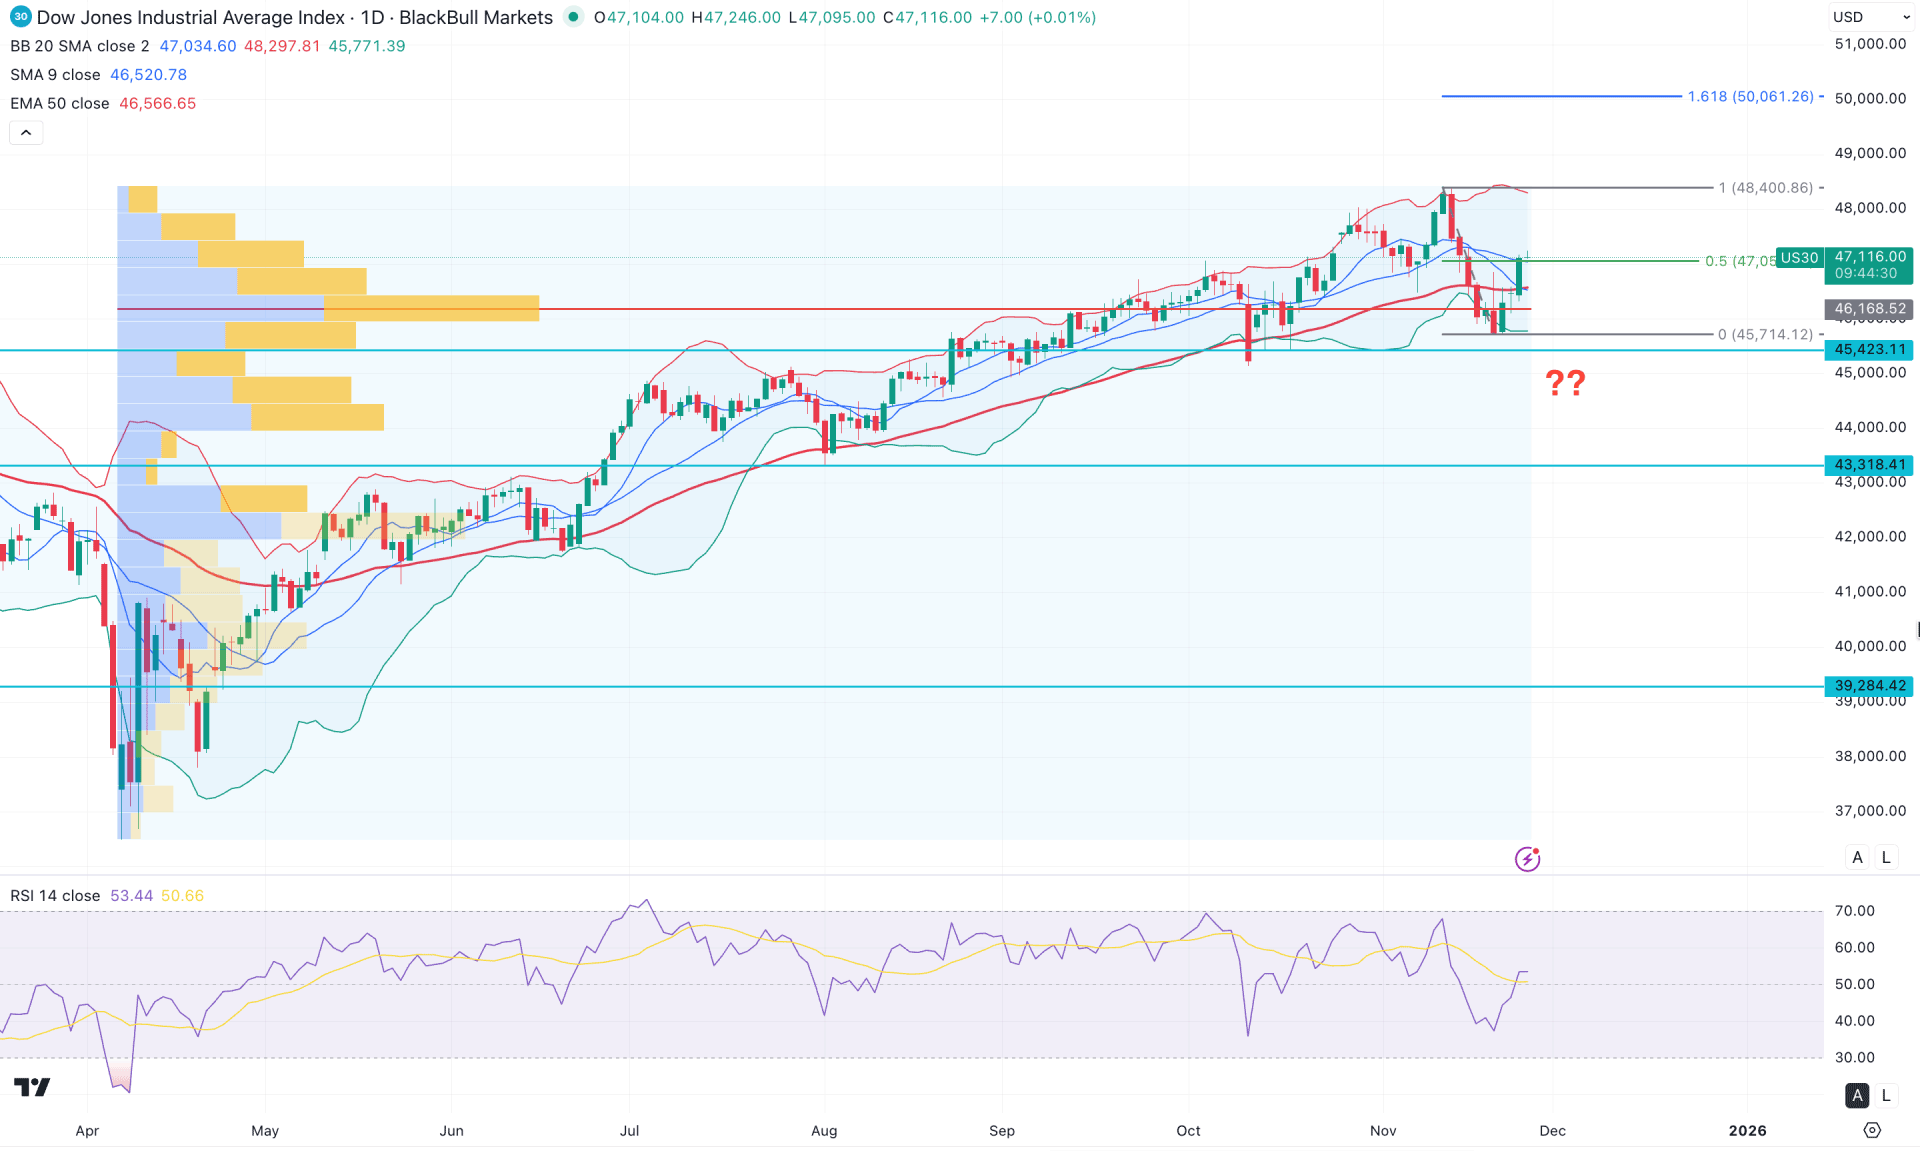
In the daily chart of the DJI, the broader market momentum remains bullish, even though a recent bearish dip signalled increased volatility. As the price formed a bottom and moved higher with a continuation of momentum, investors may expect further upside.
On the higher timeframe, the monthly chart shows a volatile structure. The current candle is still trading within the bullish body of October 2025, despite multiple violations above and below the previous monthly trading zone. However, a corrective bullish momentum is visible on the weekly timeframe, where the most recent candle is forming a bullish engulfing pattern awaiting confirmation.
In terms of the Bollinger Bands, the price is trading within the buyers' zone, as a valid bullish reversal is evident from the 46,168.52 level, supported by multiple bullish candles above this line.
In the main price action, the price rebounded and formed a daily close above the mid-Bollinger Band line, which could act as a major bullish signal. Moreover, the price revisited the lower band and formed a bullish recovery above the 50-day exponential moving average (EMA), which could work as a strong confluence factor for further gains.
In the secondary indicator window, the price is trading in the buyers' zone as the Relative Strength Index (RSI) hovers above the 50.00 neutral line, leaving room for a move toward 70.00. However, the strength of the trend is not solid, as indicated by the Average Directional Index (ADX), which is sloping downward below the 20.00 level.
Based on the overall market structure, the bullish momentum may sustain as long as the price remains supported above the 50-day EMA. On the bullish side, the immediate resistance is located at 48,400.86 before the market approaches the 50,016.265 extension level.
On the other hand, a range extension is possible, with immediate support located at 45,714.12. A daily close below this level could open the door for a decline toward the 43,318.41 key support level.
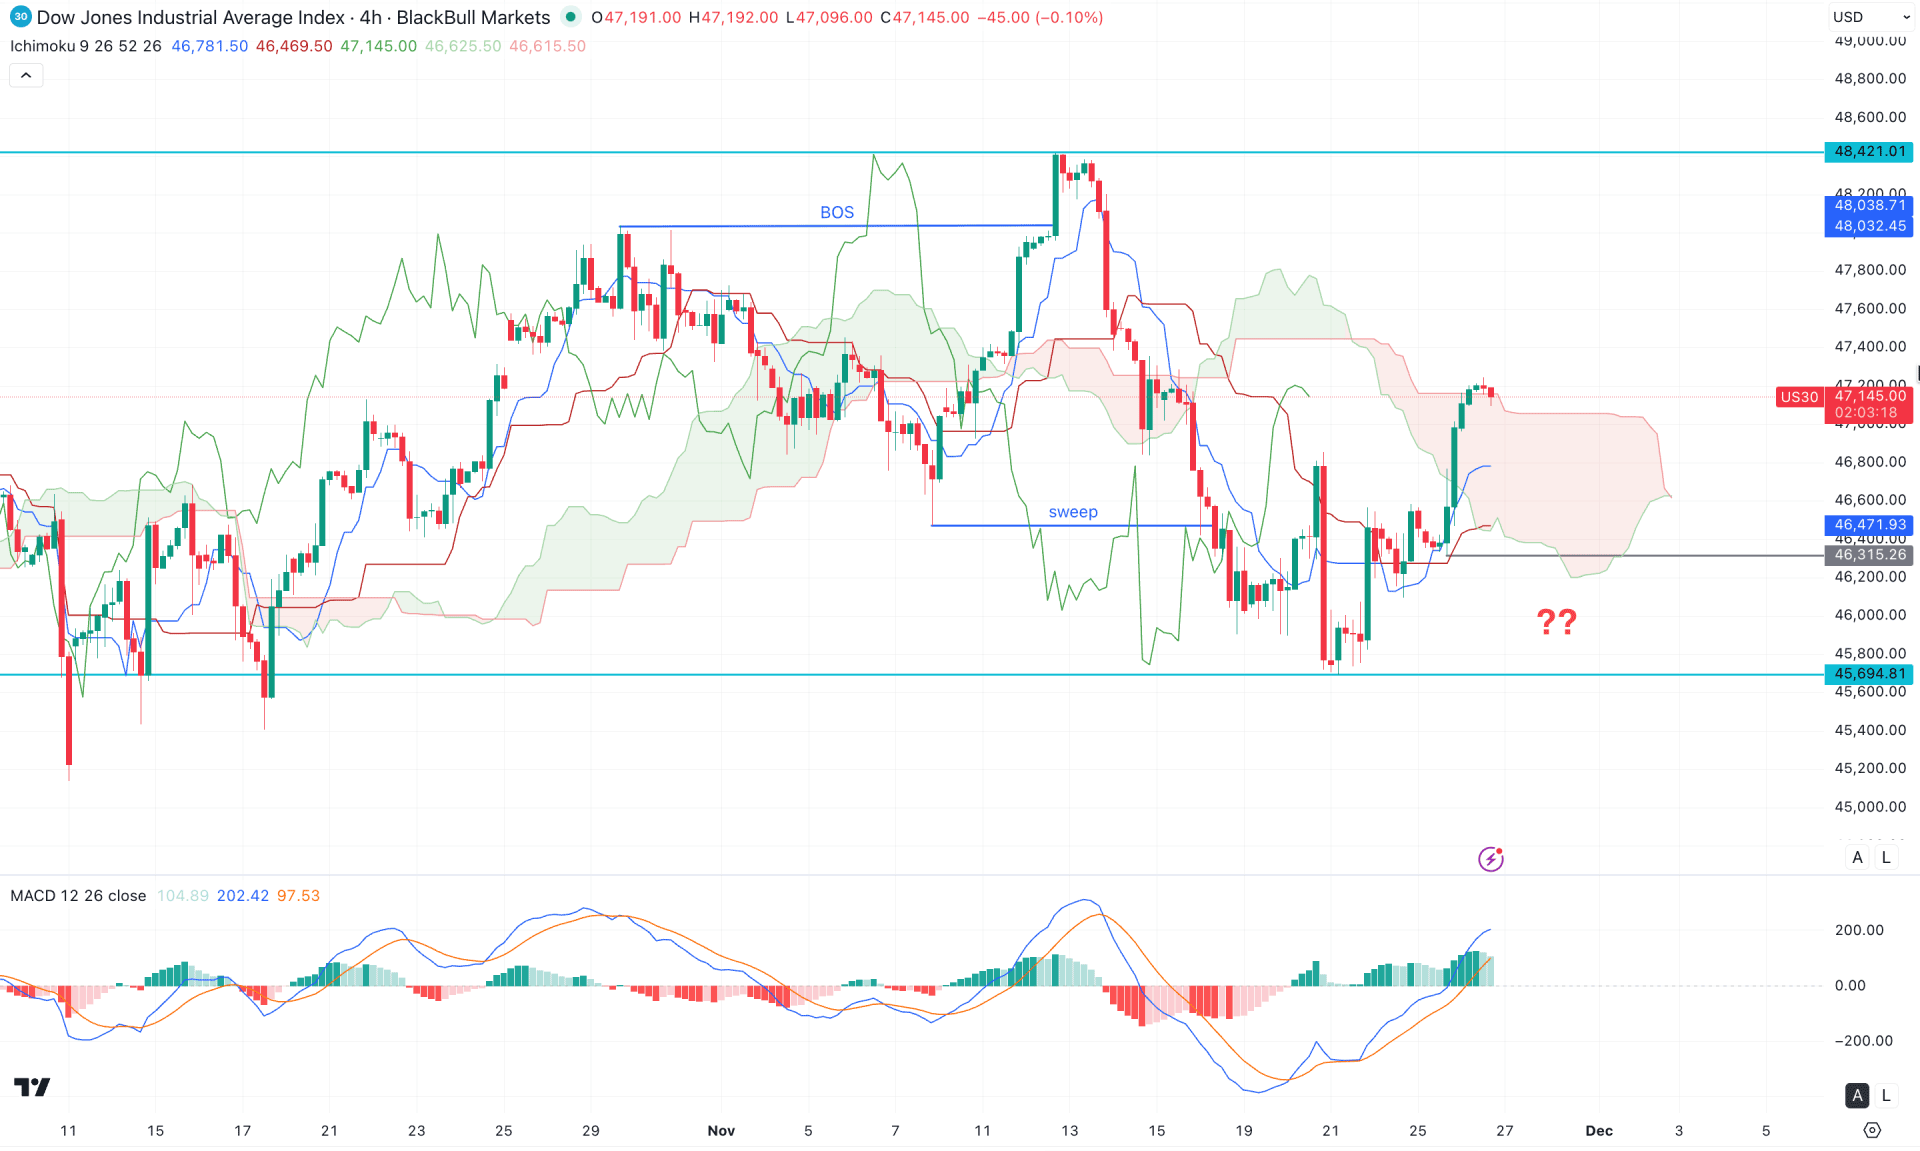
In the H4 timeframe, the major market momentum is sideways as the recent price rebounded above the Ichimoku Cloud area. Moreover, the Future Cloud is not solid enough to confirm the bullish trend. The Senkou Span A and B are closer together, suggesting an indecisive momentum.
Moreover, the MACD Histogram suggests a potential bullish continuation where the Histogram maintained the bullish momentum for a considerable time. The MACD Signal line is still bullish, as the current line is hovering above the neutral area.
Based on this outlook, investors should closely monitor how the price holds the buying pressure above the Cloud Support. Any bullish rebound from the dynamic Kijun Sen level could open the long opportunity, aiming for the 48421.01 level.
However, a bearish reversal from the current area with an H4 close below the 466400.00 line might limit the bullish gain at any time.
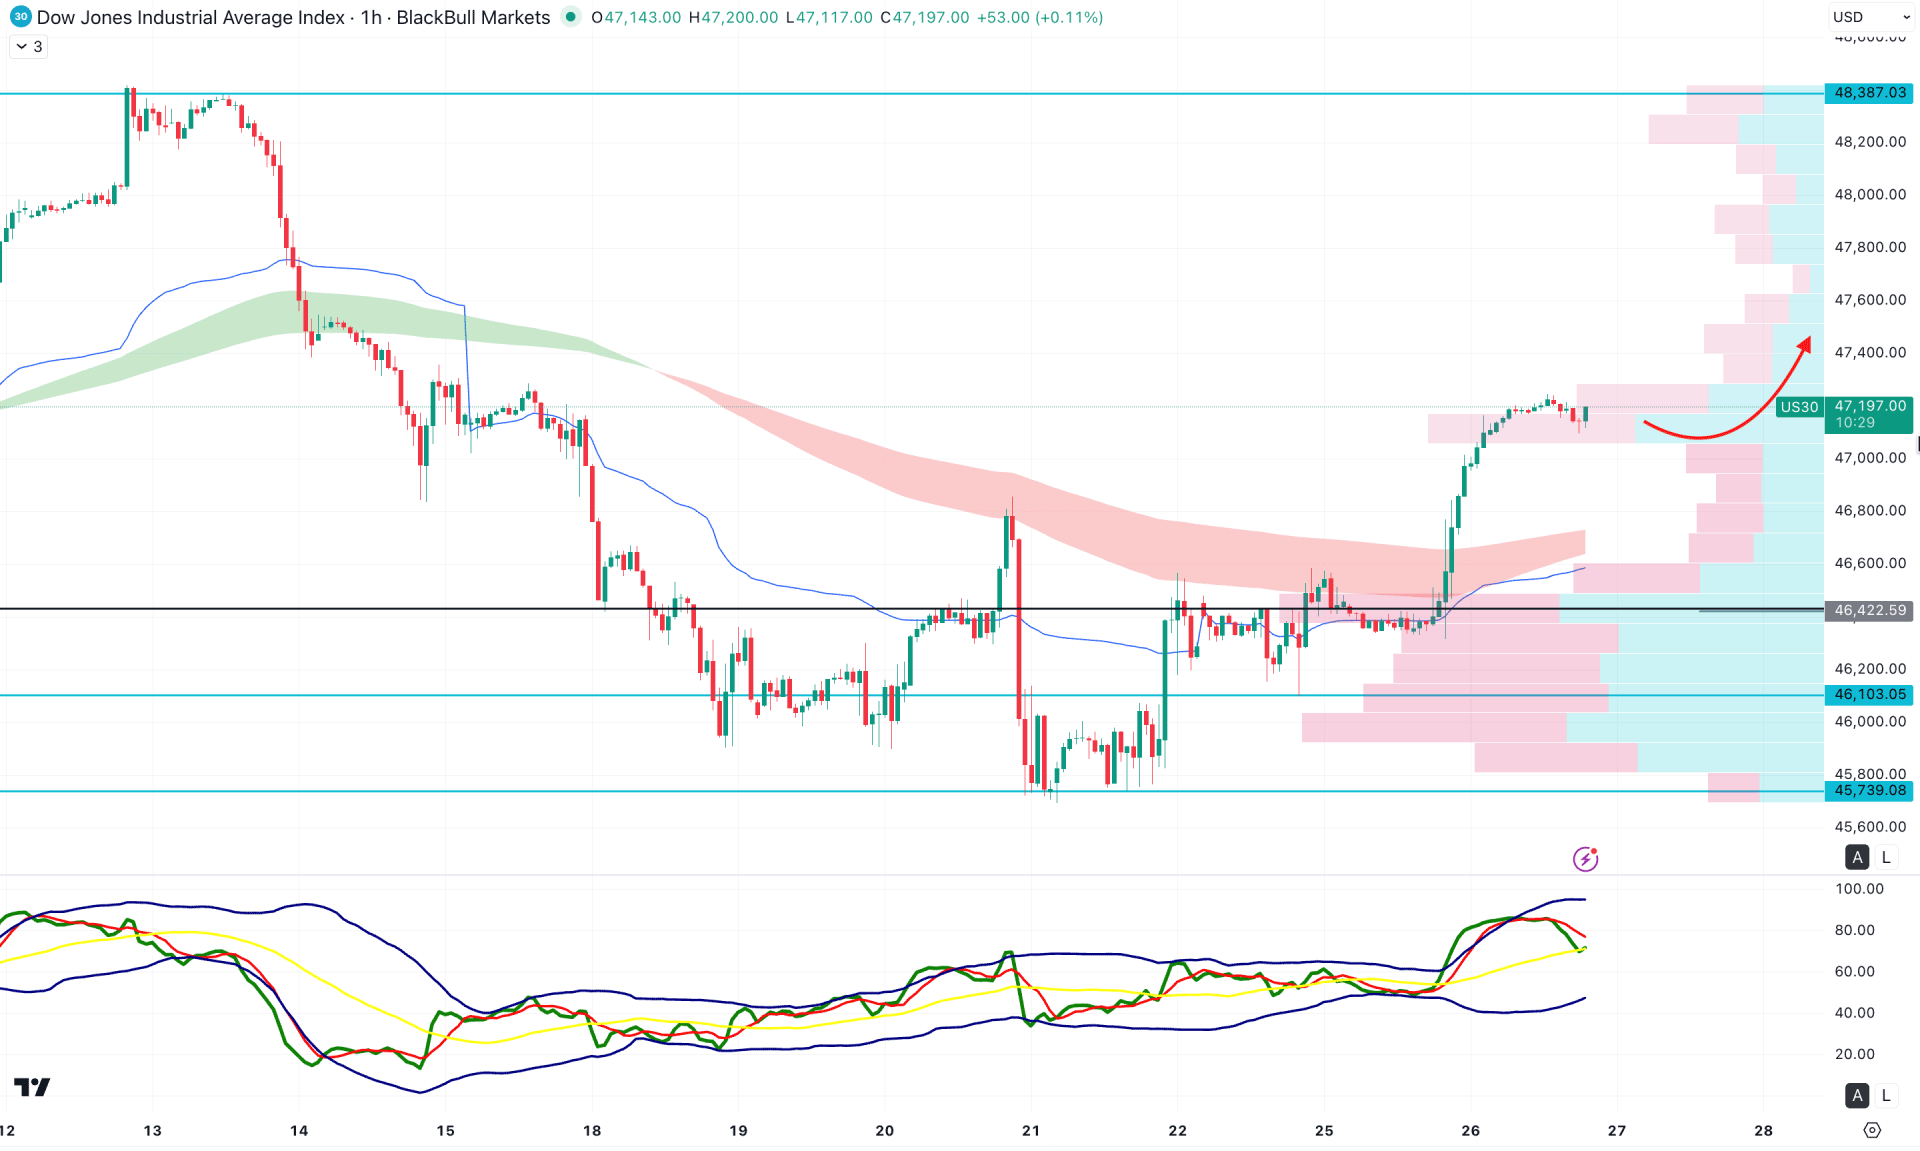
In the hourly timeframe, the price is moving around crucial dynamic lines and entering buying pressure. The exponential moving average (EMA) wave and the weekly VWAP are both positioned below the current price, maintaining a bullish slope. Moreover, the intraday high line is below the VWAP line, suggesting a potential correction as the main reversal point.
Based on this outlook, the overall structure indicates a bullish continuation possibility. However, a minor downside correction is still pending, which may create an opportunity to join the market from a discounted level.
The immediate support is located at 46,422.59, which could act as a strong barrier for short-term bulls. A break below this level could push the price toward the liquidity zone. In that case, the price may extend lower and test the 45,739.00 key support level.
As per the current market structure, US30 is trading within a bullish trend, where an intraday rebound could work as a solid continuation signal. Investors should closely monitor the hourly chart as a valid bottom could offer a potential long opportunity.


