
Published: December 14th, 2023
The US Stock market witnessed a substantial upswing on Wednesday afternoon after the Federal Reserve's ultimate policy determination of the year. As of its close at 37,090.24, the Dow experienced a significant 1.4% surge, surpassing its all-time high of 36,799.65 established almost two years ago.
Wall Street ecstatically greeted the Federal Reserve's declaration of a pause in its aggressive interest rate increases, which had lasted nearly two years. Additionally, the central bank anticipated three rate reductions in 2024.
The Dow's year-to-date gains were propelled to 11.9% by this advance, whereas the S&P 500 is nearing its all-time high with an astounding 22.6% increase in 2023 and a 2% margin. This year, the Nasdaq Composite has also surged by an impressive 40%.
In the wake of the Federal Reserve's declaration, Treasury yields declined to their most minimal level since August. The 10-year Treasury yield decreased to 4.018%, or roughly two-tenths of a percentage point, in response to the central bank's anticipation of interest rate reductions.
Let’s see the upcoming price direction from the Dow Jones technical analysis:
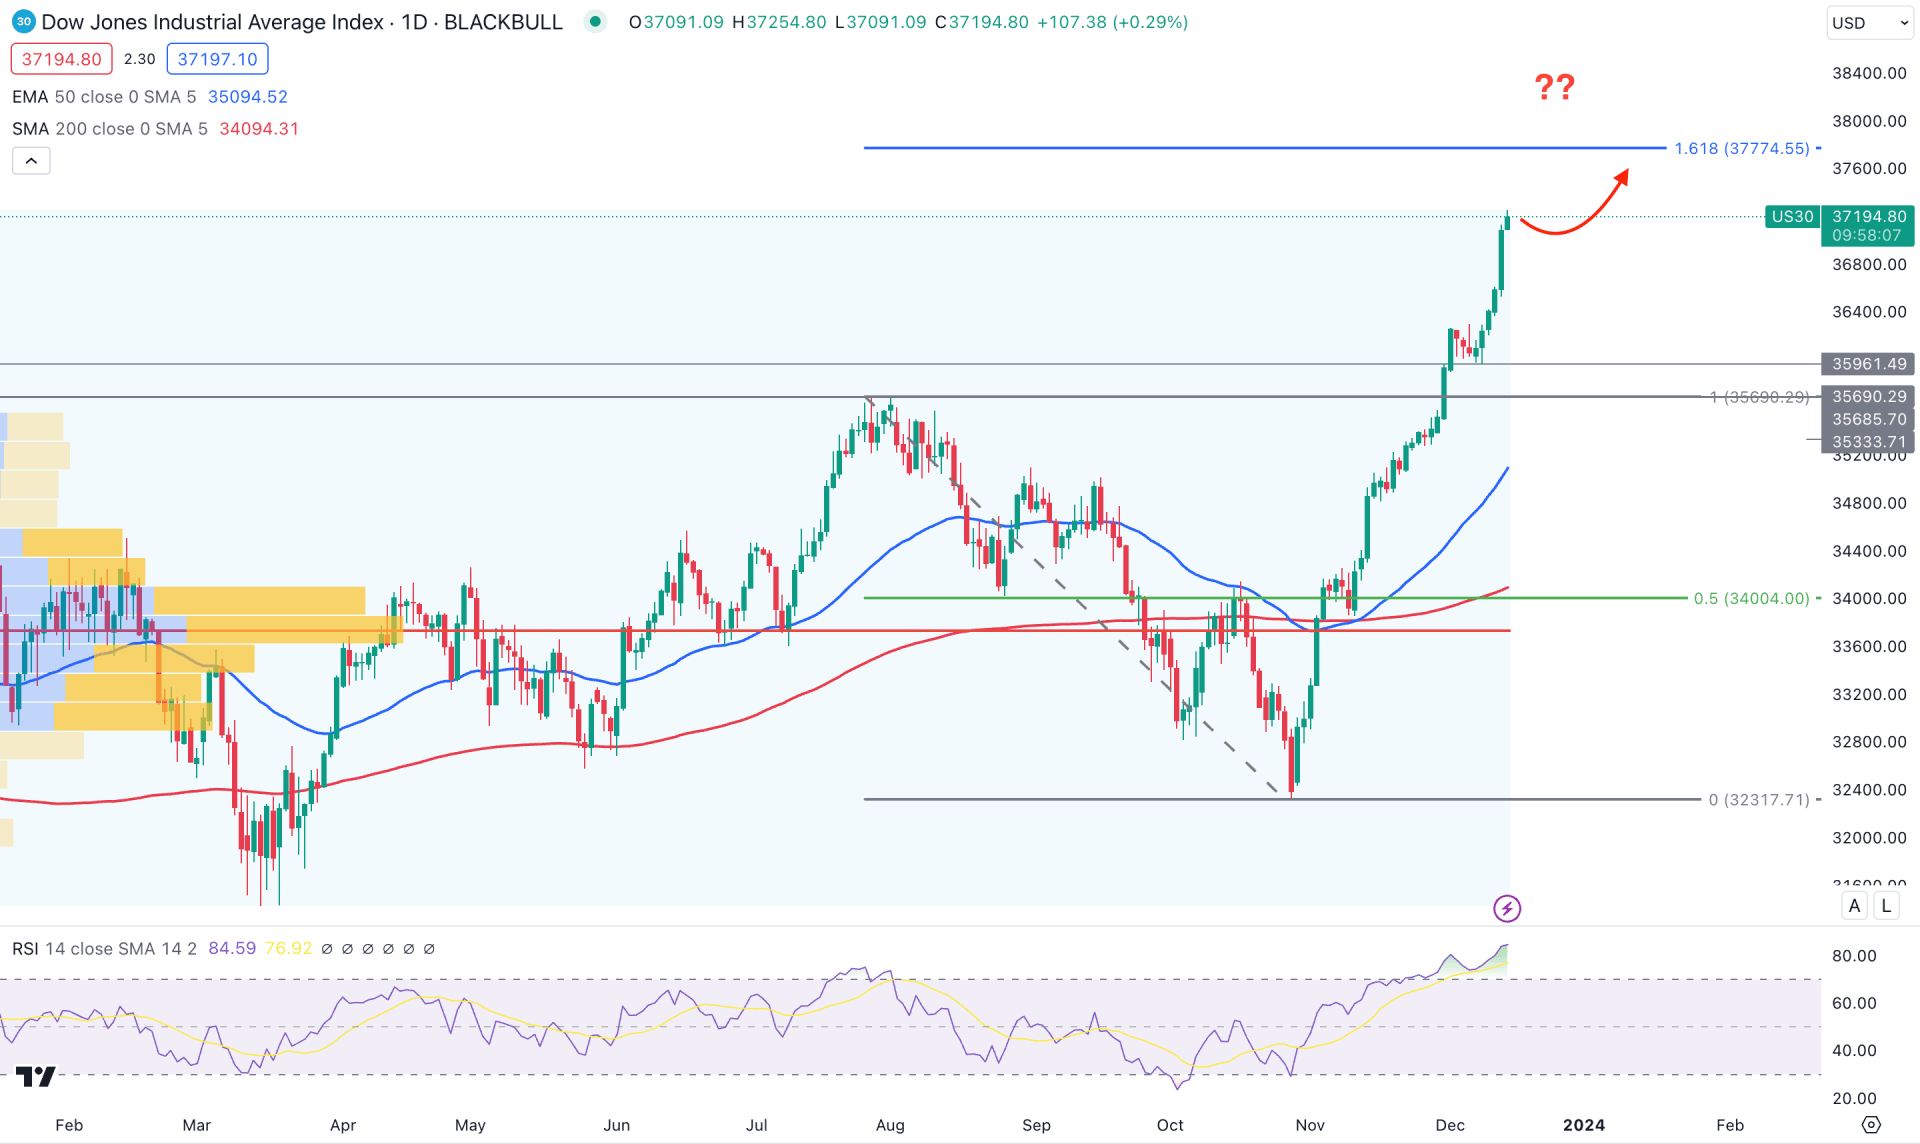
In the daily chart of DJIA, the overall market context is clearly bullish. Moreover, the current price trades at a record-high, which came with a solid fundamental background.
In the daily chart, the 161.8% Fibonacci Extension from the 35690.29 high to 32317.71 level is at the 37774.55 level, which is yet to be tested. Moreover, the buying momentum is supported by a Golden Cross formation in November.
In the monthly chart, the November close came by, eliminating the last three months’ losses. As a result, the December candle appeared as a bullish continuation pattern, which needs attention by observing the closing. The weekly time frame suggests an impulsive bullish leg with no subsequent correction. Therefore, investors might expect a bearish correction in the coming days, even if the broader market direction is bullish.
The downside correction is potent from the visible range high volume formation, where the most active level since the 2023 beginning is at the 33732.71 level. As the current price trades 10% higher from the high volume level with no significant downside correction, we may expect downside pressure in the coming days.
Based on the daily outlook of DJIA, an ongoing bullish trend could offer a decent trend trading opportunity. In that case, investors should closely monitor the intraday price action, where the primary target would be to test the 37774.55 level.
However, a bearish correction is patent as the current price is at a record high with an overextended price action above the 35000.00 level. In that case, investors should monitor how the price reacts after reaching the dynamic 50-day EMA from where a bullish rebound could happen. A bearish break with a daily close below the 36284.36 level could limit the gain and lower the price towards the 35094.47 static level.
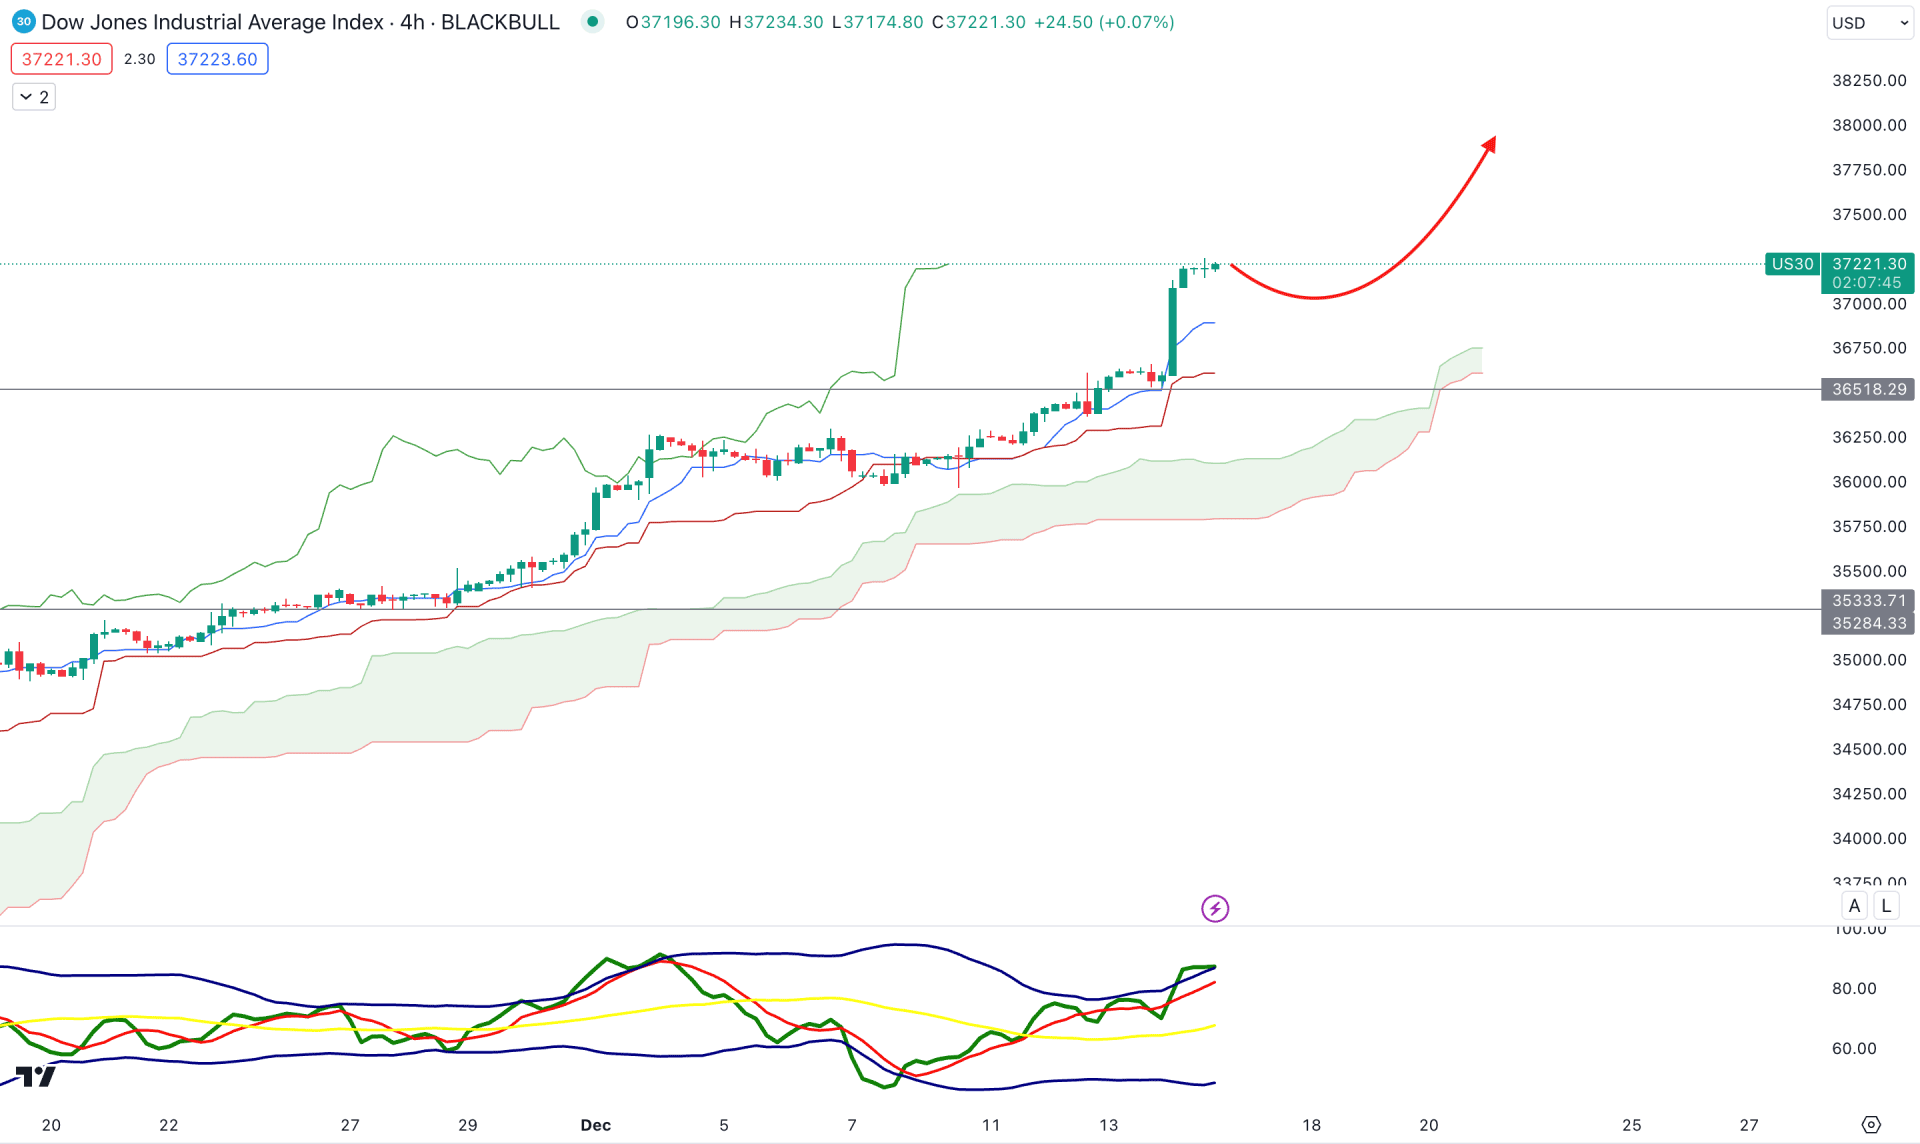
In the H4 chart, the overall market momentum is bullish as the current price remains stable for a considerable time after the Ichimoku Kumo Cloud. Moreover, the future supports the bullish continuation pattern, which could form where the Senkou Span A is above the Senkou Span B.
Moreover, the Traders Dynamic Index (TDI) suggests a trend continuation opportunity as it remains stable above the 50.00 neutral line.
Based on the current market outlook, a downside correction might appear, but the bullish continuation is valid as long as the price trades above the dynamic Kijun Sen level. In that case, the upward direction might extend the price towards the 38000.00 psychological level.
On the other hand, a bearish H4 candle below the Ichimoku Cloud low could limit the gain and lower the price in the coming days.
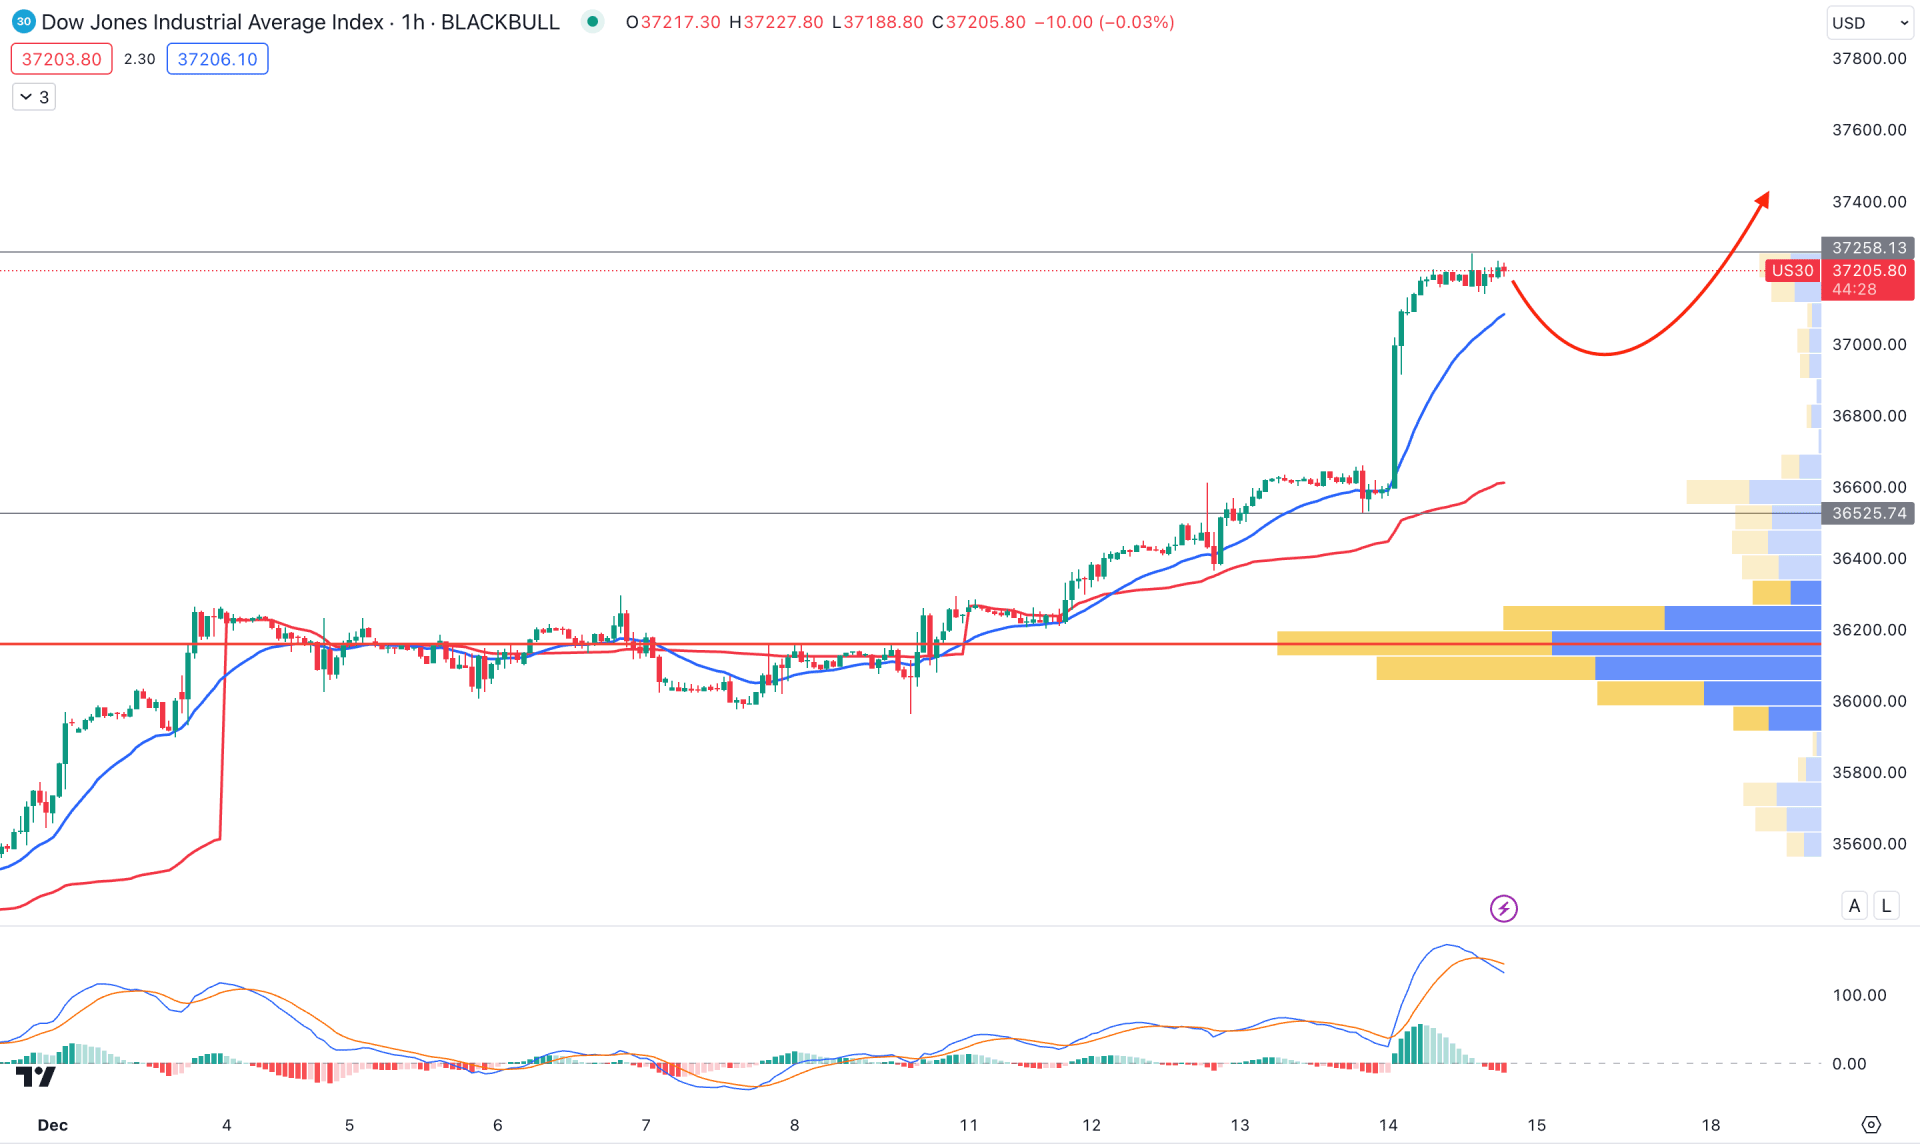
In the H1 timeframe, a strong bullish trend continuation is present as the current visible range high volume level is below the current price. Moreover, the dynamic Kijun Sen is below the current price, working as a confluence bullish signal.
In the secondary window, the MACD Histogram moved below the neutral line, while the signal line was at the overbought zone.
Based on this outlook, the bullish trend is solid, and there is no sign of an overbought condition. In that case, investors might expect a long opportunity once the correction is over.
Based on the current market structure, the DJIA bullish momentum is solid, as there is no sign of exhaustion at the all-time high level. In that case, a high probable buying opportunity might come after forming a solid bullish rejection from intraday dynamic levels.


