
Published: June 26th, 2025
As President Trump stated that the Israel-Iran war was essentially "over" for the time being, US equities sank on Wednesday. Meanwhile, Fed Chairman Jerome Powell emphasized that the central bank continues to be analyzing the impact of Trump's levies before agreeing to lower interest rates.
The S&P 500 concluded the trading day almost flat, barely below its history level, while flirting with its own record highs. In the meantime, the Dow Jones (DJI) dropped just above 100 points, or around 0.3%.
As Powell's day two of legislative testimony prior to the Senate Banking Committee began, stocks lost momentum. Amid demand from the GOP side, particularly from Trump himself, to lower prices, he became embroiled in a dispute with Republican senators.
Fed Chairman Jerome Powell stressed that the question of whether tariffs will cause inflation is still up in the air. He also added that the central bank is monitoring forthcoming economic reports to see how they will affect monetary policy.
The markets reacted well to Powell's statement the day before, in which he alluded to the possibility of a rate reduction as faster instead of later.
Investors will be watching Friday's Personal Consumption Expenditures (PCE) paper, the Fed's favorite inflation indicator, attentively for hints about the direction of monetary policy. His comments set the tone for this release.
Let's see the upcoming price direction from the Dow Jones (DJI) technical analysis:
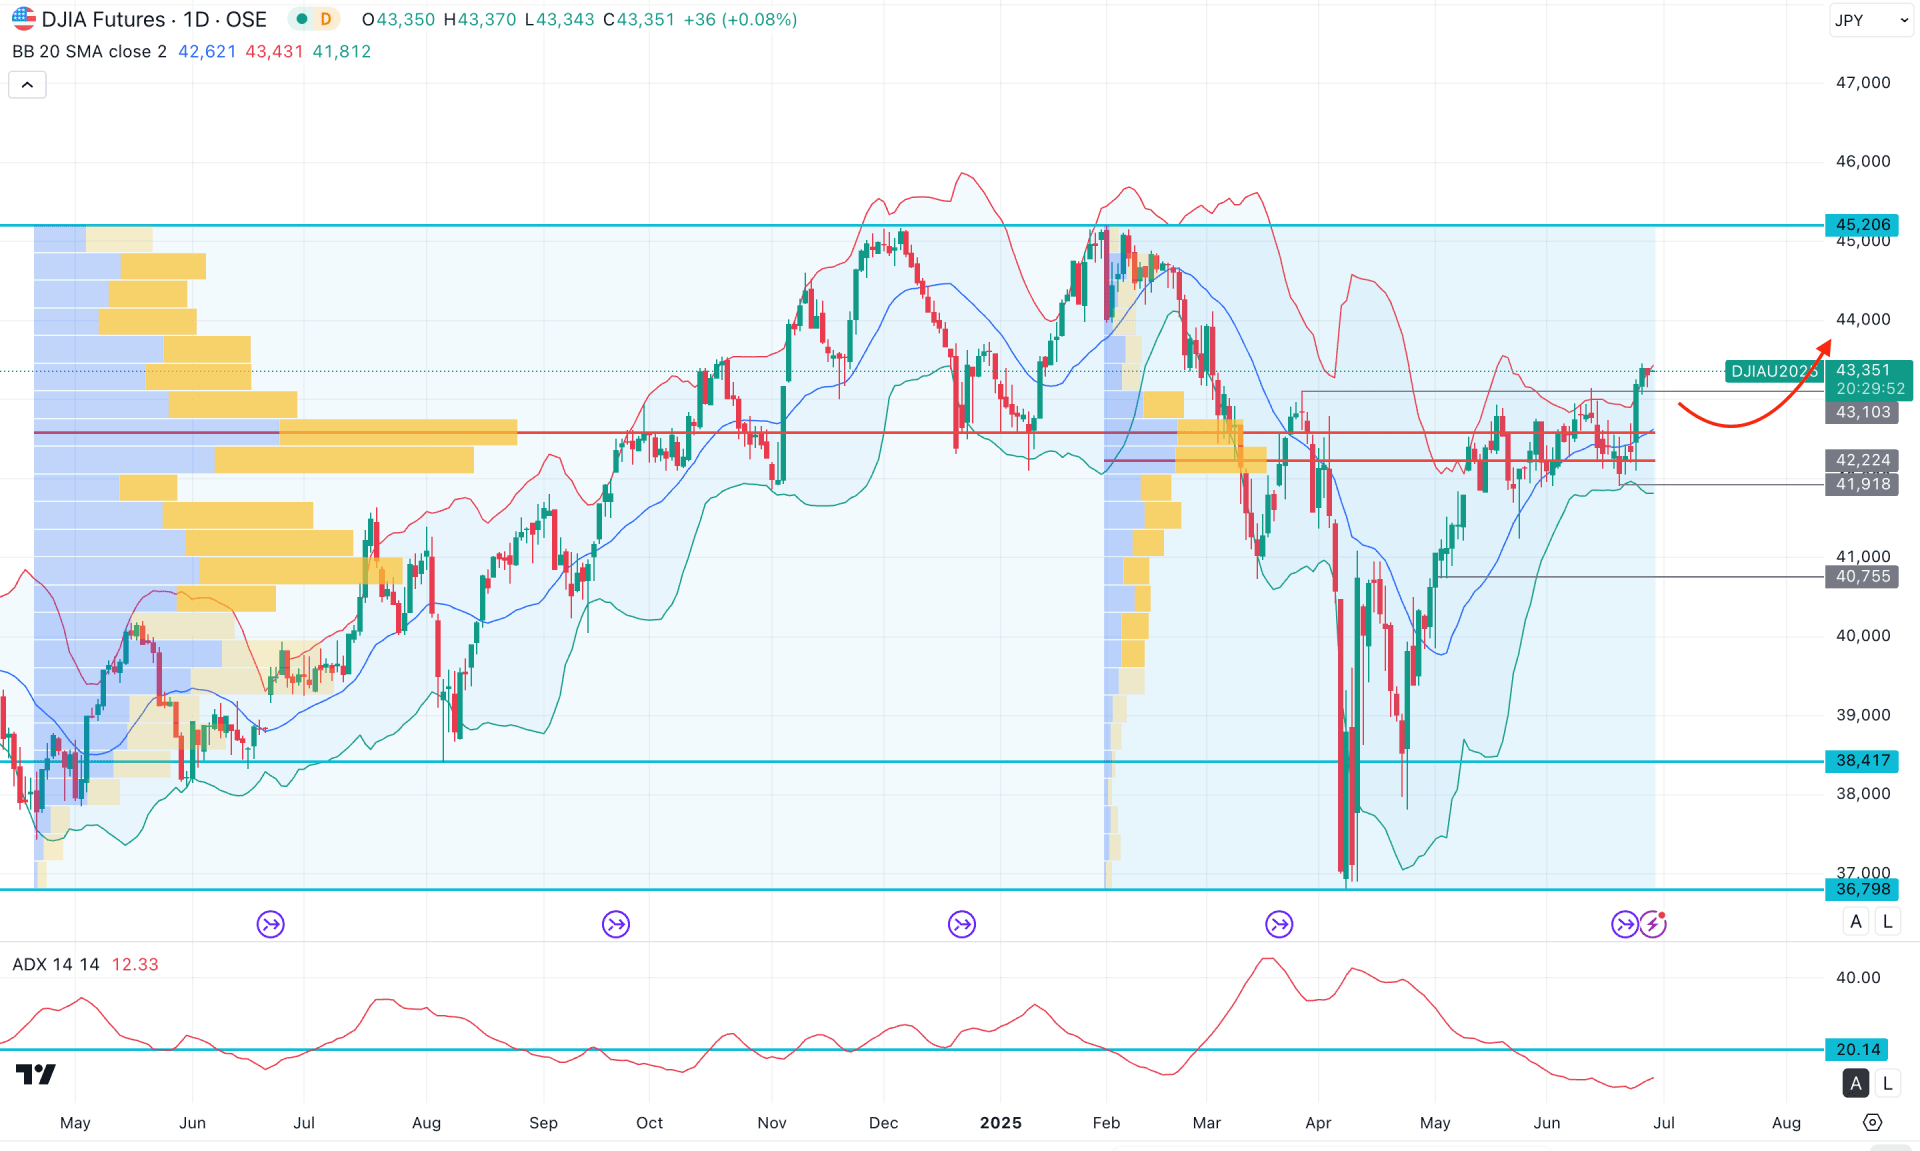
On the daily chart of the DJI, the recent price action shows massive buying pressure from the April 2025 low. The bullish V-shaped recovery from the multi-month low, followed by a consolidation near the top, signals the possibility of further upward pressure in this instrument.
In the higher timeframe, a strong bullish recovery is visible on the monthly chart, where the price bottomed out and rebounded in April 2025. Since then, the price has continued to rise, breaking above the two-month high. A positive close in June above the 42,971.00 level could mark a significant bullish milestone.
In the weekly timeframe, the trend also shows bullish continuation, as the most recent candle is trading higher after a period of consolidation. As long as the price remains above the 41,932.00 rectangle low, investors may anticipate further gains toward the 45,000.00 resistance level.
In terms of volume, buying pressure remains strong. The largest activity level since May 2024 is around 42,607.50. Another notable high-volume level from February 2025 is at 42,260.11. Both levels are below the current price and fall within the consolidation zone, indicating potential institutional interest in this price area. Any bullish breakout from the current consolidation could be supported by institutional activity.
On the main price chart, a sideways market is evident, as the Bollinger Bands have squeezed prior to a breakout above the upper band, accompanied by a bullish daily close. Currently, the price is consolidating near the upper Bollinger Band, which may signal a short-term correction before the next upward swing.
Meanwhile, the Average Directional Index (ADX) has dropped below the 20.00 level, suggesting corrective price action. In other technical indicators, the RSI is hovering between 50.00 and 70.00 after a bullish rebound, supporting a mildly bullish bias.
Based on the daily market outlook, the Dow Jones has a high probability of continuing upward pressure, potentially reaching the all-time high around 45,200.00. Investors should monitor the price action around the upper Bollinger Band area, as a correction may occur before forming another bullish leg. A potential long opportunity may arise if the price retraces toward the mid-Bollinger Band at 43,103.00 and shows a bullish daily candle near the 43,000.00 or 41,900.00 levels.
Alternatively, a bearish trading scenario could unfold if the price falls below the 41,918.00 level with a strong bearish daily close. In that case, the price could extend losses toward the 40,000.00 psychological level, with a further downside target near 38,417.00.
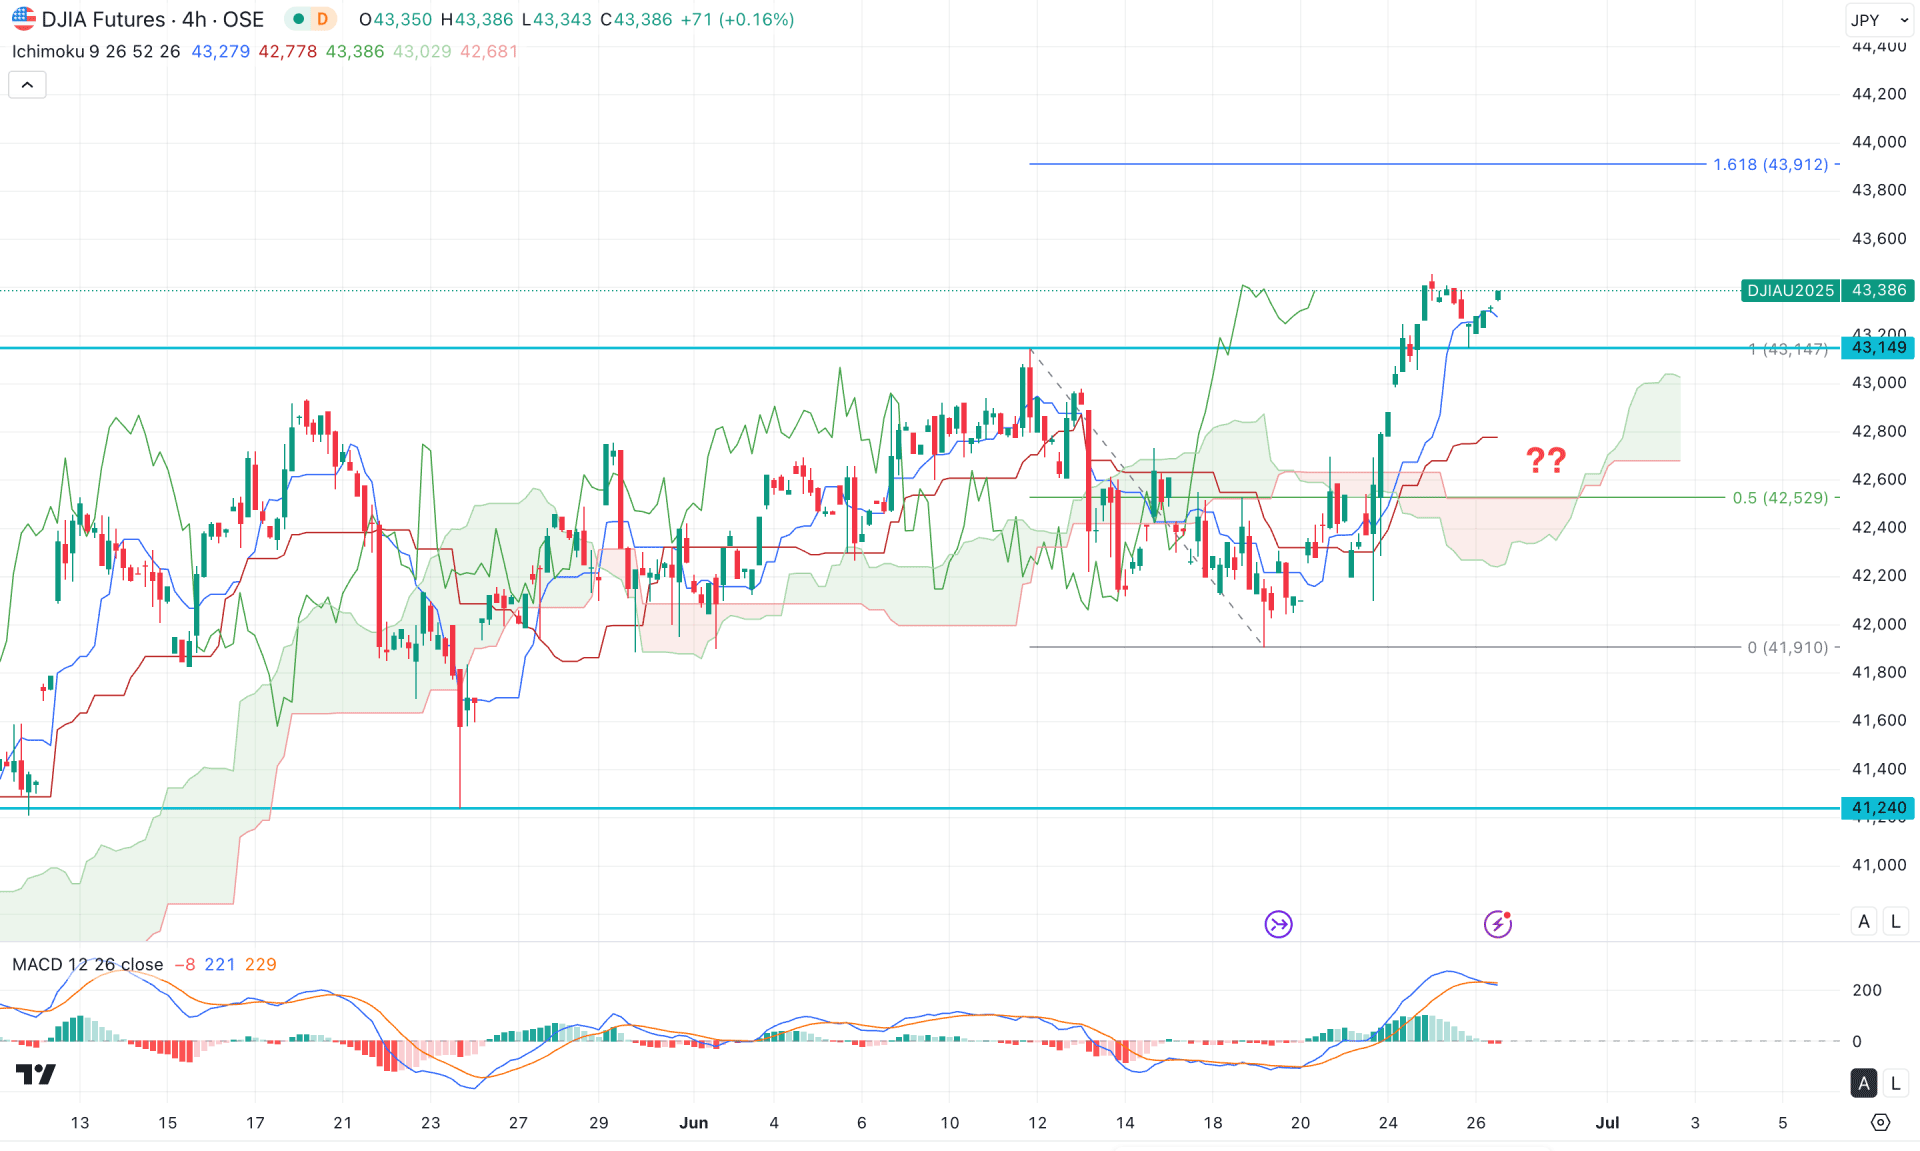
In the H4 outlook, the price shows a strong bullish reversal with stable price action above the dynamic Ichimoku Cloud zone. Primarily, as long as the Cloud zone holds, further upward pressure may follow.
Additionally, the Future Cloud appears positive, with both Senkou Span A and Senkou Span B sloping upward.
However, the MACD signal line has flattened, and the most recent movement shows a sideways trend with a bearish crossover. Meanwhile, the MACD histogram has flipped below the neutral level, suggesting weakening bullish momentum.
Based on the four-hour market outlook, investors should monitor how the price reacts to any intraday dips before a potential bullish continuation signal emerges. A temporary bearish move below the 42,989.00 level, followed by a strong rebound, could offer a short-term long opportunity targeting the 44,000.00 area.
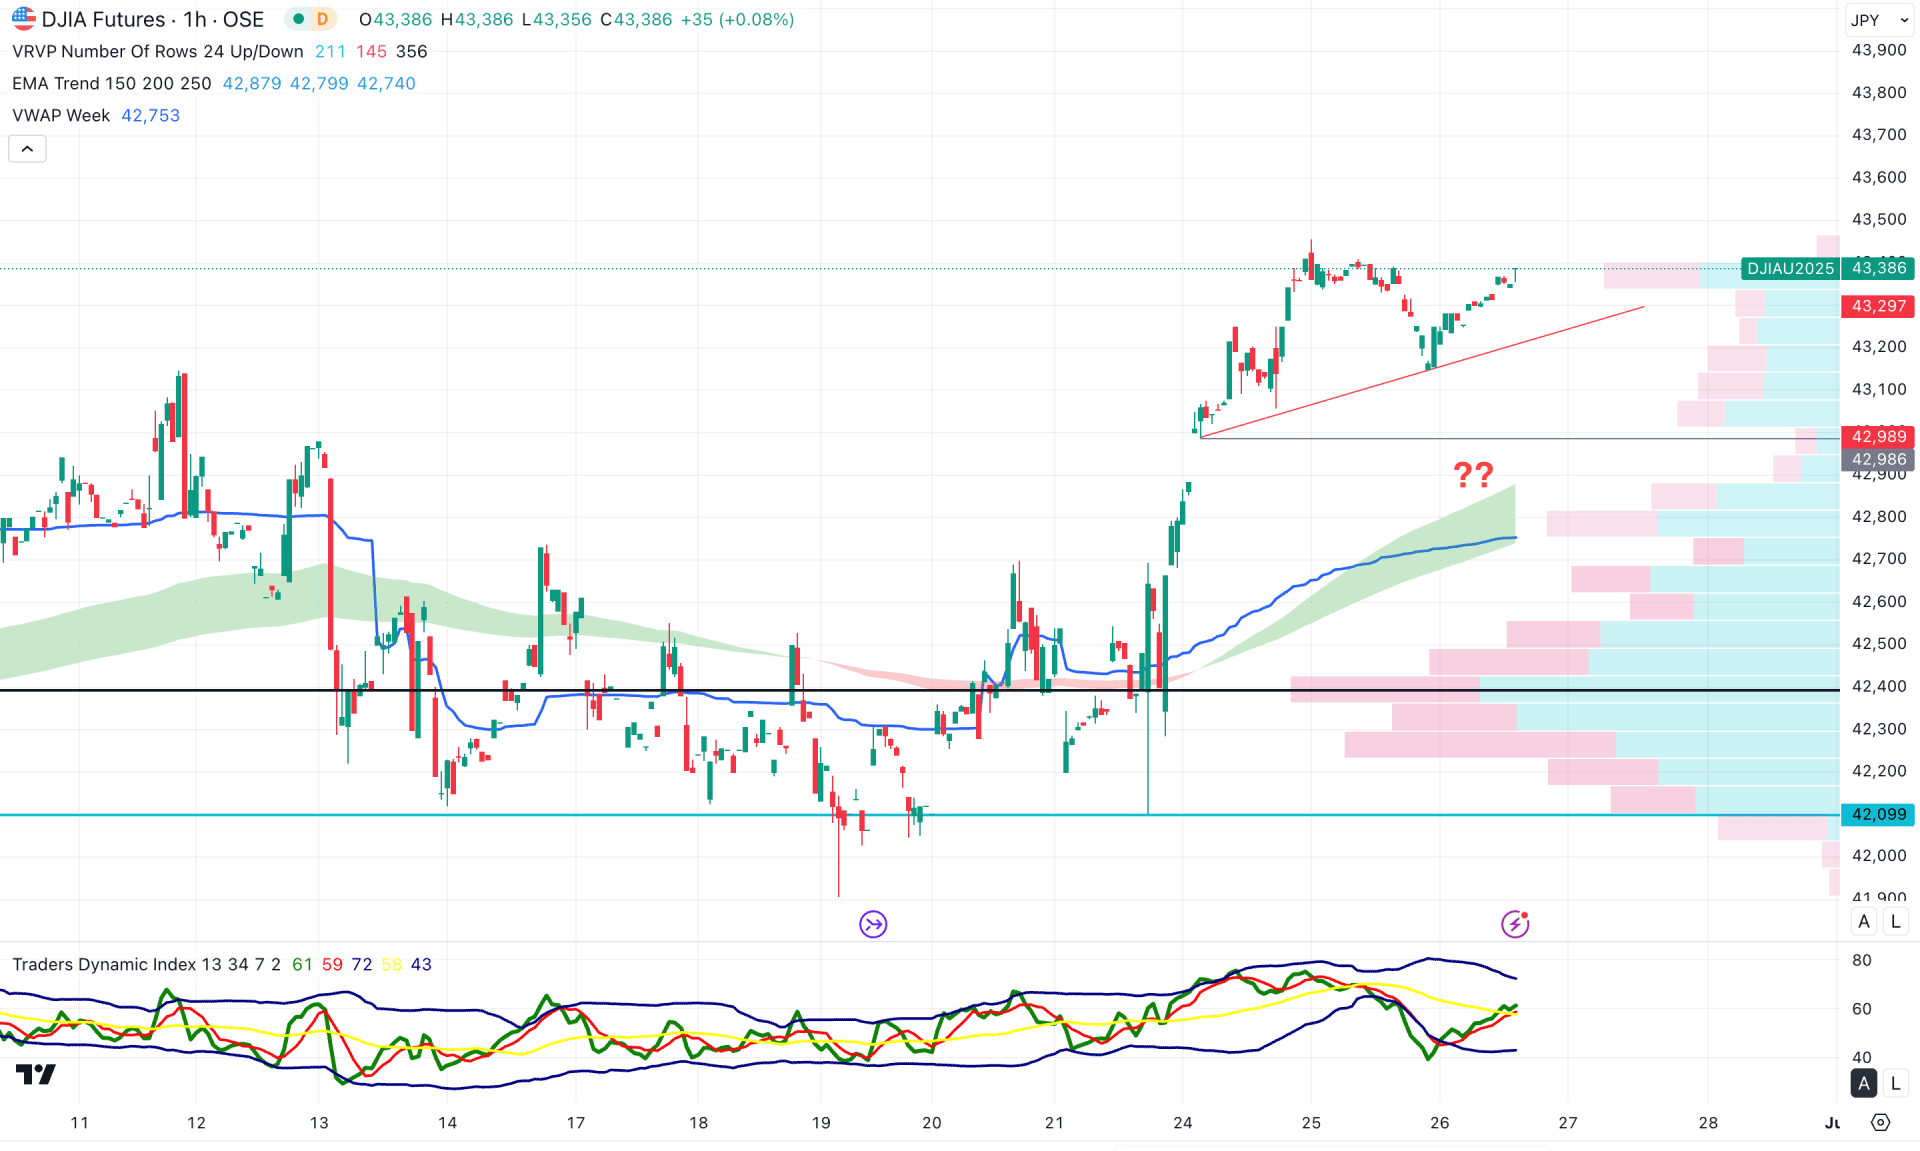
In the hourly timeframe, the ongoing buying pressure is solid, as the price continues to move higher above key dynamic levels. The visible range high-volume node is positioned below the current price, in line with the moving average. This indicates confluence buying pressure in the market, which may offer additional long opportunities.
In the secondary indicator window, the Traders Dynamic Index (TDI) has moved to a lower peak area and found a bottom. However, the TDI level is still below the 50.00 threshold, so a bullish rebound is required before confirming a long opportunity.
Based on the hourly market outlook, the price is still trading above the trendline support, suggesting more downside correction may be pending. The primary objective is to watch for a price reaction at the trendline support, as it may offer liquidity before initiating a long position.
On the other hand, extended selling pressure below the 42,099.11 level, with a bearish engulfing candle, could lead to a further decline toward the 40,000.00 level.
Based on the current price action of the Dow Jones (DJI), the broader market direction remains bullish. Investors should closely monitor the intraday price action, as a short-term correction may still be in play. Any bullish reversal from the near-term support area could present a high-probability long setup targeting the existing all-time high level.


