
Published: March 11th, 2026
In this week's earnings report, DG's top line is expected to increase, but its bottom line will decrease. At $10.78 billion, the Analysts' Average Estimate for revenues indicates a 4.7% rise over the same period of the previous year.
Along with improvements in digital capabilities, Dollar General's continuous store expansion and renovation projects probably had a significant impact. In addition to investing in remodelling initiatives like Project Renovate and Project Elevate, DG continues to open new locations.
On the other hand, persistent cost challenges and a still-stretched consumer environment may have continued to put pressure on fourth-quarter profits. Core customers are still cautious shoppers who frequently make fewer purchases each trip. Basket expansion may be constrained by this pattern.
At the same time, margins might have been affected by increased costs for store operations, maintenance, and utilities. Therefore, a conservative consumer environment and high operating costs may have limited earnings growth in the quarter, even if top-line developments remain positive.
Let's look at another aspect of this instrument from the DG technical analysis:
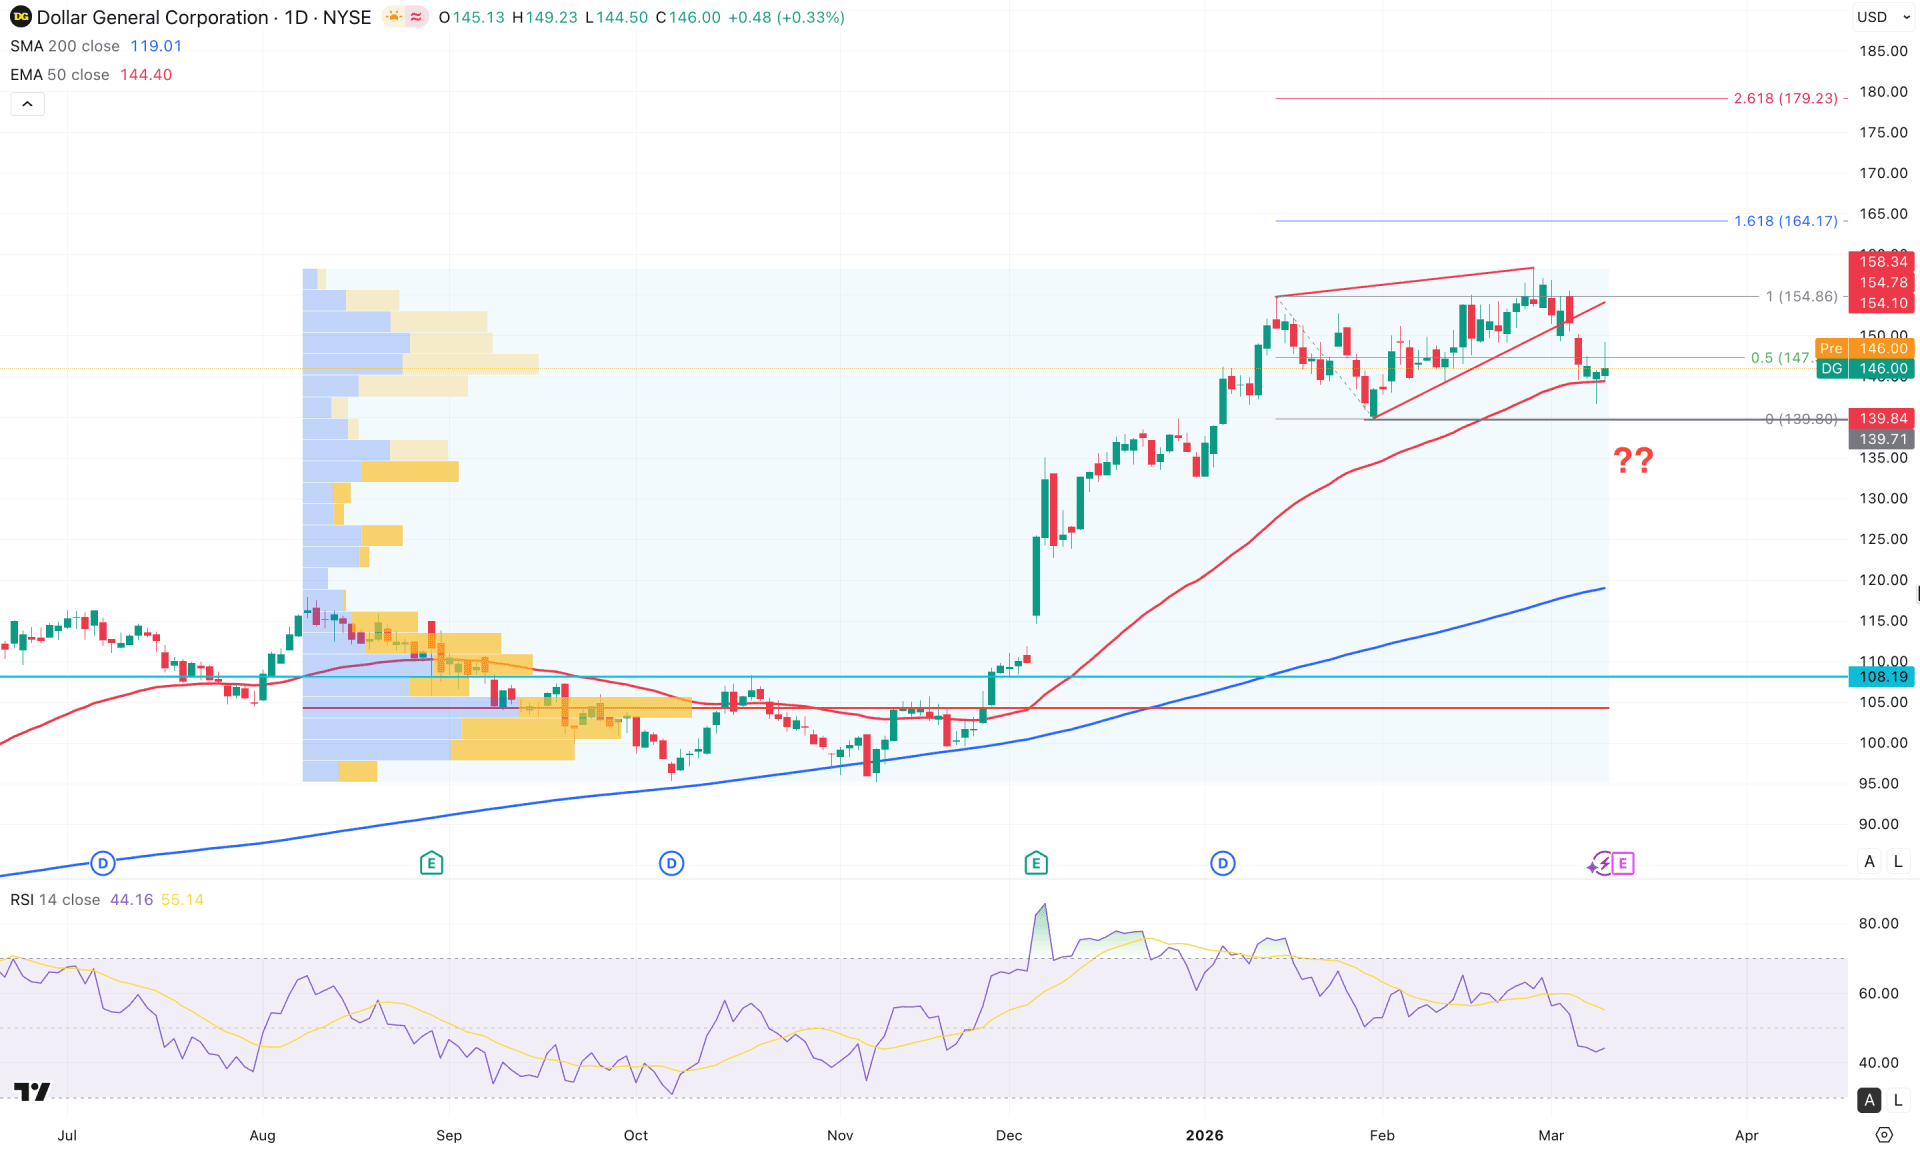
In the daily chart of DG, the major market momentum is bullish as the price has been rising for a considerable time. However, the latest price action suggests a potential rising wedge breakout, with downside recovery possible.
Looking at the higher timeframe, a strong bullish trend is visible on the monthly chart, with consecutive 4 bullish closes. Moreover, the latest candle is trading as an inside bar, with the existing monthly low protected. In the weekly timeframe, a bearish break is visible after a consolidation, which needs proper validation before considering a trend change.
In terms of the volume, the price is trading in the buyers' territory as the high volume line is marked below the current price area. However, the wider gap suggests a potential bearish correction.
In the main price chart, the 200-day SMA signals bullish continuation, as it remains below the current price and hasa a bullish slope. Moreover, the 50-day EMA is acting as immediate support, as a bullish reversal candlestick is present at this line.
On the other hand, the Relative Strength Index (RSI) shows increasing downside pressure as it has moved below the 50.00 neutral level. The bearish pressure is further supported by a potential divergence formation on the RSI line.
Based on the daily market outlook, the potential falling wedge breakout requires further confirmation before considering a short opportunity. Immediate support is at the 139.84 level; it must be broken to validate the selling signal.
Investors should closely monitor how the price behaves in this area, as consolidation at this level, combined with a bullish reversal from the immediate support, could create a potential long opportunity targeting the 164.17 Fibonacci extension level.
On the other hand, immediate bullish pressure with a valid rejection from the wedge breakout point could create a minor selling opportunity targeting the 128.00 level.
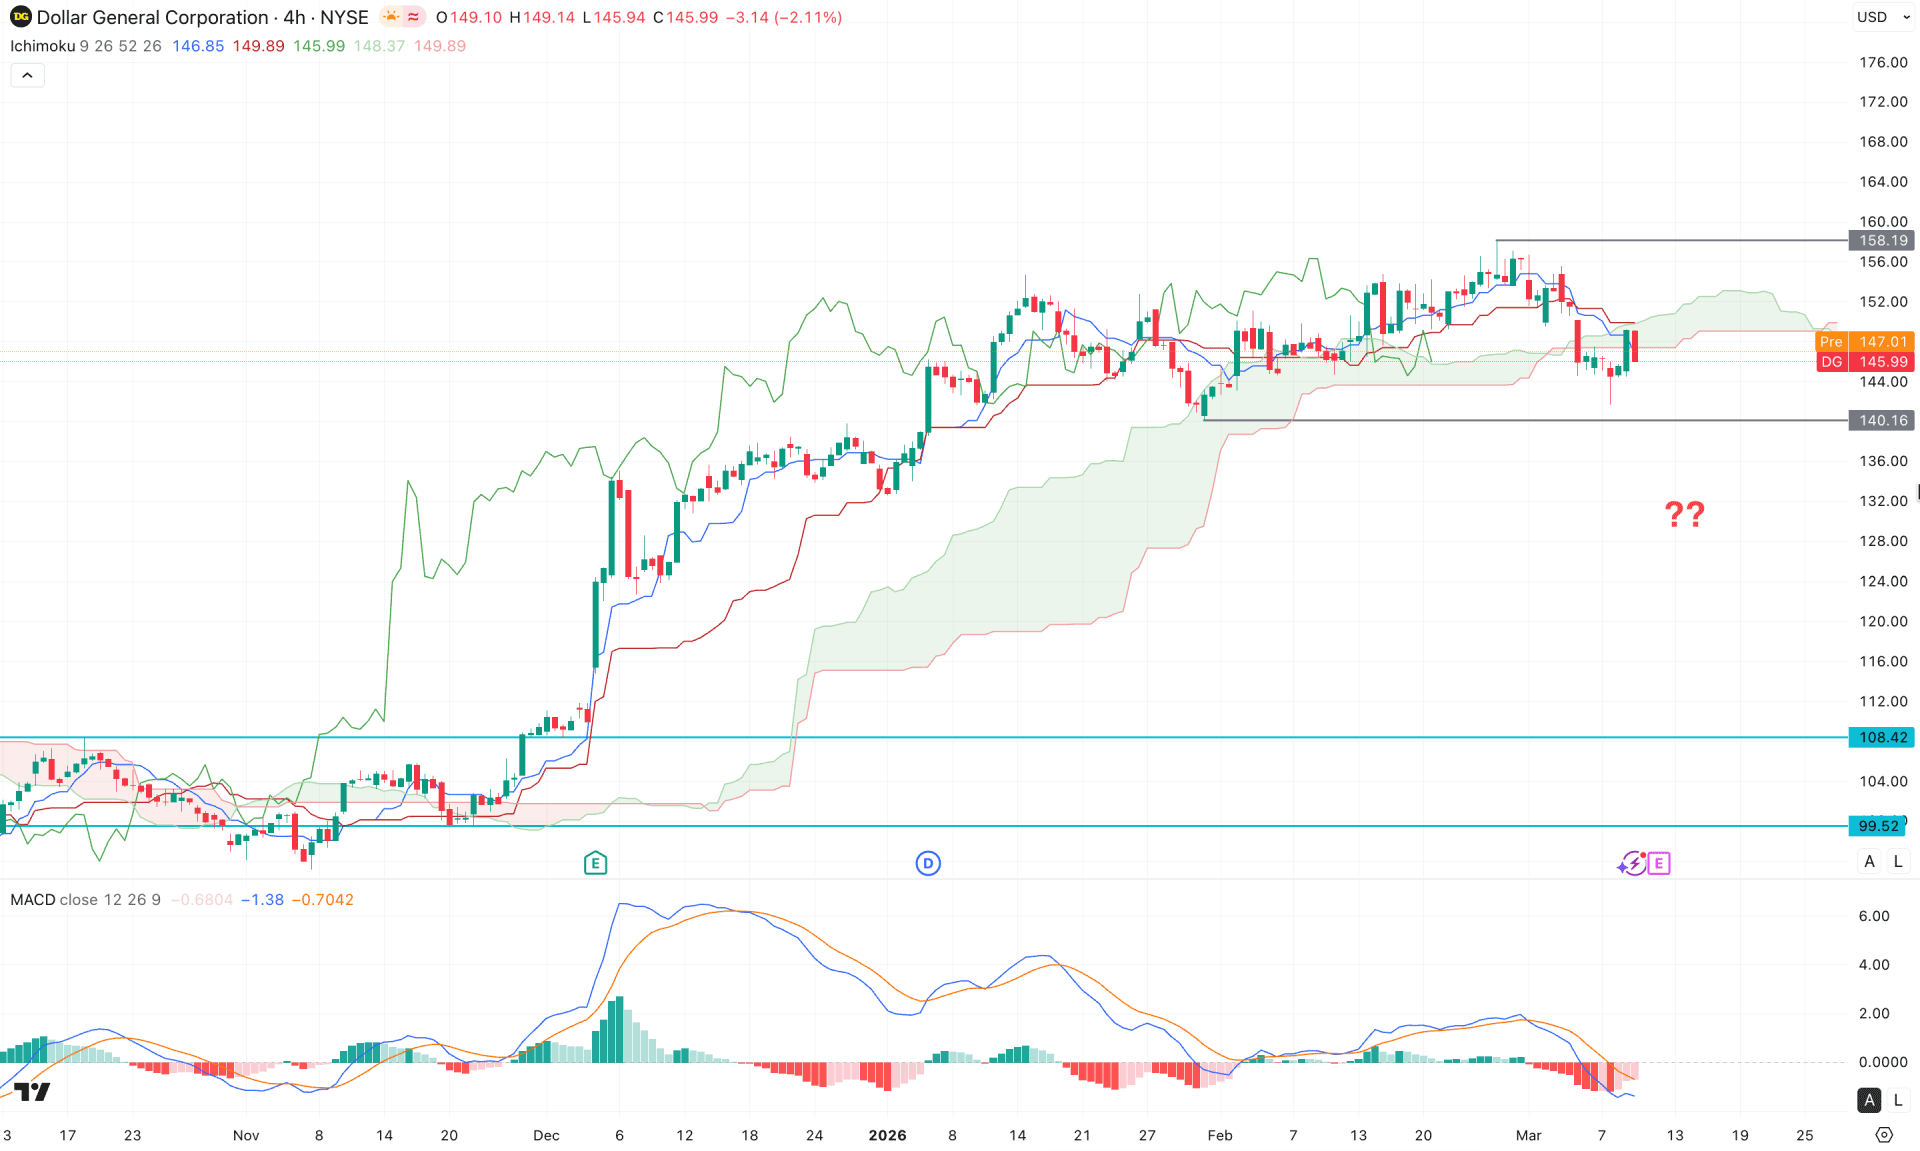
In the four-hour timeframe, the price is trading around the cloud area, where the existing bullish momentum has weakened. Although the recent price action has formed multiple bearish four-hour candles below the cloud, no significant swing low has been formed yet.
In this context, investors should remain sceptical before opening a trading position, as more confirmation is needed from the price action. The future cloud has flipped position; however, bearish rejection from the dynamic lines signals a minor downside correction. Moreover, the MACD histogram has remained below the neutral line for a considerable period, which could act as an additional bearish signal.
Based on this outlook, a new bearish four-hour candle below the 140.16 level could provide a potential short opportunity targeting the 108.42 level.
On the other hand, investors should monitor how the price reacts near the short-term support area, as a strong sell-side liquidity sweep followed by a bullish reversal above the cloud is possible. In that case, the price could extend the buying pressure above the 180.00 level in the coming days.
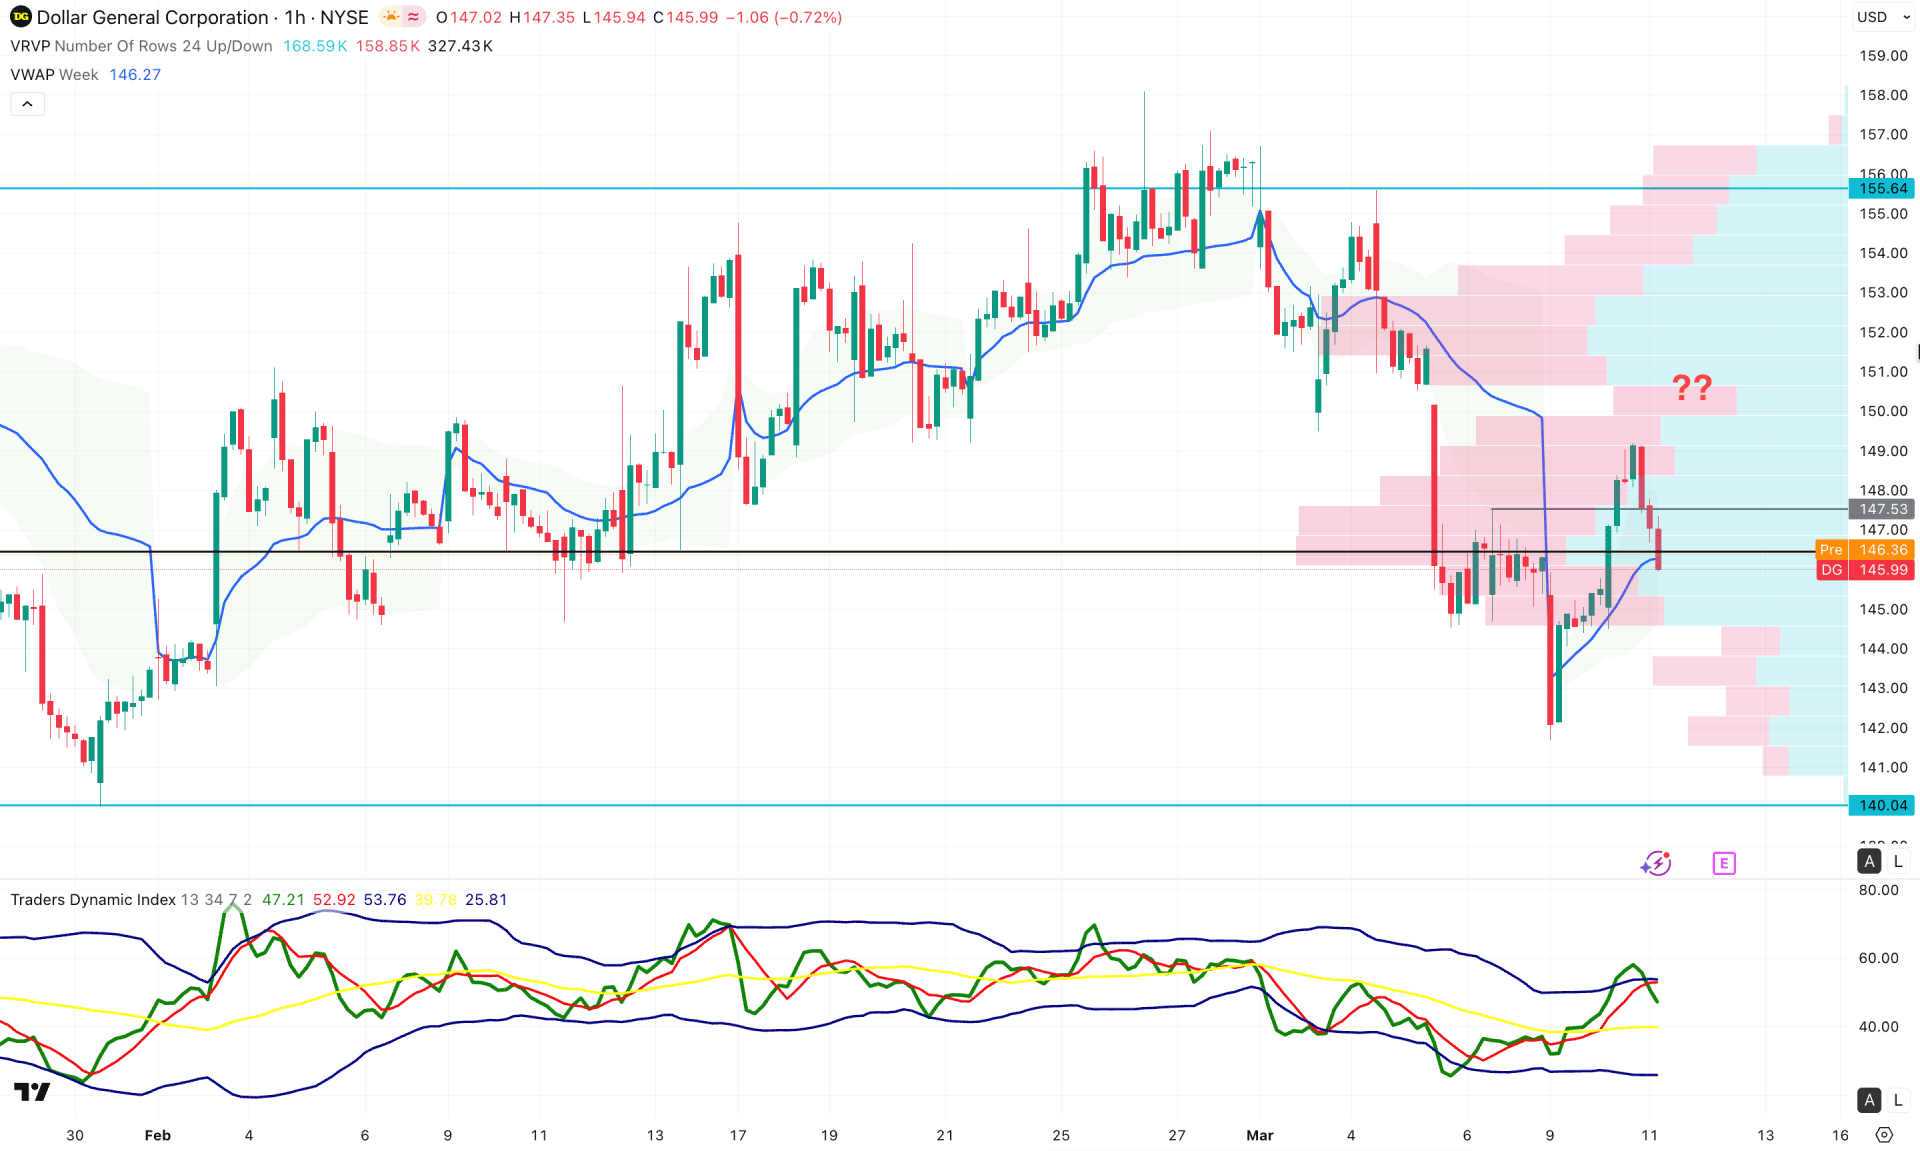
In the hourly timeframe, a strong sell-side liquidity sweep is visible at the 147.53 resistance level, which may work as a short opportunity.
In the indicator panel, the Traders Dynamic Index (TDI) shows a rebound from the extreme bullish condition, although the current TDI line is still within the bullish zone. Moreover, the weekly VWAP line is aligned with the current price, signaling that additional confirmation is needed before opening a position.
Based on the hourly market structure, the primary focus is to look for short opportunities as long as the price remains below the existing swing high. Immediate support is at the 140.00 level, which must be broken before a long-term bearish bias forms.
On the other hand, a bullish breakout followed by stable price action above the resistance level could invalidate the bearish outlook.
Based on the current market structure, Dollar General is trading in the premium zone, requiring confirmation before opening a short position as part of a moderate correction. However, the long-term market momentum remains bullish, meaning that any bullish rebound from the daily support area could trigger further upside pressure.


