Published: May 28th, 2024
During the recent rally, the cryptocurrency market has witnessed substantial gains in numerous sectors. The memecoin sector witnessed significant gains in value during the previous week, propelled by the return of Roaring Kitty.
Following the weekend price decline of WIF, one whale sold 1.7 million tokens for a loss in order to acquire BONK and TREMP, a memecoin inspired by Donald Trump. This investor purchased WIF in March at $2.94 and sold for an average of $2.57.
Other large-scale investors, however, perceived the price decline as a favorable circumstance for purchasing. According to Lookonchain, a whale withdrew 1.83 million USDC from Coinbase to purchase the dog-themed token Dogwifhat via a new wallet. The investor acquired 227,896 WIF for $2.66 for 606,000 USDC and retained 1.22 million USDC for additional purchases.
Despite this, market analysts maintain that the token with a dog motif has further potential. On the WIF chart, the bull pennant pattern indicates that consolidation is nearing completion. Similarly, renowned crypto community trader Ansem hypothesized that WIF might be positioning itself for new peaks. By the end of the month, he predicts that Dogwifhat and Solana (SOL) will each have attained a new all-time high (ATH), signaling the conclusion of a "three-month period of bullish consolidation following the last leg up" and coinciding with Bitcoin's bullish trend.
Let's see the further aspect of this coin from the WIF/USDT technical analysis:
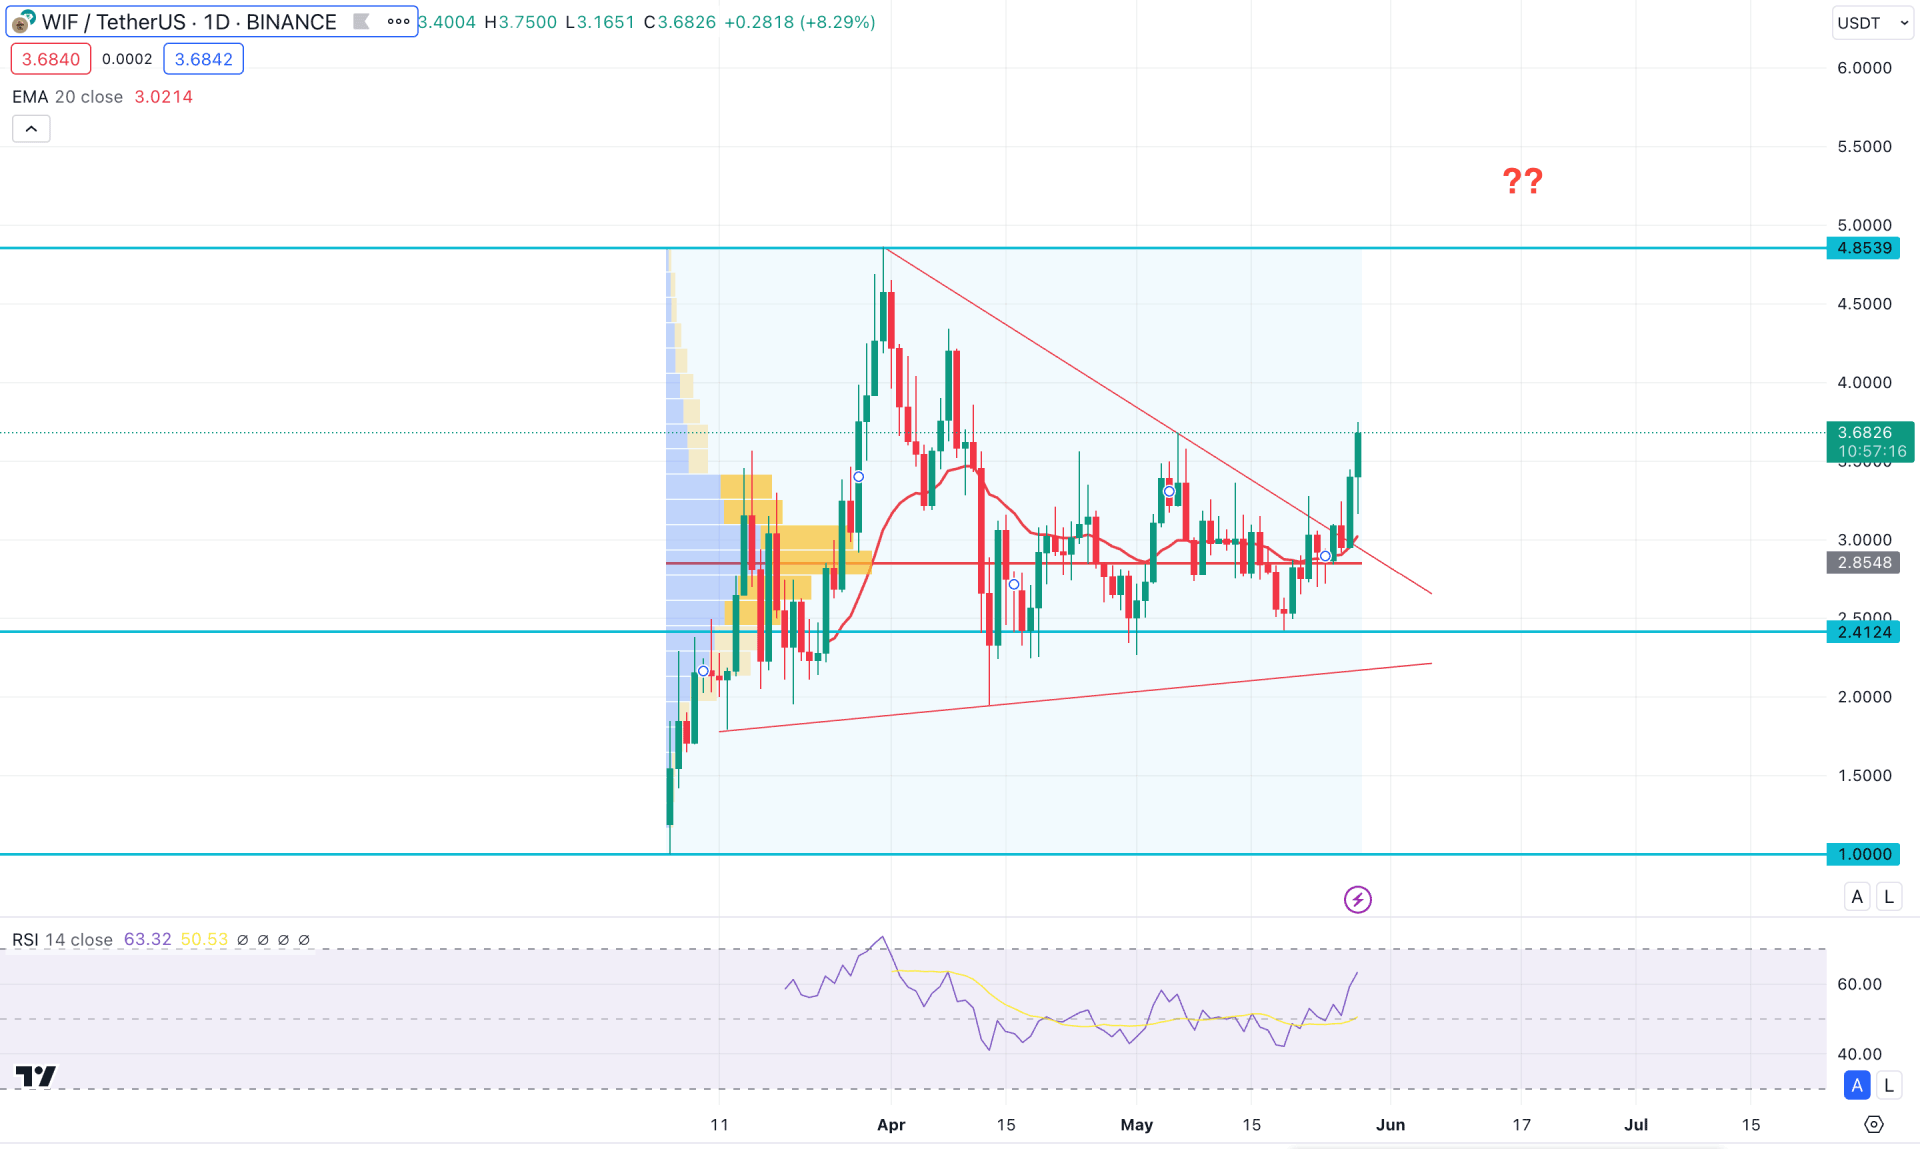
In the daily chart, the broader market context is bullish, where the most recent price showed a potential bullish breakout from the symmetrical triangle formation.
Looking at the weekly candlestick, the bullish two-bar candlestick formation from the near-term support supports the ongoing buying pressure. Moreover, the price increased from the congestion area, and resistance was at the 3.6852 high. In that case, investors should closely monitor how the price trades at this crucial high, which is a potential breakout point for bulls.
In the volume structure, the entire price action since the Binance launch is supported by bulls as the current price hovers above the high volume line. Moreover, the recent bullish breakout from the bullish order block came with a confluence bullish factor, where the static high volume level remains within the order block zone.
In the daily chart, the recent bullish breakout from the symmetrical triangle is the major long signal, supported by the rising Moving Average line. The dynamic 20-day Exponential Moving Average is the immediate support, which is acting as a near-term support above the 2.4124 static line. Therefore, a bullish continuation is highly possible as long as the current price hovers above the crucial dynamic support.
In the secondary window, the Relative Strength Index line shows the confluence buying pressure as the current level hovers above the 50.00 line. As the RSI is yet to reach the overbought 70.00 level, we may expect more room for bulls in the coming days.
Based on the daily outlook of WIF/USDT, the overall market momentum is bullish, where bulls have a higher possibility of reaching the 4.8539 key resistance level. Moreover, overcoming this line could open the room for reaching the 6.5884 Fibonacci Extension level before initiating a downside correction.
On the other hand, a failure to hold the price above the 20-day EMA line could be a challenging factor for bulls. Any immediate downside pressure with a bearish daily candle below the 2.4124 static line could make the entire price action obsolete. In that case, a downside possibility would open, targeting the 1.0000 psychological level.
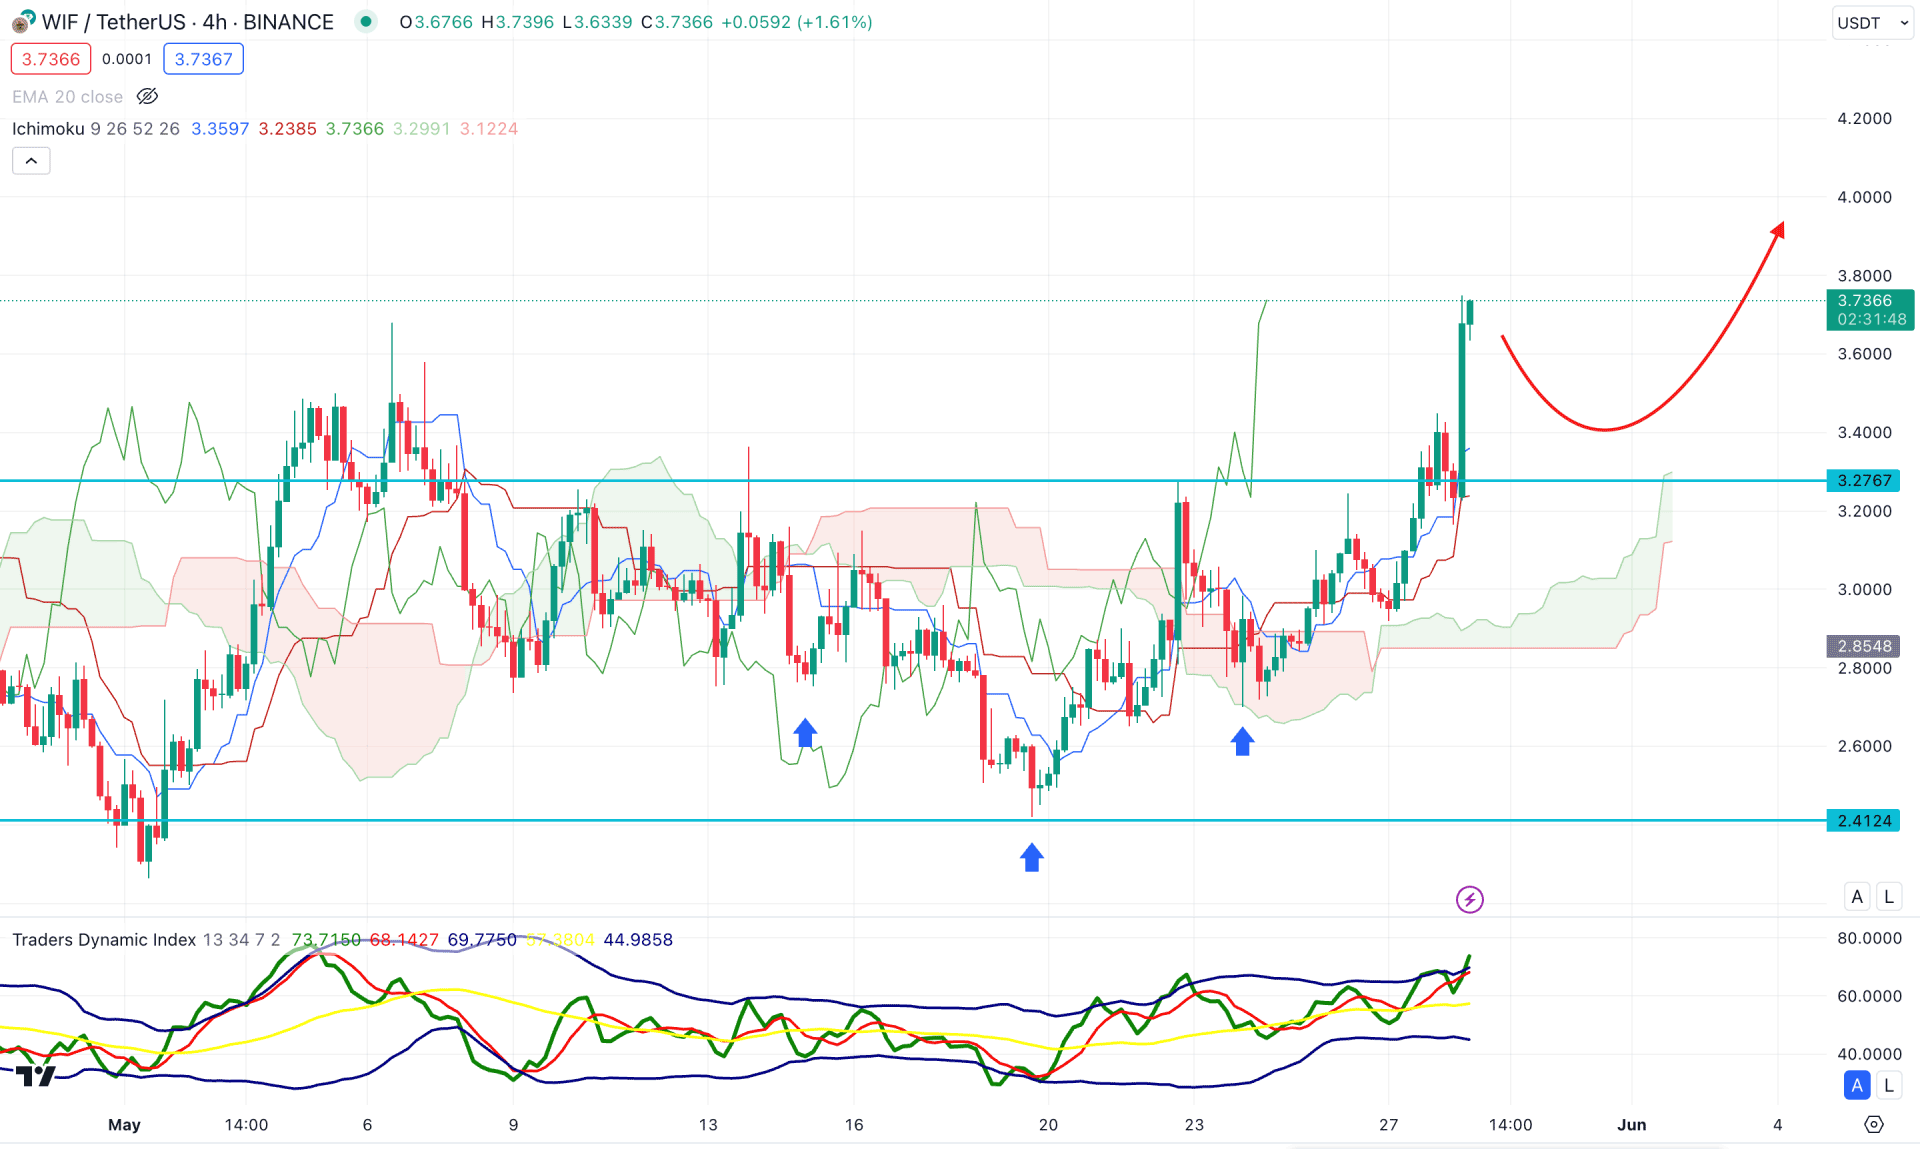
According to the Ichimoku cloud analysis, the WIF/USDT price may extend the buying pressure in the coming hours.
The ongoing buying pressure is valid from the Cloud breakout, supported by the valid breakout from the Inverse Head and Shoulders breakout. Moreover, the rising Senkou Span A and Senkou Span B indicate an additional long signal as both lines aimed higher from the near-term demand zone.
In the secondary window, the Traders Dynamic Index (TDI) indicates ongoing buying pressure, with the most recent line reaching the overbought zone.
Based on the H4 outlook, an ongoing bullish continuation is visible, where more upward pressure might come after forming a potential downside correction. However, a bullish continuation is highly possible as long as the current price hovers above the 3.0000 psychological line.
On the other hand, any immediate downside pressure could increase the possibility of reaching the dynamic cloud zone. Moreover, a bearish break below the 2.8000 level with an H4 close could extend the selling pressure toward the 1.5000 area.
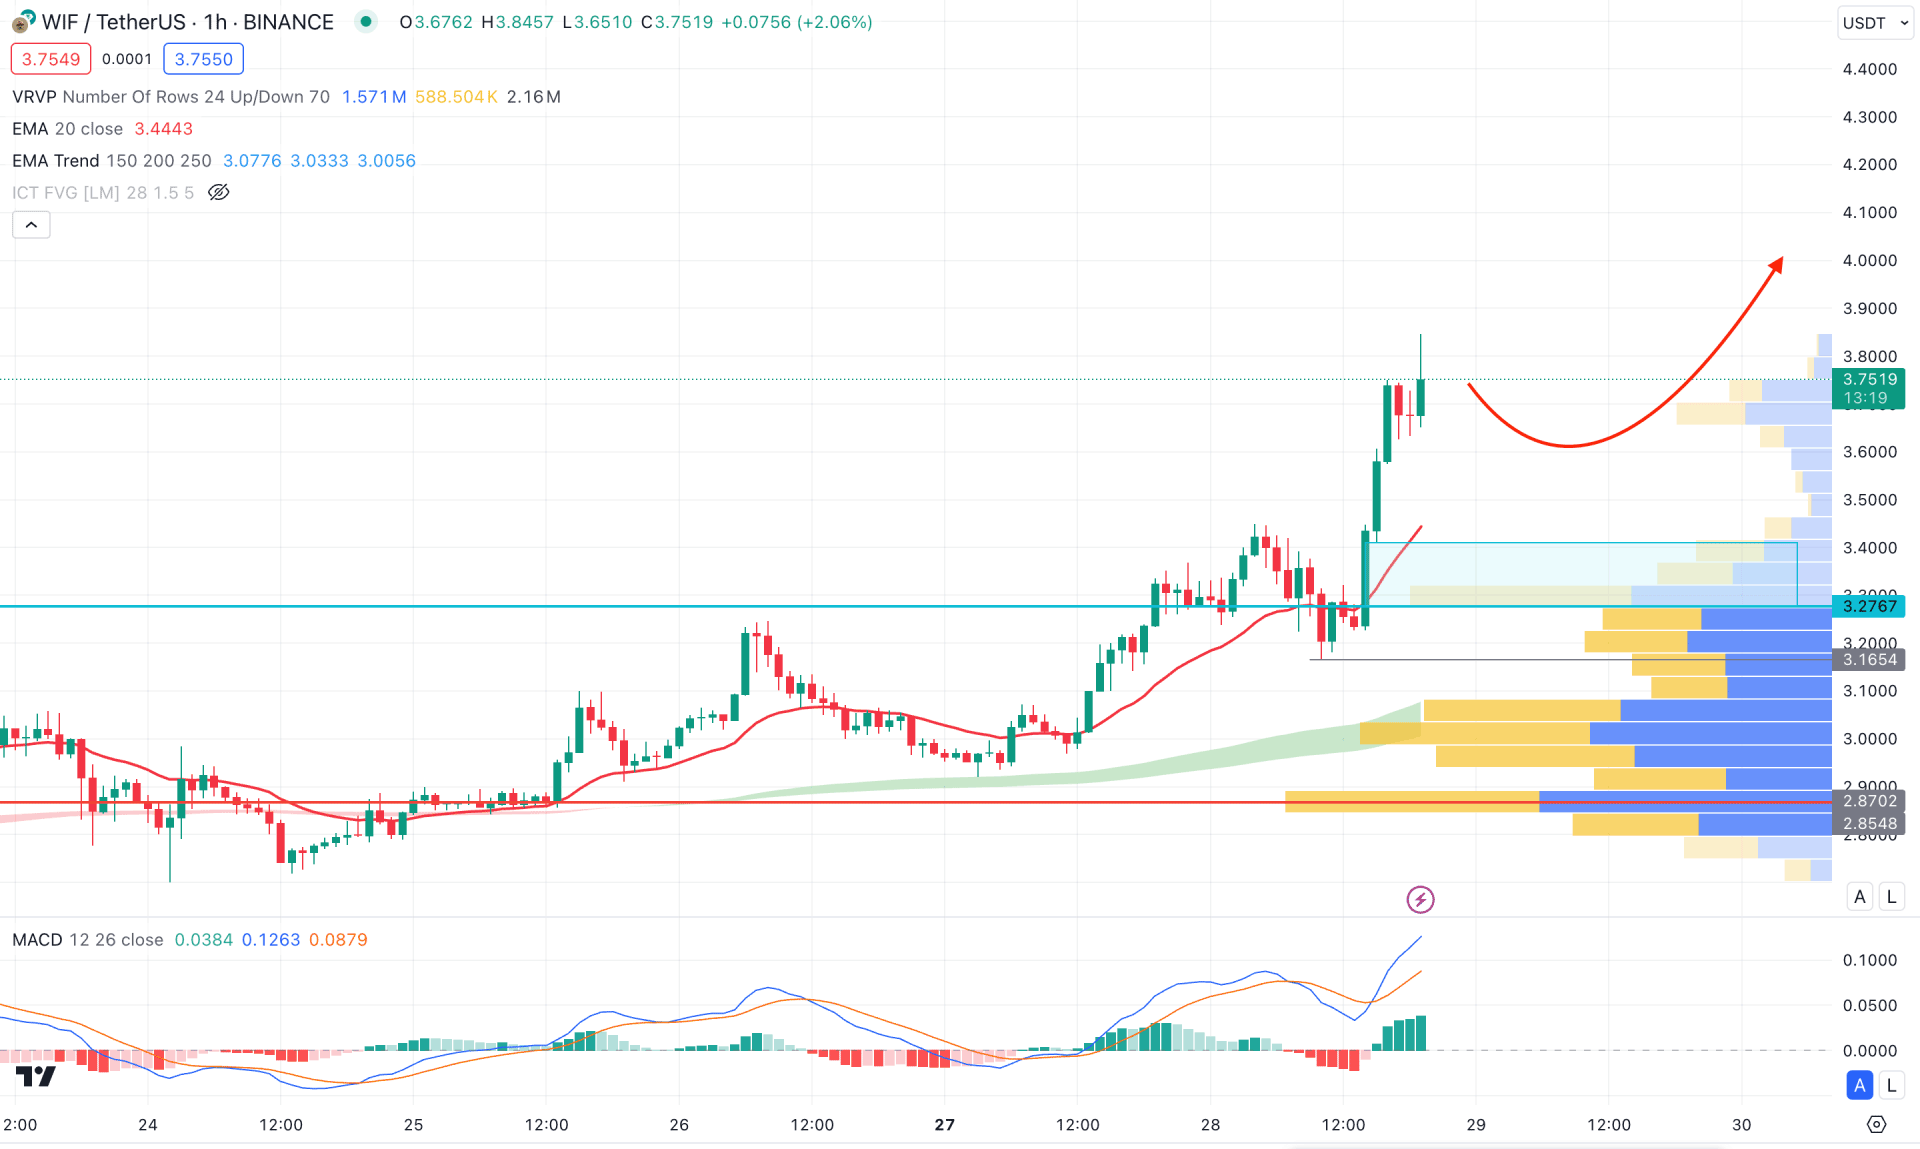
In the hourly timeframe, the overall market momentum is bullish, where the most recent price is overextended from the visible range to a high volume level. Moreover, the EMA cloud consisting of MA from 150 to 250 remains below the current price, acting as a major support.
Based on the hourly price of WIF/USDT, ongoing buying pressure might find a downside correction towards the 3.4102 to 3.2767 zone. However, a strong downside pressure with a bearish H4 candle below the 3.1654 level could signal a bearish reversal, targeting the 2.8702 high volume level.
Based on the ongoing buying pressure, WIF/USDT is more likely to extend the buying pressure in the coming days, where the main aim is to test the current all-time high level. In that case, investors might find a high probable long signal from a considerable bullish reversal from the intraday chart.


