Published: October 27th, 2022
This week, Dogecoin surged upside unexpectedly, despite the bearish outlook for the broader crypto market. Two primary reasons behind the force are extensive market cues and aka “DOGEfather,” Elon Musk. The expected bullishness occurs to revive significant Doge holders' performances.
On Wednesday, DOGE was trading at $0.072, surging 14.52% upside, while the 24-hours gain was 21.22%. The increasing Crypto market cap and passing the $1 trillion mark in intraday trading was a fact for DOGE gain.
Another Dogecoin gaining factor was Elon Musk’s Twitter acquisition advancement. He presented at Twitter HQ, and although it has no relation with Dogecoin, he influenced the price on past justifications. The deal is expected to be closed on Friday, 28 Oct.
Whales have been quietly investing in Dogecoin for the last few months, following bearish market conditions and having remarkable domination over the supply. However, they might return since this week’s price action is promising for bulls.
If it can maintain its current bullish force, DOGE might hit 0.08$, a not testing support level in almost five months.
Let’s see the future price of Dogecoin (DOGE) from the DOGE/USDT Technical analysis:
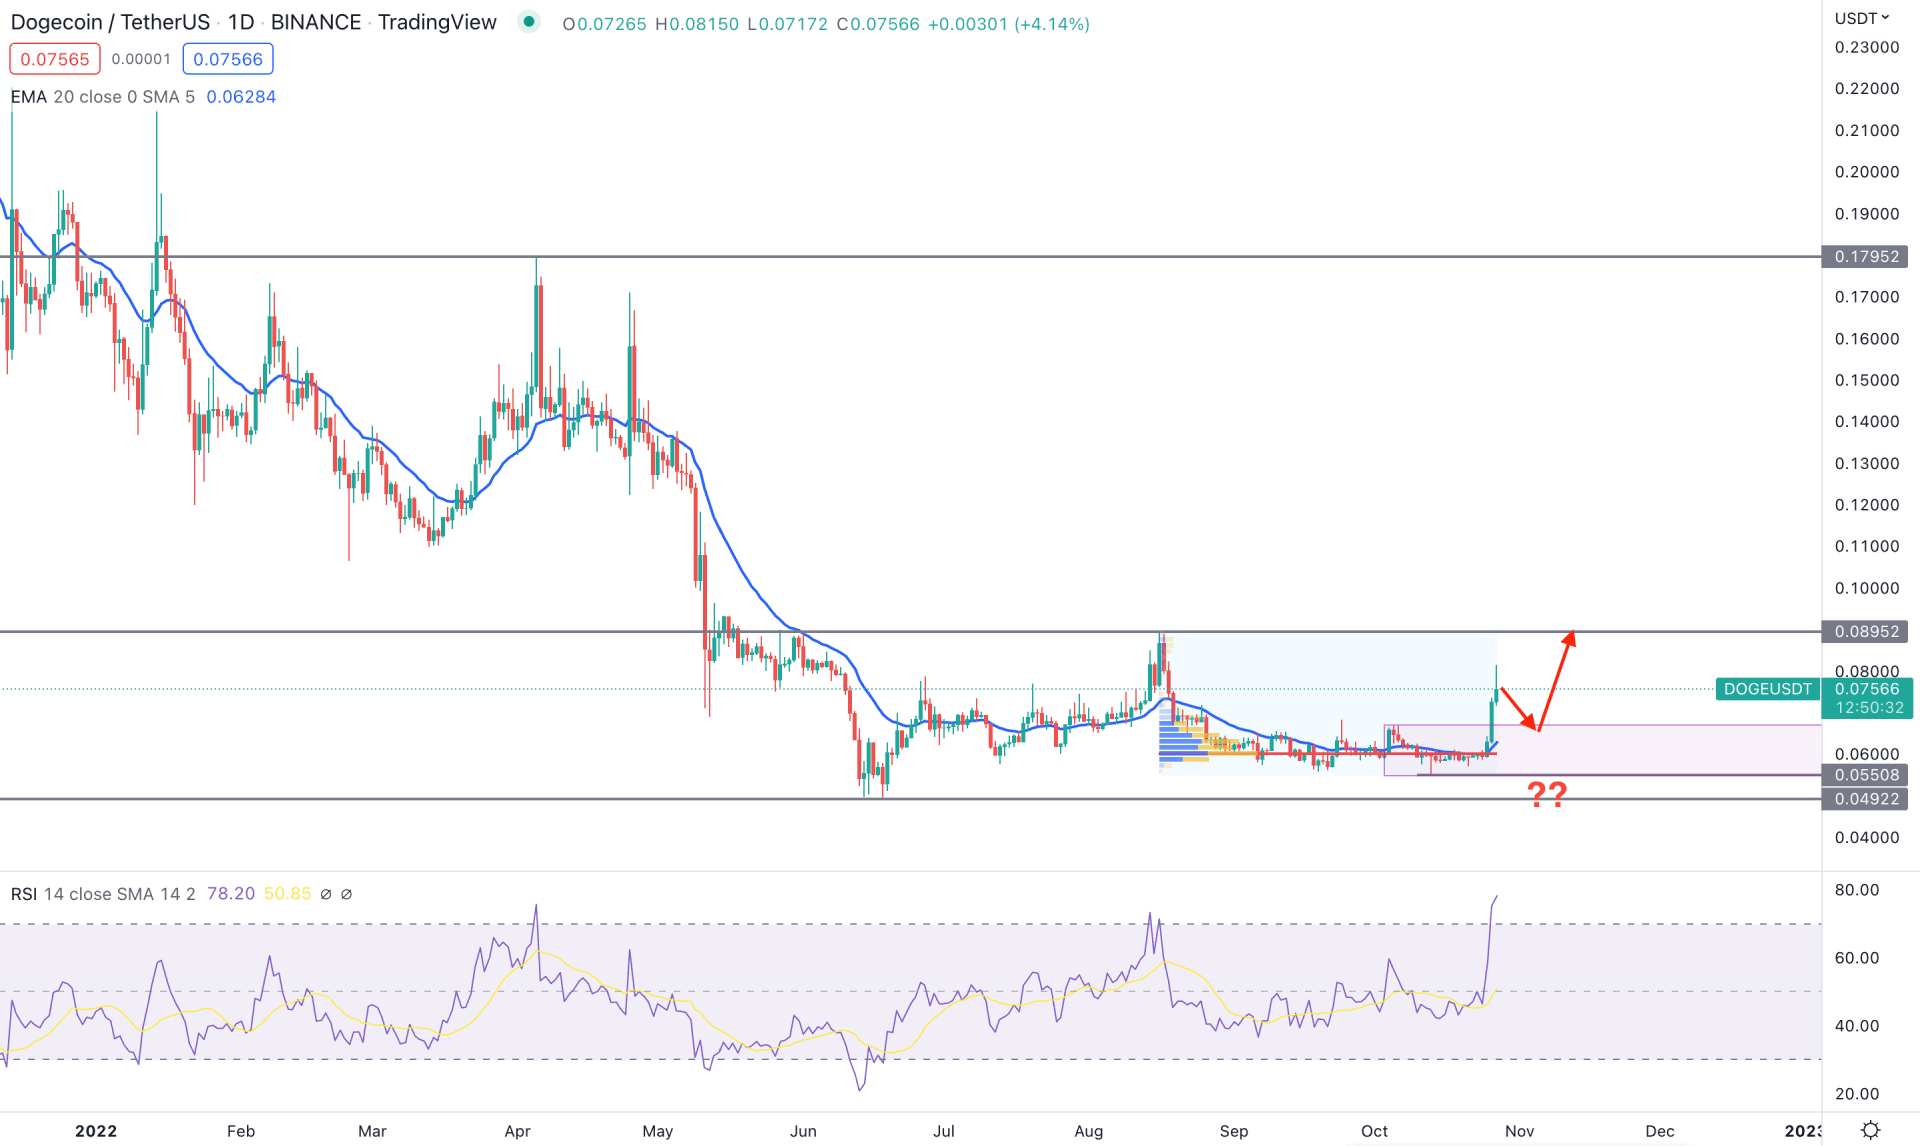
In the daily chart of Dogecoin, the broader market direction is still bearish, as the price has had lower lows since the beginning of 2022. Still, the price is trading 55% down from the yearly opening, and there is no significant higher low to indicate buyers' intervention in the market.
In recent trading days, bulls have shown an interest in this pair, where a 37% price increase was seen in the last three trading days. However, the gain is still minor compared to the broader market outlook, which needs more clues about buyers' presence in the market.
Based on the fixed range volume indicator, the highest volume level from the August high to October low is at 0.0601 level, which is below the current price. The recent buying pressure influenced by Elon Musk’s Twitter purchase came with a bullish break above this level.
The dynamic 20 DMA is below the price, nearing the high volume level, while the Relative Strength Index reached the overbought 70% area.
Based on the daily outlook of DOGE/USDT, the primary aim is to find another bullish rejection from near-term support levels before going long. However, the broader trend is still bearish, and a bullish break above the 0.0895 level could indicate a trend change.
The alternative trading approach is to wait for the price, breaking below the 0.5500 level with a bearish D1 candle. In that case, the selling pressure might extend, where the main aim is to reach the 0.4000 psychological level.
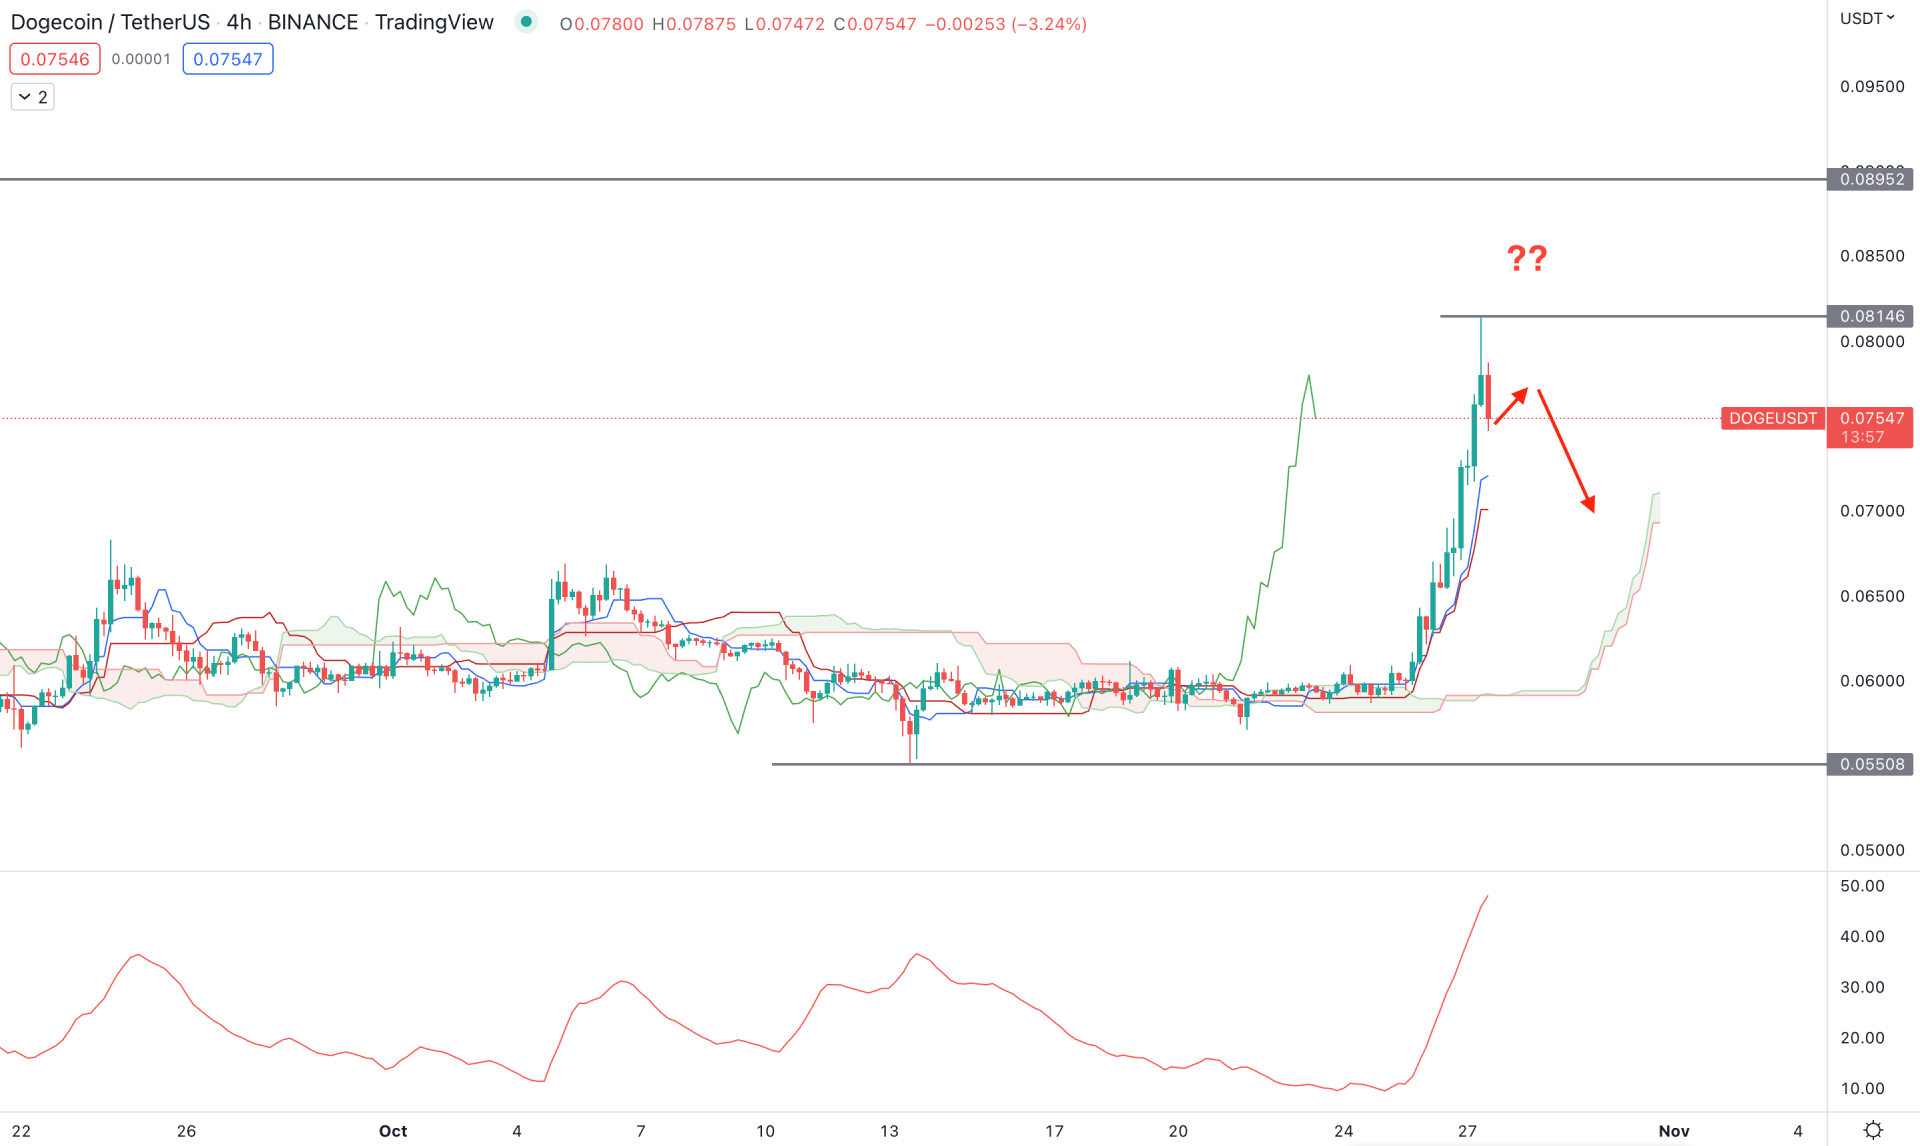
In the H4 chart, the market is overextended to the buyer's side as the price shoots higher with impulsive bullish pressure from the Cloud support level. The excessive buying pressure took the price above the 0.0800 key psychological level from where the profit taking initiated.
In the future cloud, the thickness is not supportive of the bullish trend continuation as the current gap between Senkou Span A and B is not wide. Moreover, the gap between the price and Kumo Cloud has extended, which is a sign of a minor correction on the sellers’ side.
In the indicator window, the ADX is above the 40.00 level, indicating a stable trending momentum. In that case, any selling pressure could come with a solid bearish momentum.
Based on the H4 context, the main aim of this pair is to find a bearish opportunity as long as it remains below the 0.0814 level. In that case, the ultimate target for the bearish pressure is the cloud support area, where breaking below the 0.0550 could indicate a new bearish trend.
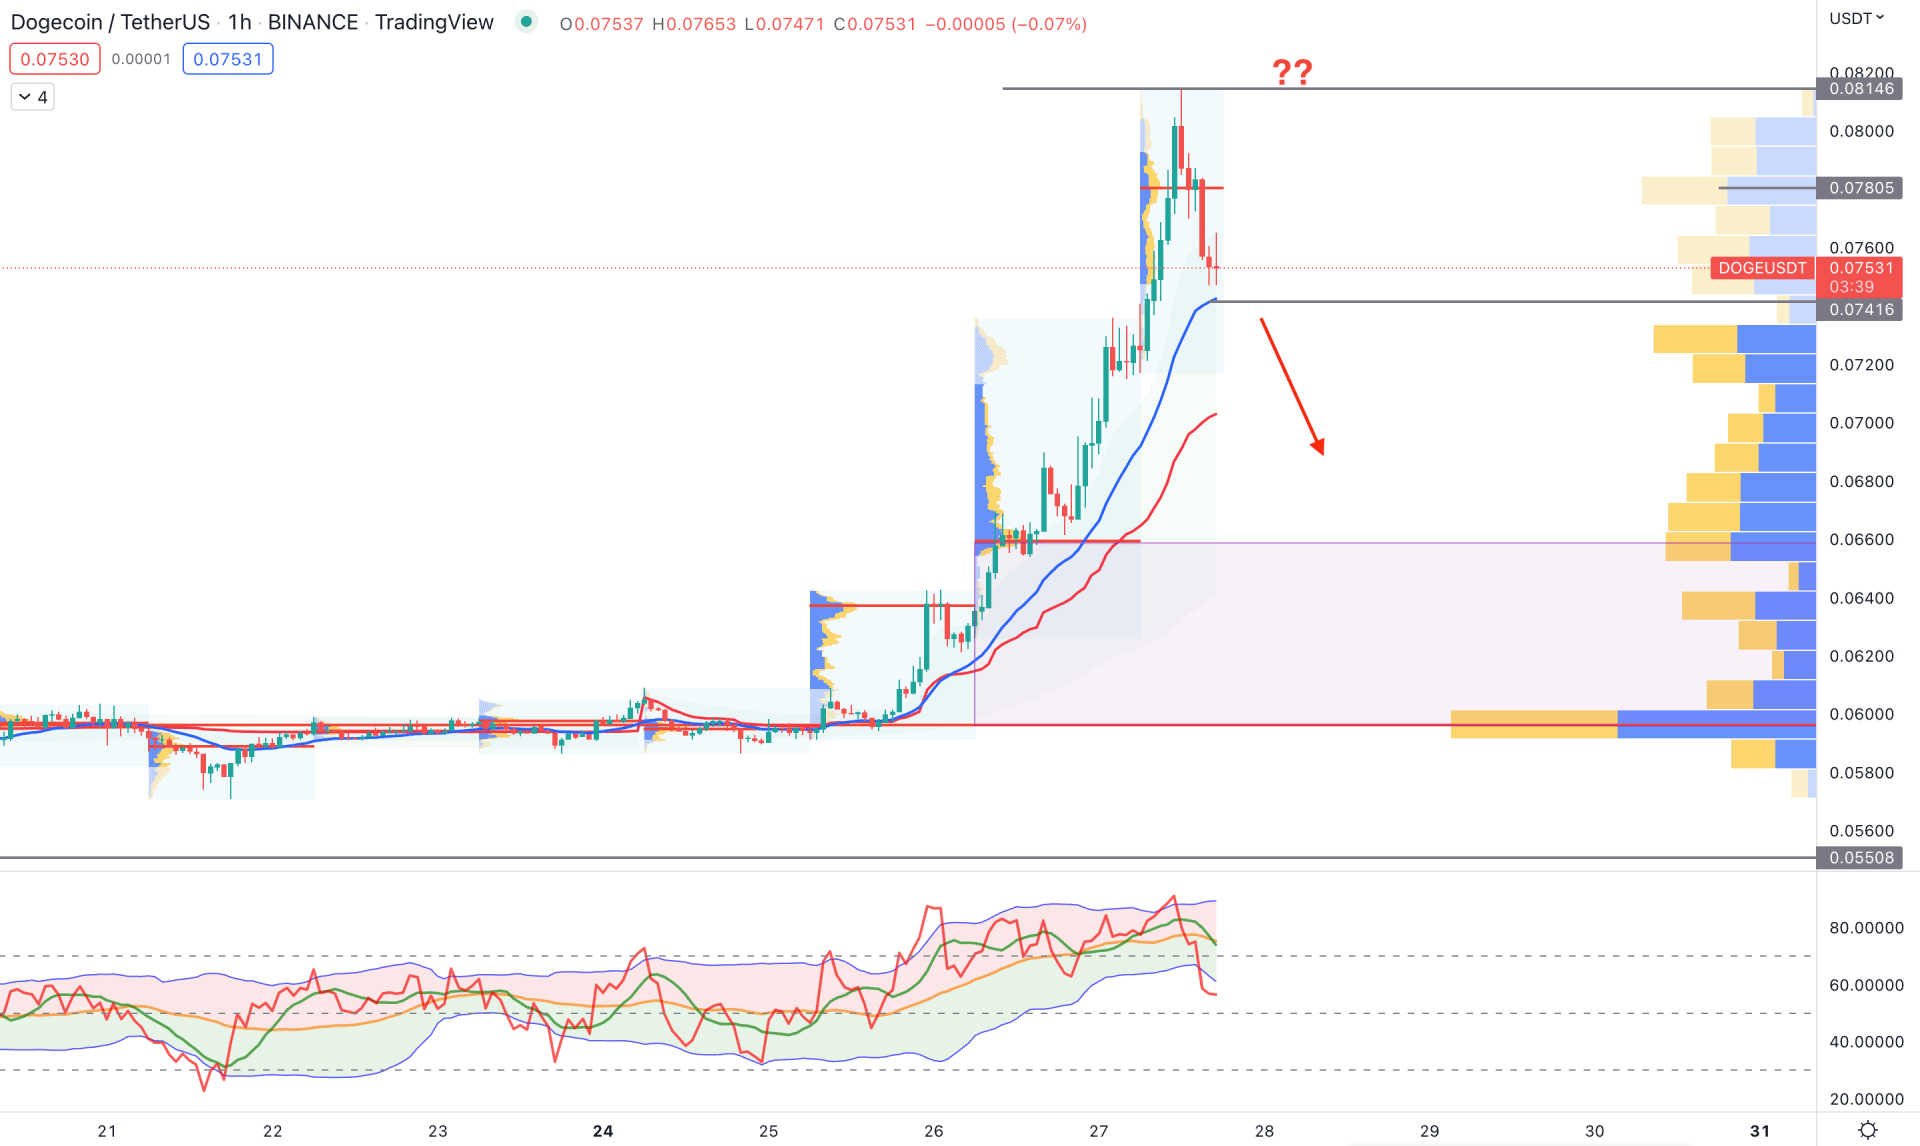
In the hourly chart, the broader market outlook for DOGE/USDT is bullish as the current price is above the dynamic 20 EMA and weekly VWAP. Moreover, these dynamic levels are sloping higher, which signifies an emerging buying momentum.
As per the visible range high volume indicator, this chart's highest trading volume level is below the price, where the gap indicates a minor bearish correction. After reaching the 0.0814 level, sellers grabbed the wheel, boosted by the high volume level at 0.0780.
The indicator window also shows a bearish possibility where the current TDI level is below the 60% area. In that case, the selling possibility in this pair is potent if the H1 candle closes below the 20 EMA level.
On the other hand, any immediate bullish recovery from the dynamic level with an H4 close could offer a trend continuation, targeting the 0.0900 area.
Based on the current price behavior, DOGE/USDT long-term bullish trend needs more clues in the price chart, where the current buying pressure needs a stable price above the 0.0850 level.


