
Published: May 29th, 2024
In the previous month, DocuSign's stock declined 0.05%, lower than the gains of 1.36% for the Business Services sector and 4.03% for the S&P 500.
Enthusiasts await DocuSign's forthcoming earnings report, slated for June 6, 2024. The company anticipates disclosing earnings per share (EPS) of $0.79, representing a 9.72% surge compared to the corresponding quarter of the previous year. The consensus estimate for revenue stands at $706.07 million, reflecting a 6.76% increase from the preceding year.
Investors should also closely observe recent adjustments to analyst projections for DocuSign. These revisions frequently indicate the most recent developments in the company's operations and may indicate analyst optimism regarding its prospective profitability.
An additional critical aspect is valuation. DocuSign's Forward P/E ratio currently stands at 17.68, which is comparatively lower than the industry mean of 23.46.
Furthermore, it is worth noting that DocuSign maintains a PEG ratio of 1.33. This ratio, akin to the P/E ratio, considers the anticipated growth of the company's earnings. As of the previous day's close, the mean PEG ratio for the Technology Services sector was 1.6.
As P/E and PEG ratios are below the industry average, we may expect any bullish pressure to come with a solid trend trading opportunity.
Let's see the further aspect of this stock from the DOCU technical analysis:
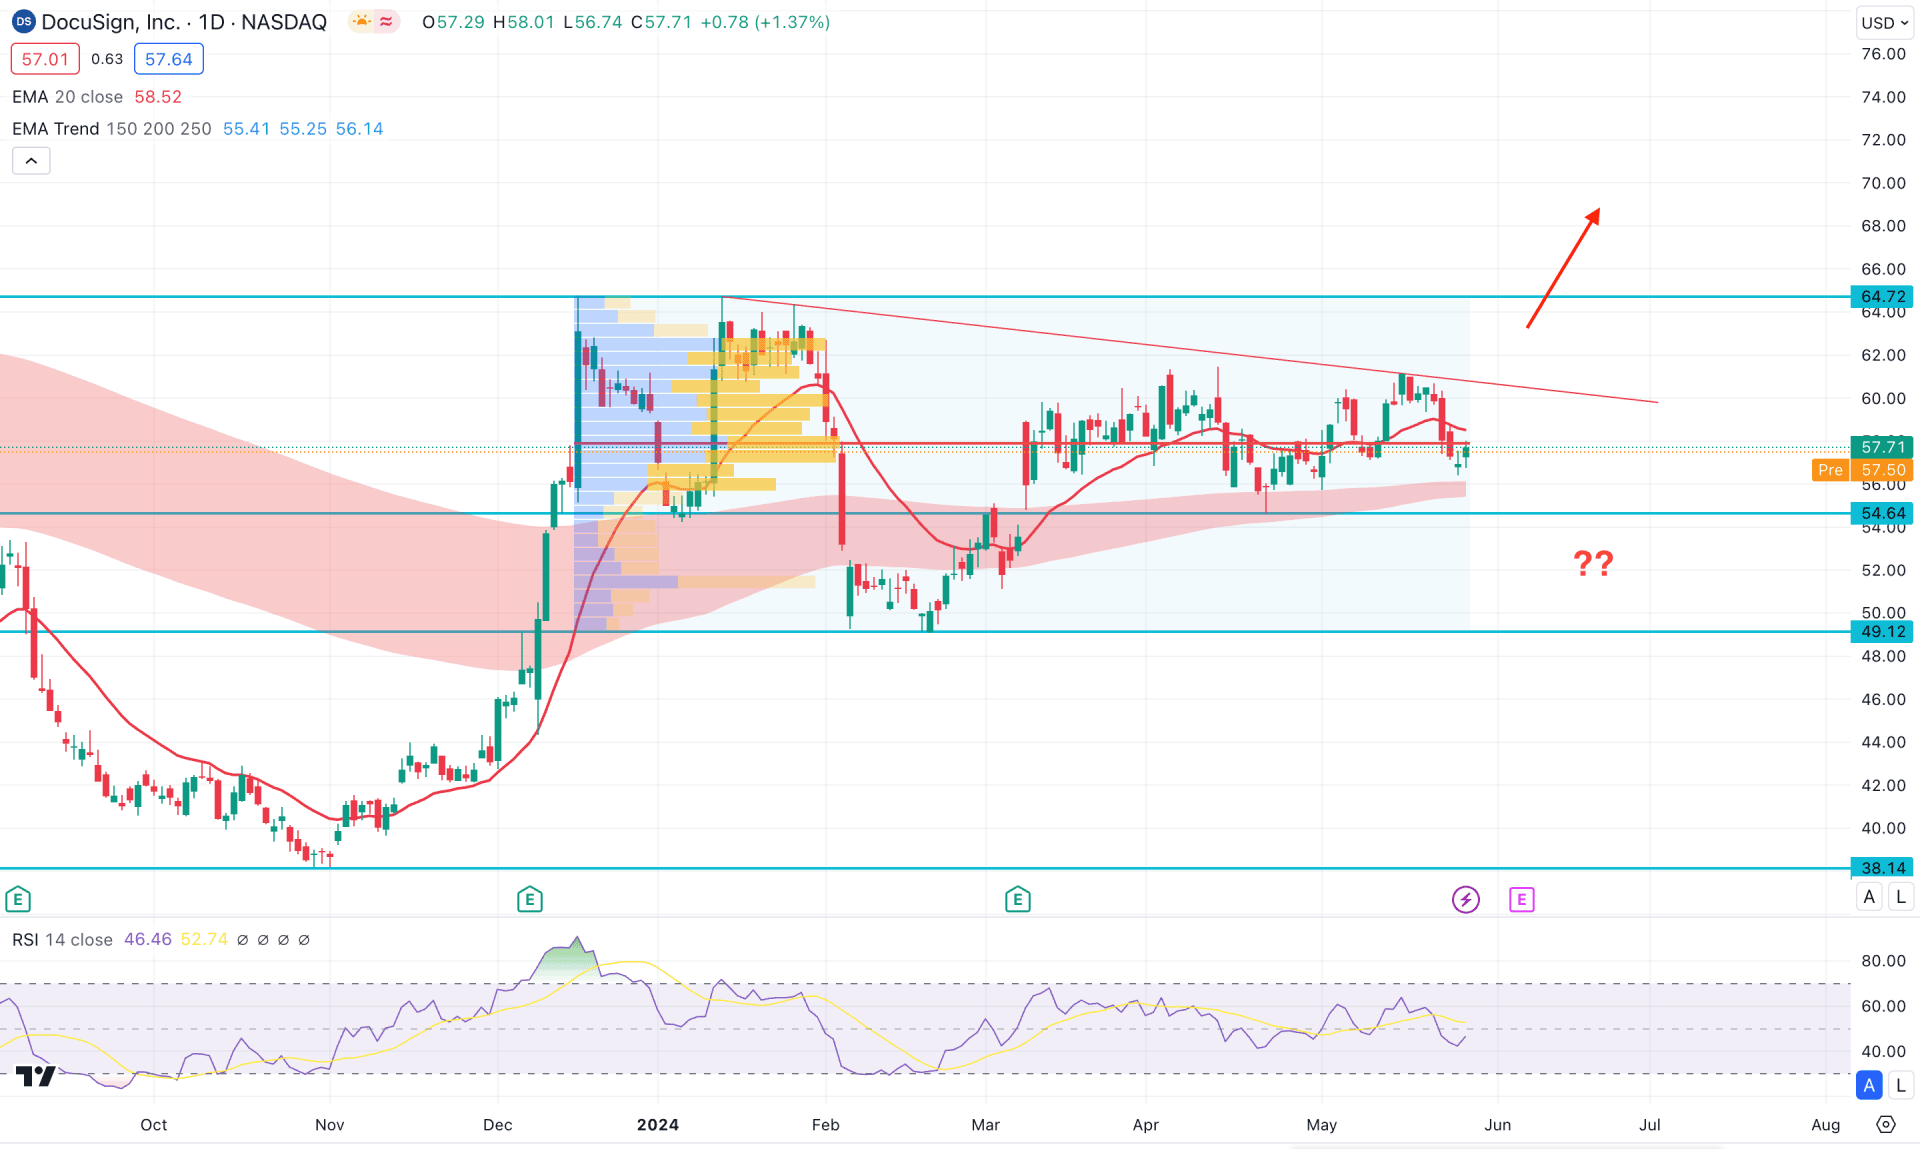
In the daily chart of DOCU, the most recent price action remains corrective as no clear direction is visible below the ongoing trendline resistance. Primarily, the main trading aim in this stock is to follow the long-term market trend, validating from a potential range breakout.
In the higher timeframe, the price is trading at the record low, as shown in the monthly chart. However, the ongoing monthly candle trades sideways after a bullish impulse in December 2023. As the current price holds the gain, a bullish continuation might appear after having a valid price action. The weekly price trades sideways, where the current price trades below the 61.16 weekly resistance, which needs to be overcome before anticipating a bull run.
In the volume structure, the largest activity level since December 2023 is at 57.91 level, which is just above the current price. Considering the current consolidation below the trendline resistance, a valid bullish pressure above the high volume line could work as an additional long signal for this stock.
In the daily chart, the major market trend is found from the Moving Average wave consisting of 150 to 250 MA lines. As the wave is below the current price, we may consider the major trend as bullish. However, thickness suggests a flat momentum, which increases the possibility of a potential breakout.
In the secondary window, the current Relative Strength Index (RSI) suggests a neutral moment as the current line hovers at the 50.00 neutral point.
Based on the daily market outlook of DOCU, the long-term market trend is valid where a sufficient bullish signal is needed to validate the buying pressure. In that case, a bullish breakout from the trendline resistance with a daily close above the 61.11 level could validate the bullish signal, targeting the 74.16 resistance level.
On the other hand, a bearish pressure below the MA wave with a daily candle below the 54.64 static level could lower the price towards the 38.14 support level.
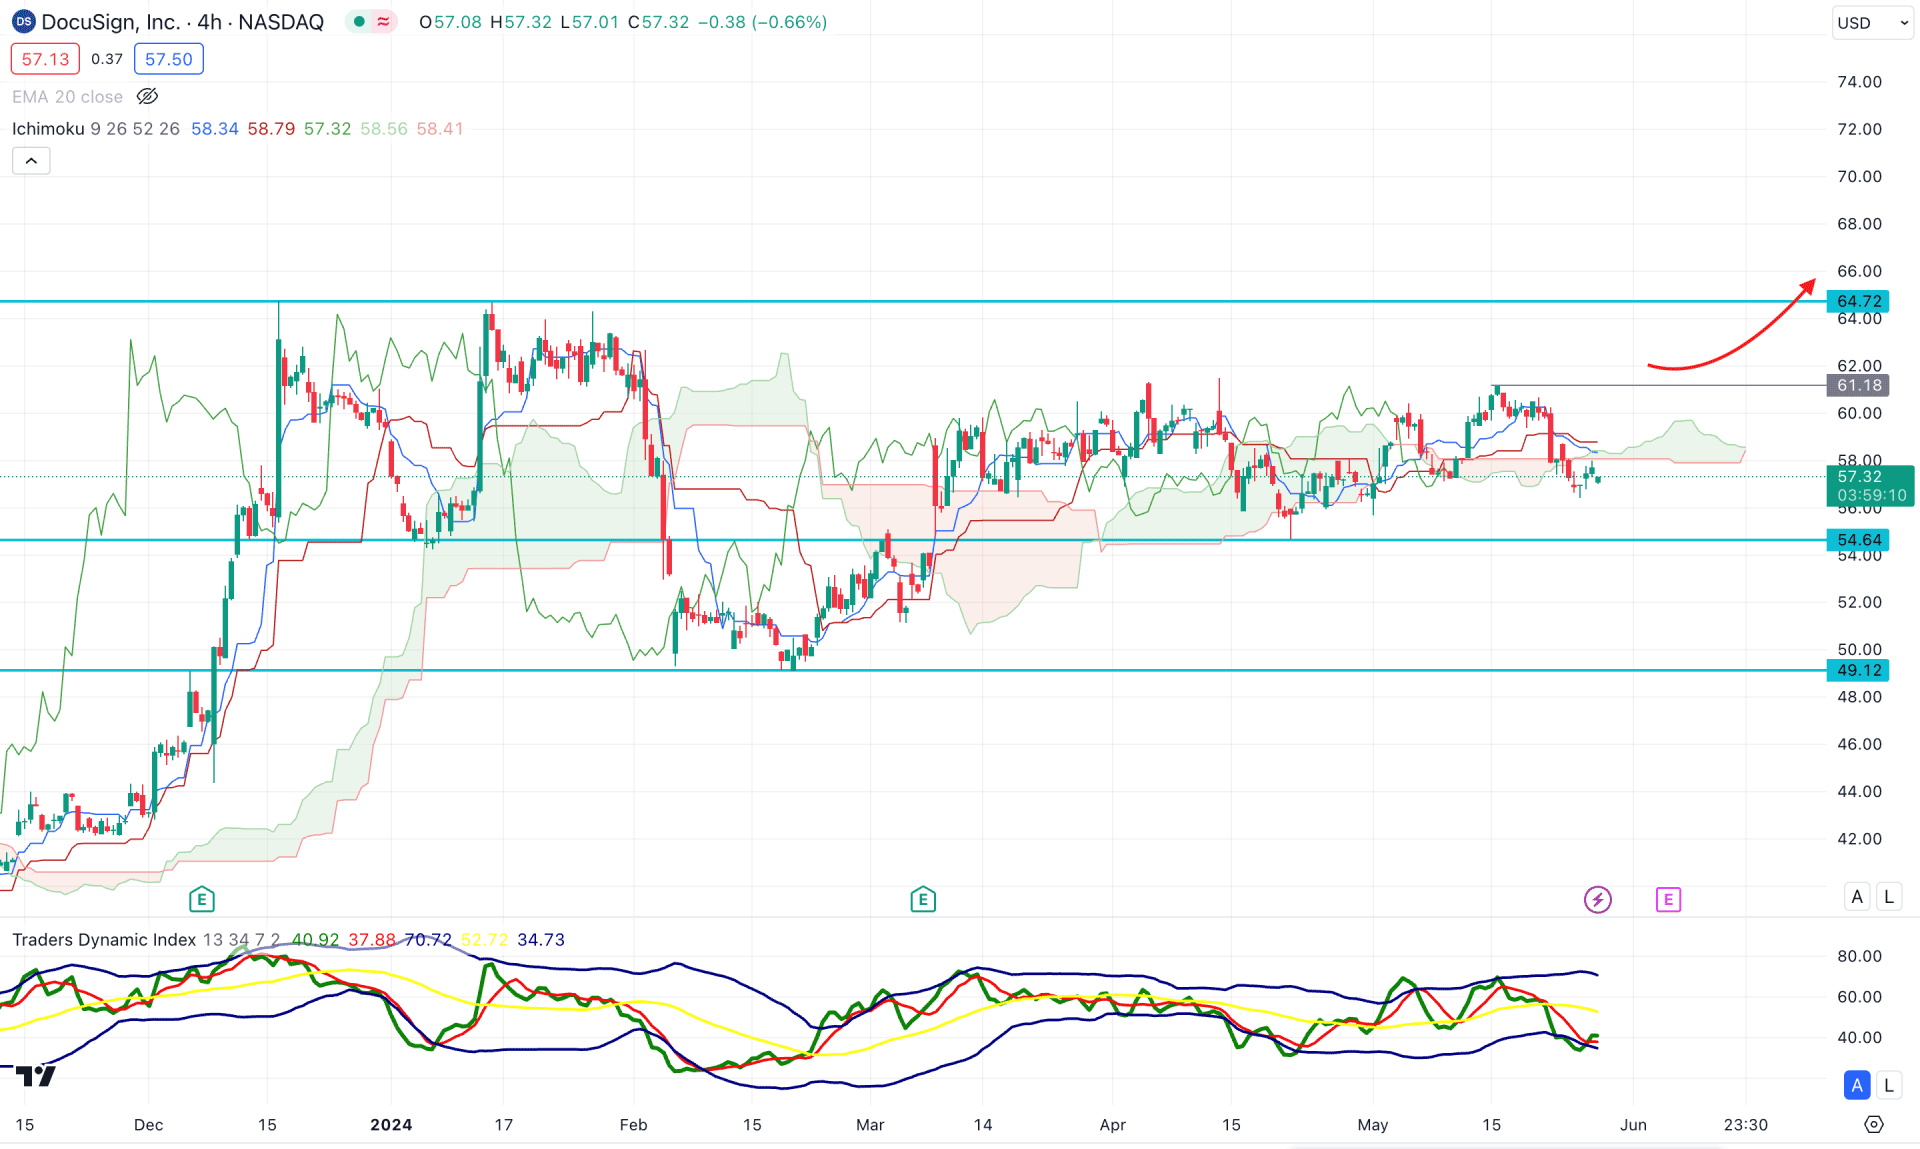
In the H4 timeframe, the overall market momentum is corrective, where the current price trades sideways below the dynamic Ichimoku Cloud zone. Moreover, the future cloud suggests an additional sign of a corrective pressure as Senkou Span A and B are closer together.
In the indicator window, the current Traders Dynamic Index (TDI) level is at the lower band, which suggests an extreme selling pressure in the market. In that case, a bullish rebound in the main price with the TDI above the 50.00 level could be a potential long opportunity.
Based on the H4 outlook, an immediate bullish rebound with an H4 candle above the 61.18 level could open a long opportunity, targeting the 70.00 zone. However, an immediate bearish continuation could lower the price towards the 52.00 level before opening a long signal.
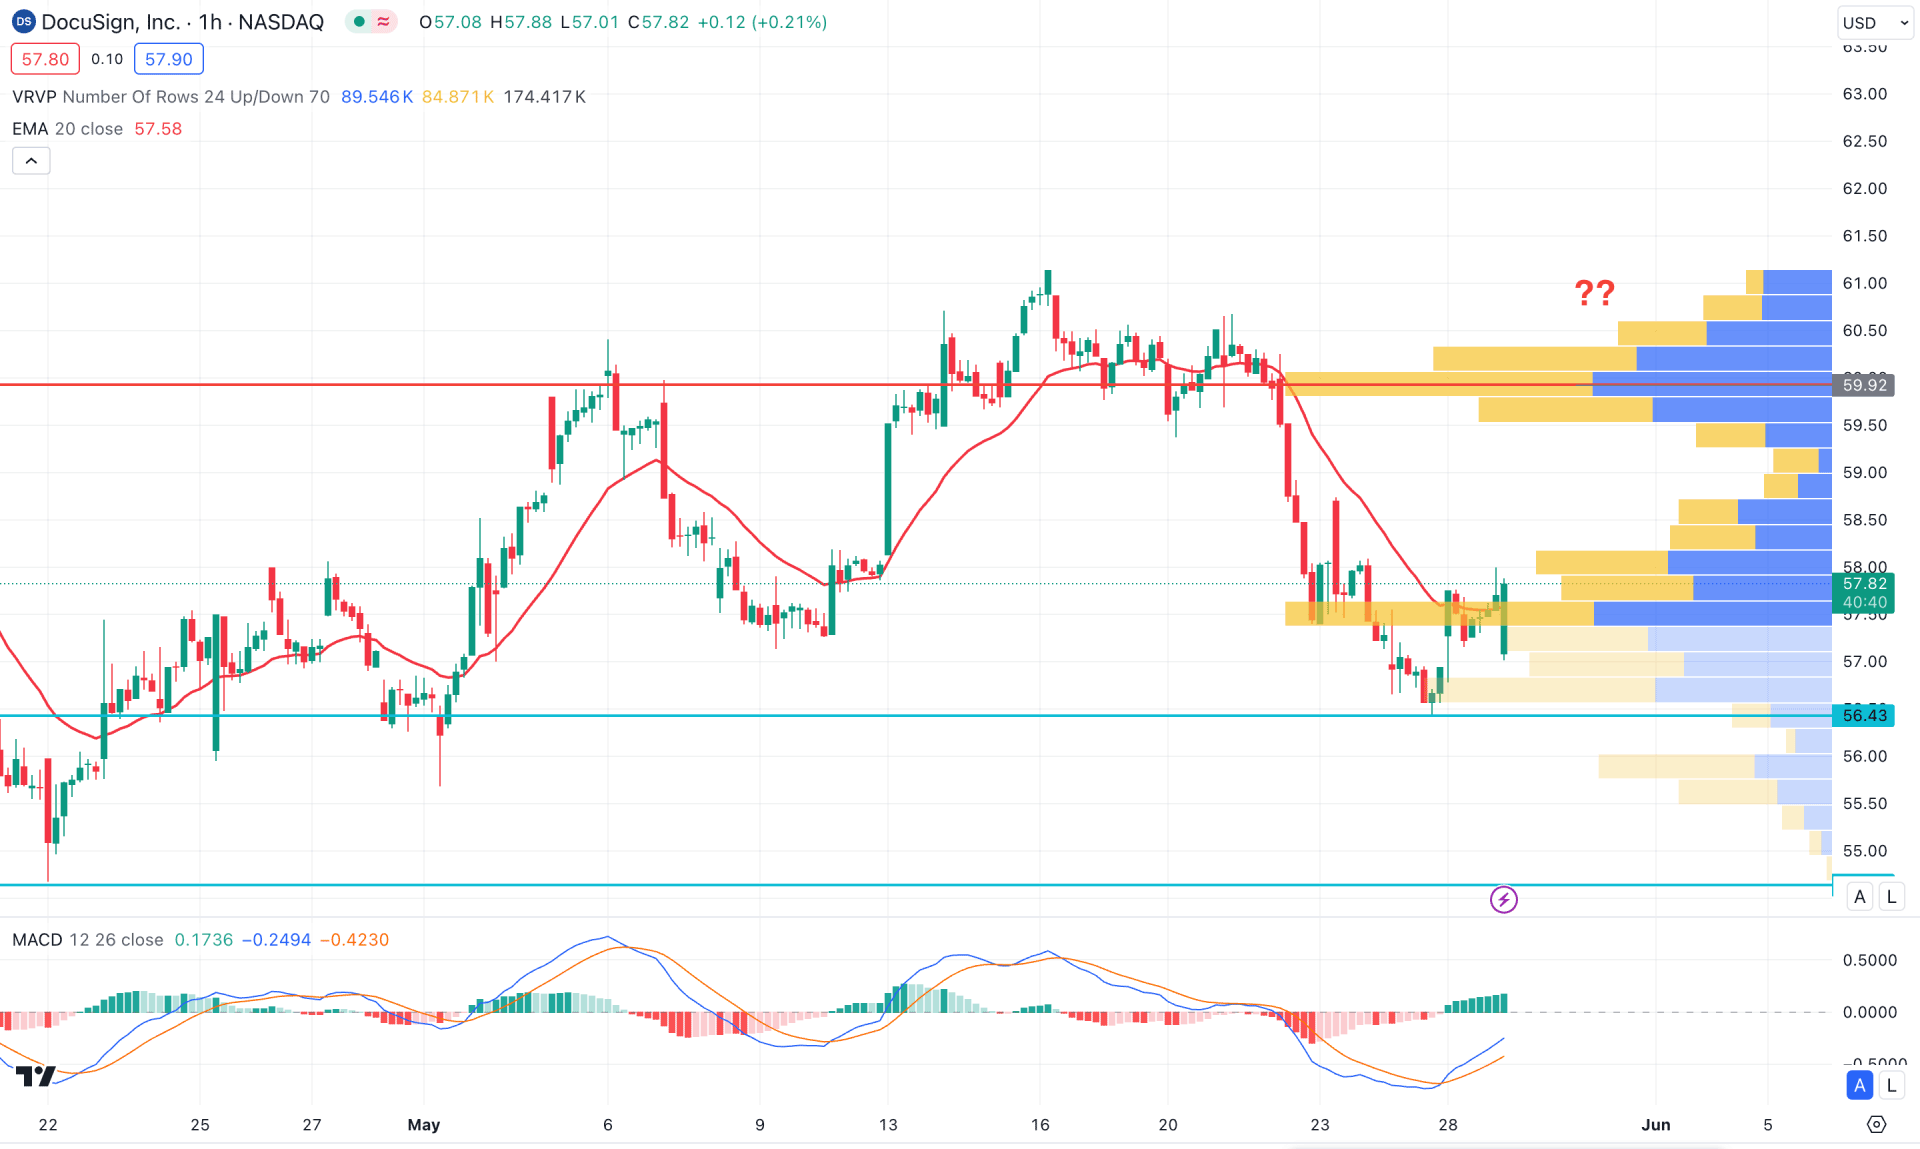
In the hourly chart of DOCU, the visible range high volume level is above the current price, which suggests an active selling pressure in the market. Moreover, the dynamic 20-hour EMA is the immediate resistance, which supports the bearish pressure.
In the indicator window, the MACD Histogram remains bullish, where the current signal line shows a bullish crossover at the bottom. In that case, the main price might show a bullish correction but as a mean reversion.
Based on the hourly outlook, any corrective bullish pressure might offer a short opportunity after validating below the 20 EMA. However, the continuation of bullish pressure with a stable market above the 59.92 high volume line could open a bullish signal, targeting the 70.00 zone.
Based on the current market outlook, DOCU has a higher possibility of continued upward pressure after a valid trendline breakout. In that case, an early bullish signal might come once the hourly price moves beyond the intraday visible range high volume level.


