Published: April 25th, 2023
The Walt Disney Company (NYSE: DIS) stock has yet to reach its previous highs, so patience is required for investors. Despite this, some prominent analysts believe investors will benefit from positive factors.
The share price has remained roughly $100 for nearly a year, almost half its peak value in early 2021 and comparable to its value between 2015 and 2019. The pandemic caused a significant decline in DIS due to the closure of theme parks and the entrance of Netflix and Amazon Prime into the competitive streaming market.
Nevertheless, Disney has emerged victorious, having survived the epidemic and establishing itself as a legitimate streaming entity with Disney+. However, uncertainties remain, including the recent rehiring of former CEO Bob Iger and the loss of Disney+ subscribers. Due to the increased monthly fees, the company is taking steps to reduce corporate expenditure and generate free cash flow.
If you are keen to invest in a stable business, DIS would be a good choice, but a sufficient understanding of price behavior is needed before making an investment decision.
Let’s see the future outlook of this stock from the Disney (DIS) technical analysis:

In January, a strong bullish candle appeared in the DIS monthly chart, influencing bulls to extend the momentum in February. After making a new swing high In February, bears joined the market and made a bearish monthly close. However, sellers failed to breach the January 2023 low and showed a rebound in the next month. Bulls may regain momentum anytime if the overall structure remains above the January low.
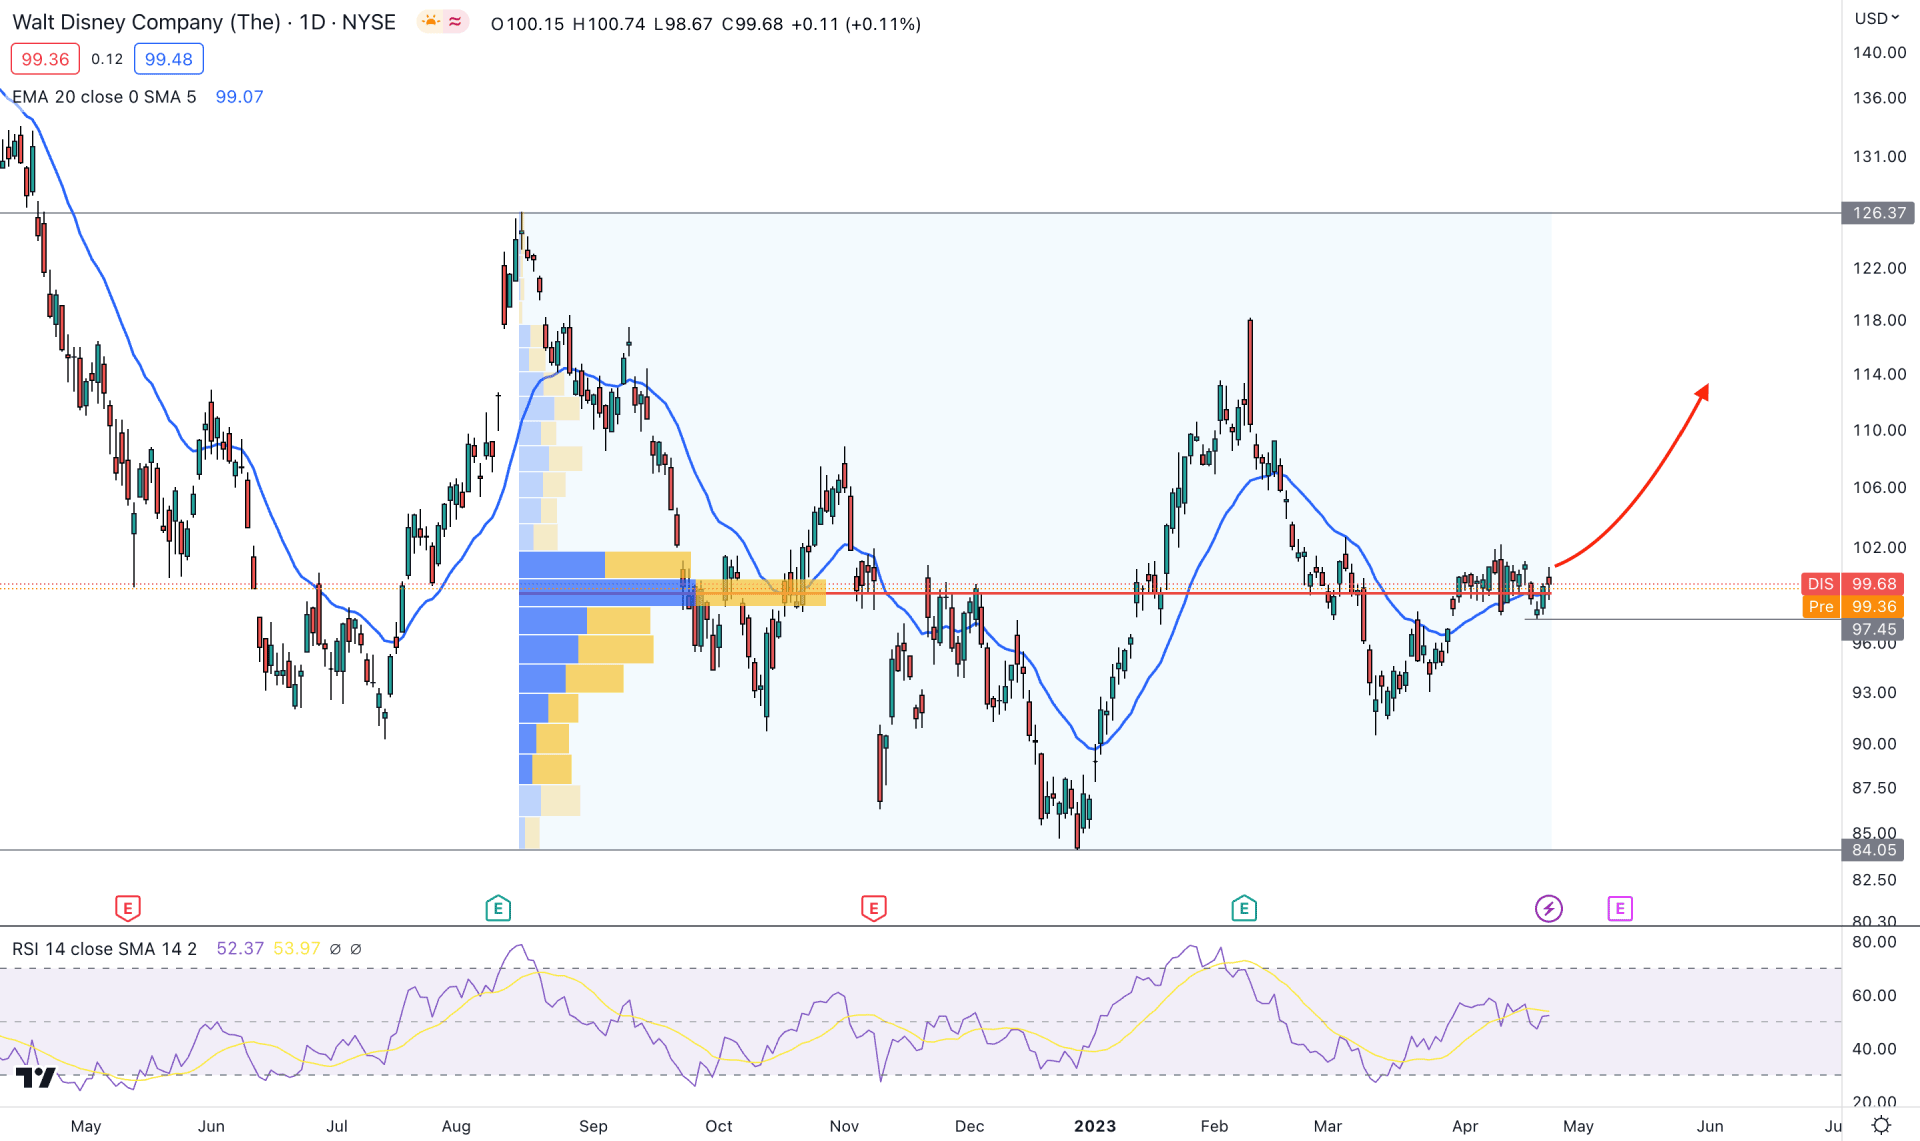
In the daily chart, the most recent price shows a corrective price action backed by a bullish trend. Moreover, the high volume level since 16 August 20222 is just below the current price. It is a sign that the current price is in the buyers' zone, and any bullish trading opportunity could come with a higher winning ratio.
In the current tradable range, a bullish Quasimodo is formed at the 84.05 level, which is a valid bottom. On the upside, a similar price pattern is available at the 126.37 level, from where a strong downside pressure came. As the current price is trading below the 50% Fibonacci Retracement level from 126.37 high to 84.05 low, any bullish opportunity could come with a higher success rate.
In the main price chart, the 20-day EMA is closer to the price, working as an immediate support level. Moreover, the current Relative Strength Index (RSI) is at the 50% neutral zone, from where buying pressure may extend until the RSI reaches the 70% level.
Based on the daily structure, a bullish breakout with a daily candle above 103.00 level coils offer a long opportunity, targeting the 127.00 level.
On the other hand, an immediate selling pressure with a strong break below the 93.00 level could lower the price towards the 84.00 area.

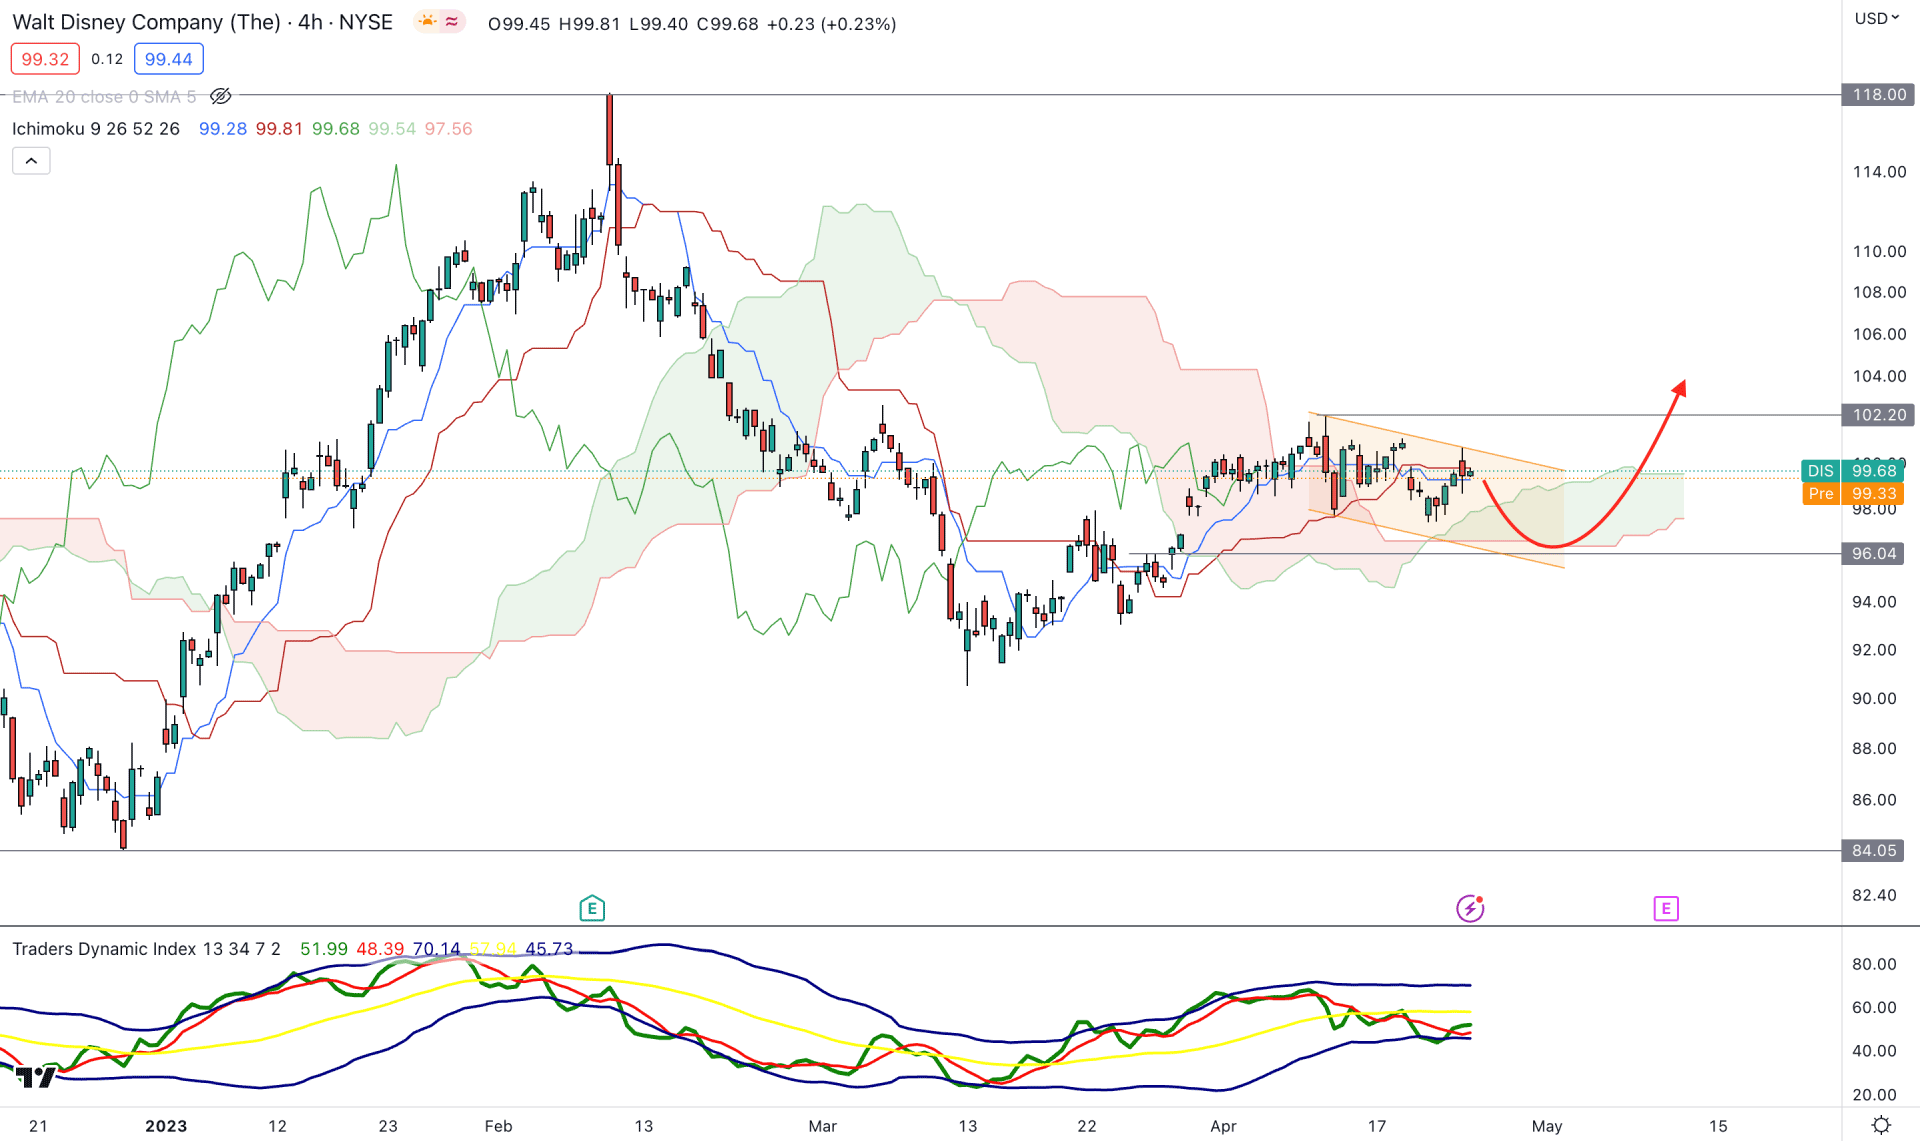
In the H4 chart, the broader market outlook is corrective as the recent price trades within the Ichimoku Kumo Cloud. Moreover, the recent price trades within a descending channel, where a strong breakout is needed before finding a stable trend.
In the future cloud, the Senkou Span A is above B, and both lines are aimed higher. It indicates that short-term and medium-term bulls are active in the market. Moreover, the current Lagging Span is closer to the price, which is a sign of a correction.
In the indicator window, the Traders Dynamic Index (TDI) shows the strength of bulls/bears in the market where the current level is at a 50% neutral level. As the TDI line shows a rebound from the lower band, a new level above the 50.00 area could indicate a long trading opportunity.
Based on the H4 structure, a new swing high above the 102.20 level could offer the first buying opportunity. However, a bearish correction and rebound from the 96.00 support level could offer another buying opportunity for this instrument.
In both cases, the primary target level is at the 118.00 level, but a break below the 95.00 level with a bearish H4 candle could lower the price toward the 84.00 area.

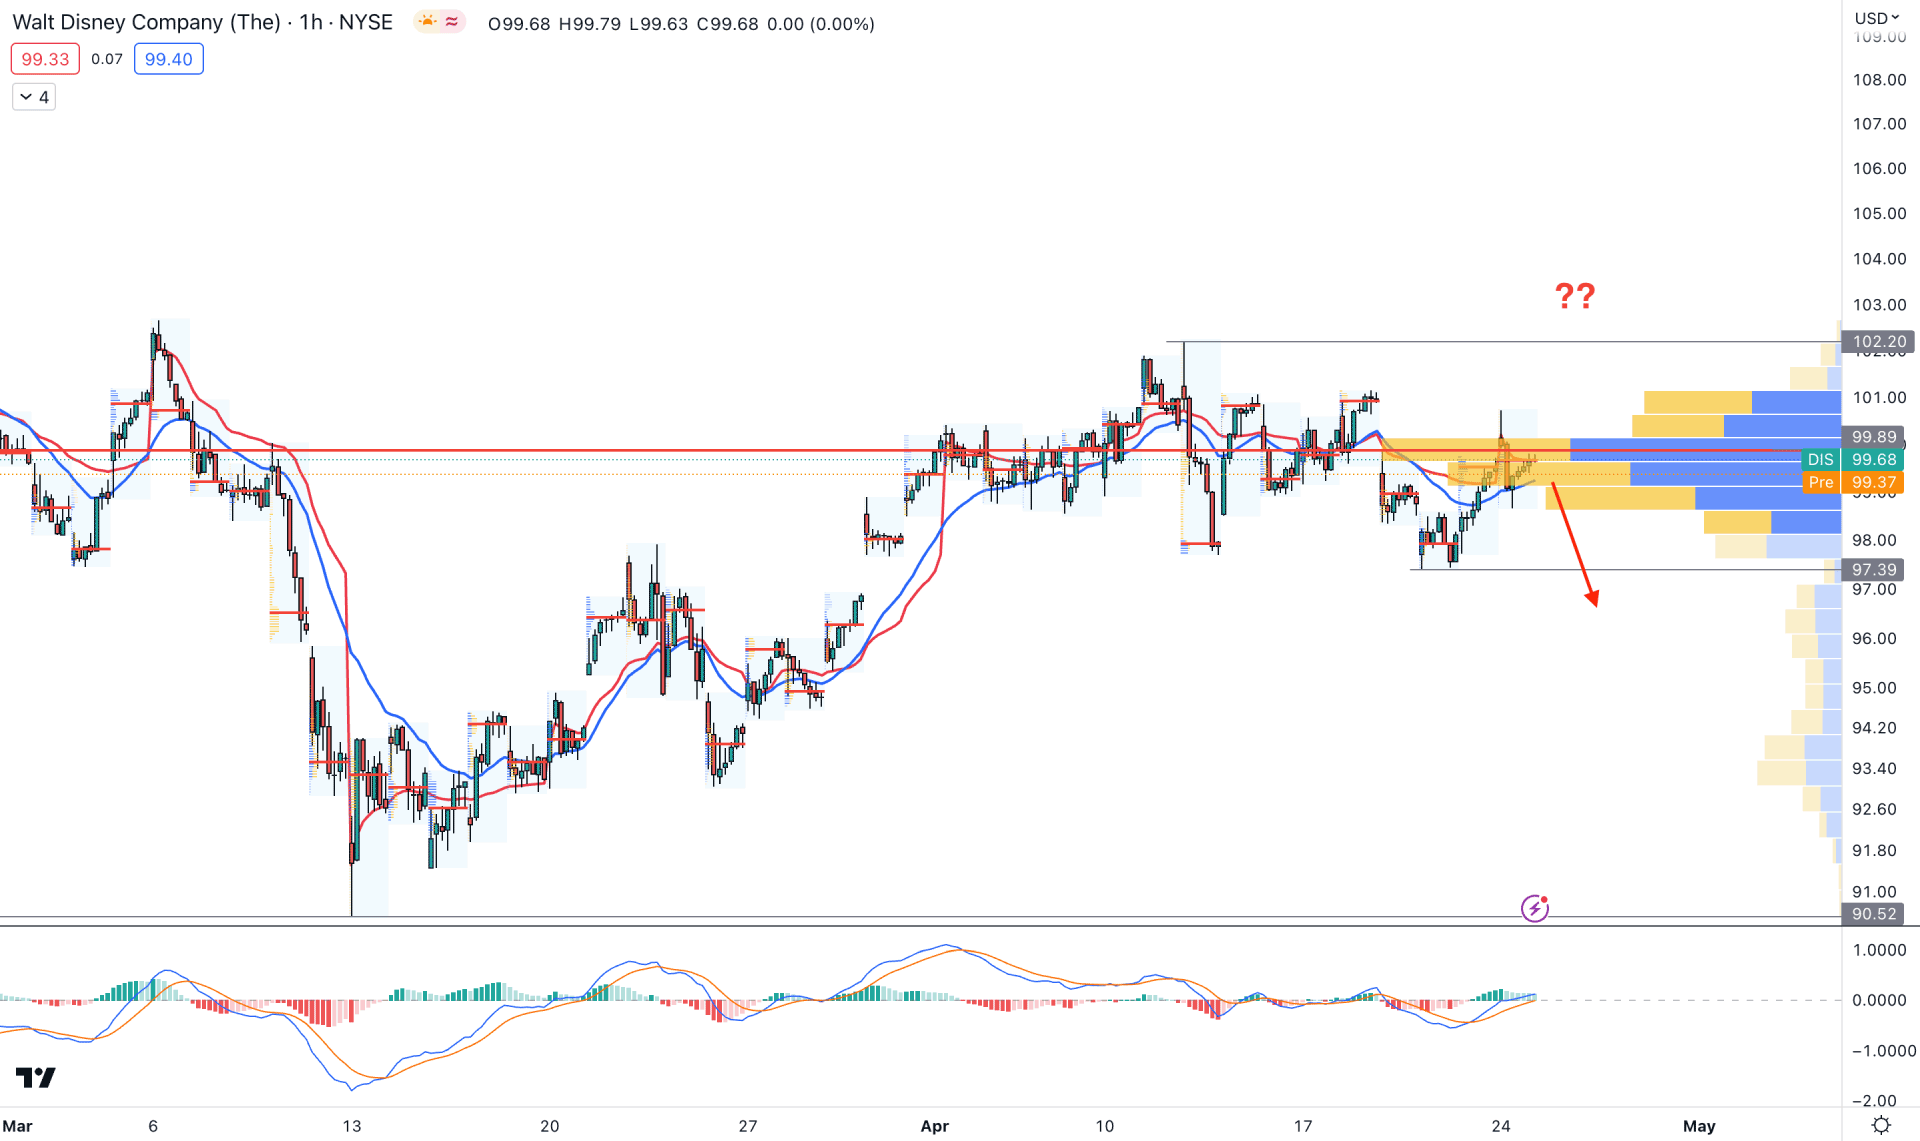
In the H1 chart, the current price trades below the visible range high volume level. It is a sign of downside pressure in the market, which can offer a short opportunity if a new H1 candle comes below the 97.39 support level.
On the other hand, the dynamic 20 EMA and weekly VWAP are above the price, working as a resistance. However, the MACD Histogram is above the neutral line, while MACD EMA’s show buying pressure.
Based on the H1 structure, a new H1 candle above the 102.20 level could validate the bullish trend. As long as the price trades below the visible range high volume level, downside pressure is potent, targeting the 97.00 area.
Based on the current price outlook, Disney Stock (DIS) trades within a bullish pre-breakout structure. A new daily candle above the 103.00 level would validate the range breakout, which can open a long opportunity.